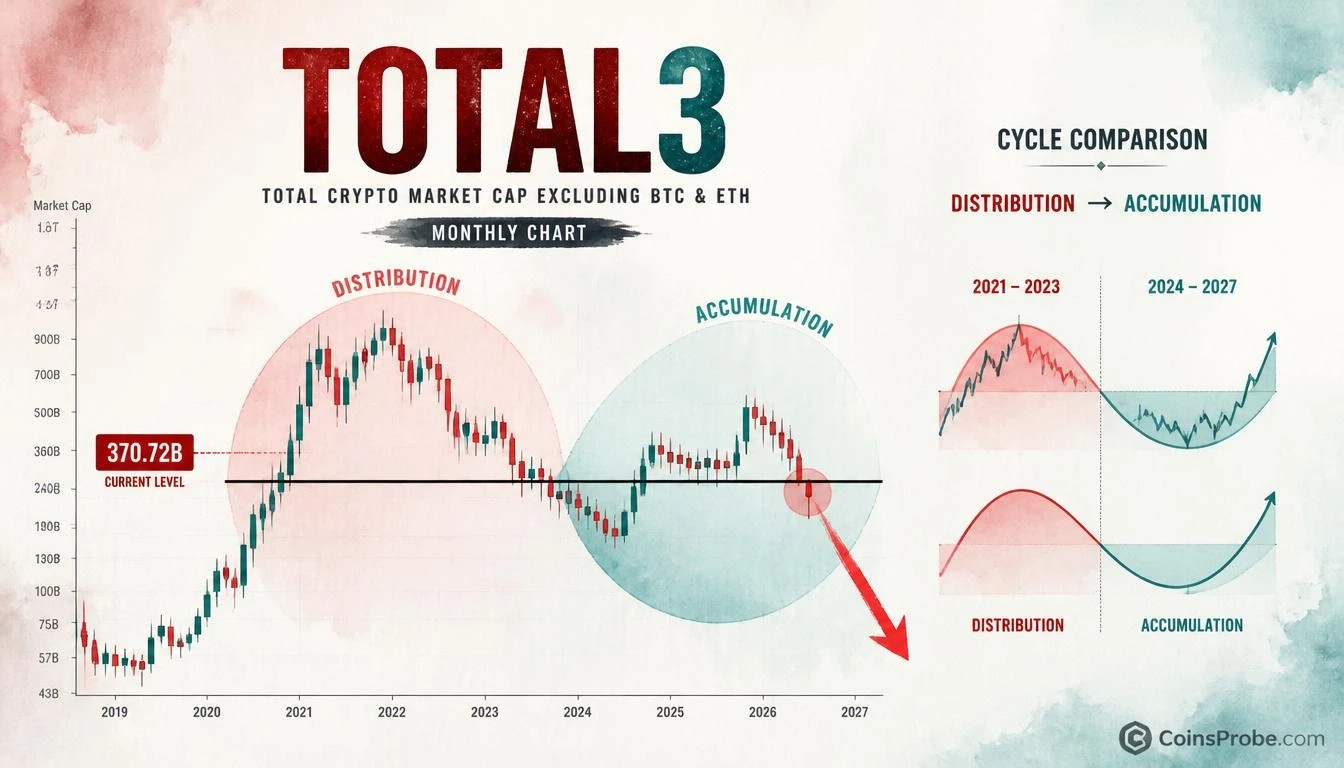

- TOTAL3 prints at 370.72B — confirmed breakdown below monthly horizontal support on the altcoin aggregate chart
- Analyst flags the structure as "absolutely horrendous" — chart mirrors the 2021–2023 distribution-then-accumulation cycle
- Monthly close back above the broken support line is the sole condition that would invalidate the bearish reading
The altcoin market — stripped of Bitcoin, Ethereum, and stablecoins — has broken below a critical monthly support level, and the structure it has left behind is alarming. TOTAL3 is currently printing at approximately 370.72B, sitting below the horizontal support line that defined the base of the second major distribution cycle on the monthly chart.
One crypto analyst, posting on November 20, 2026, described the TOTAL3 monthly chart in stark terms: “This looks absolutely horrendous.” That is not hyperbole for engagement — it is a precise read of what the chart is showing. The breakdown is confirmed. The structure now mirrors the worst phase of the 2021–2023 cycle.
What TOTAL3 Actually Measures
TOTAL3 is the aggregate market capitalization of all cryptocurrencies excluding Bitcoin, Ethereum, and stablecoins. It is the cleanest proxy for the broader altcoin market — removing the two largest assets strips away their structural dominance and isolates the speculative layer of crypto. When TOTAL3 breaks down on a monthly timeframe, it is not noise. Monthly candles take 30 days to form. A monthly close below support is one of the most structurally significant signals any chart can produce.
The Monthly Chart — Breakdown Confirmed
The chart shared by the analyst overlays two full market cycles on the TOTAL3 monthly timeframe, spanning approximately 2020 through a projected 2029 endpoint. Each cycle follows an identical two-phase structure: a pink Distribution zone — where price peaks and capital exits — followed by a teal Accumulation zone, where price bottoms and smart money re-enters at deeply discounted levels.
In the first cycle (2021–2023), TOTAL3 peaked during the Distribution phase before collapsing into an extended Accumulation zone. A horizontal support line marks the floor of that cycle. The same horizontal support level has now been drawn across the base of the second cycle — and TOTAL3 has broken below it. Price at 370.72B sits beneath that line. The breakdown is not a test. It is not a retest. It is a confirmed monthly structural failure.
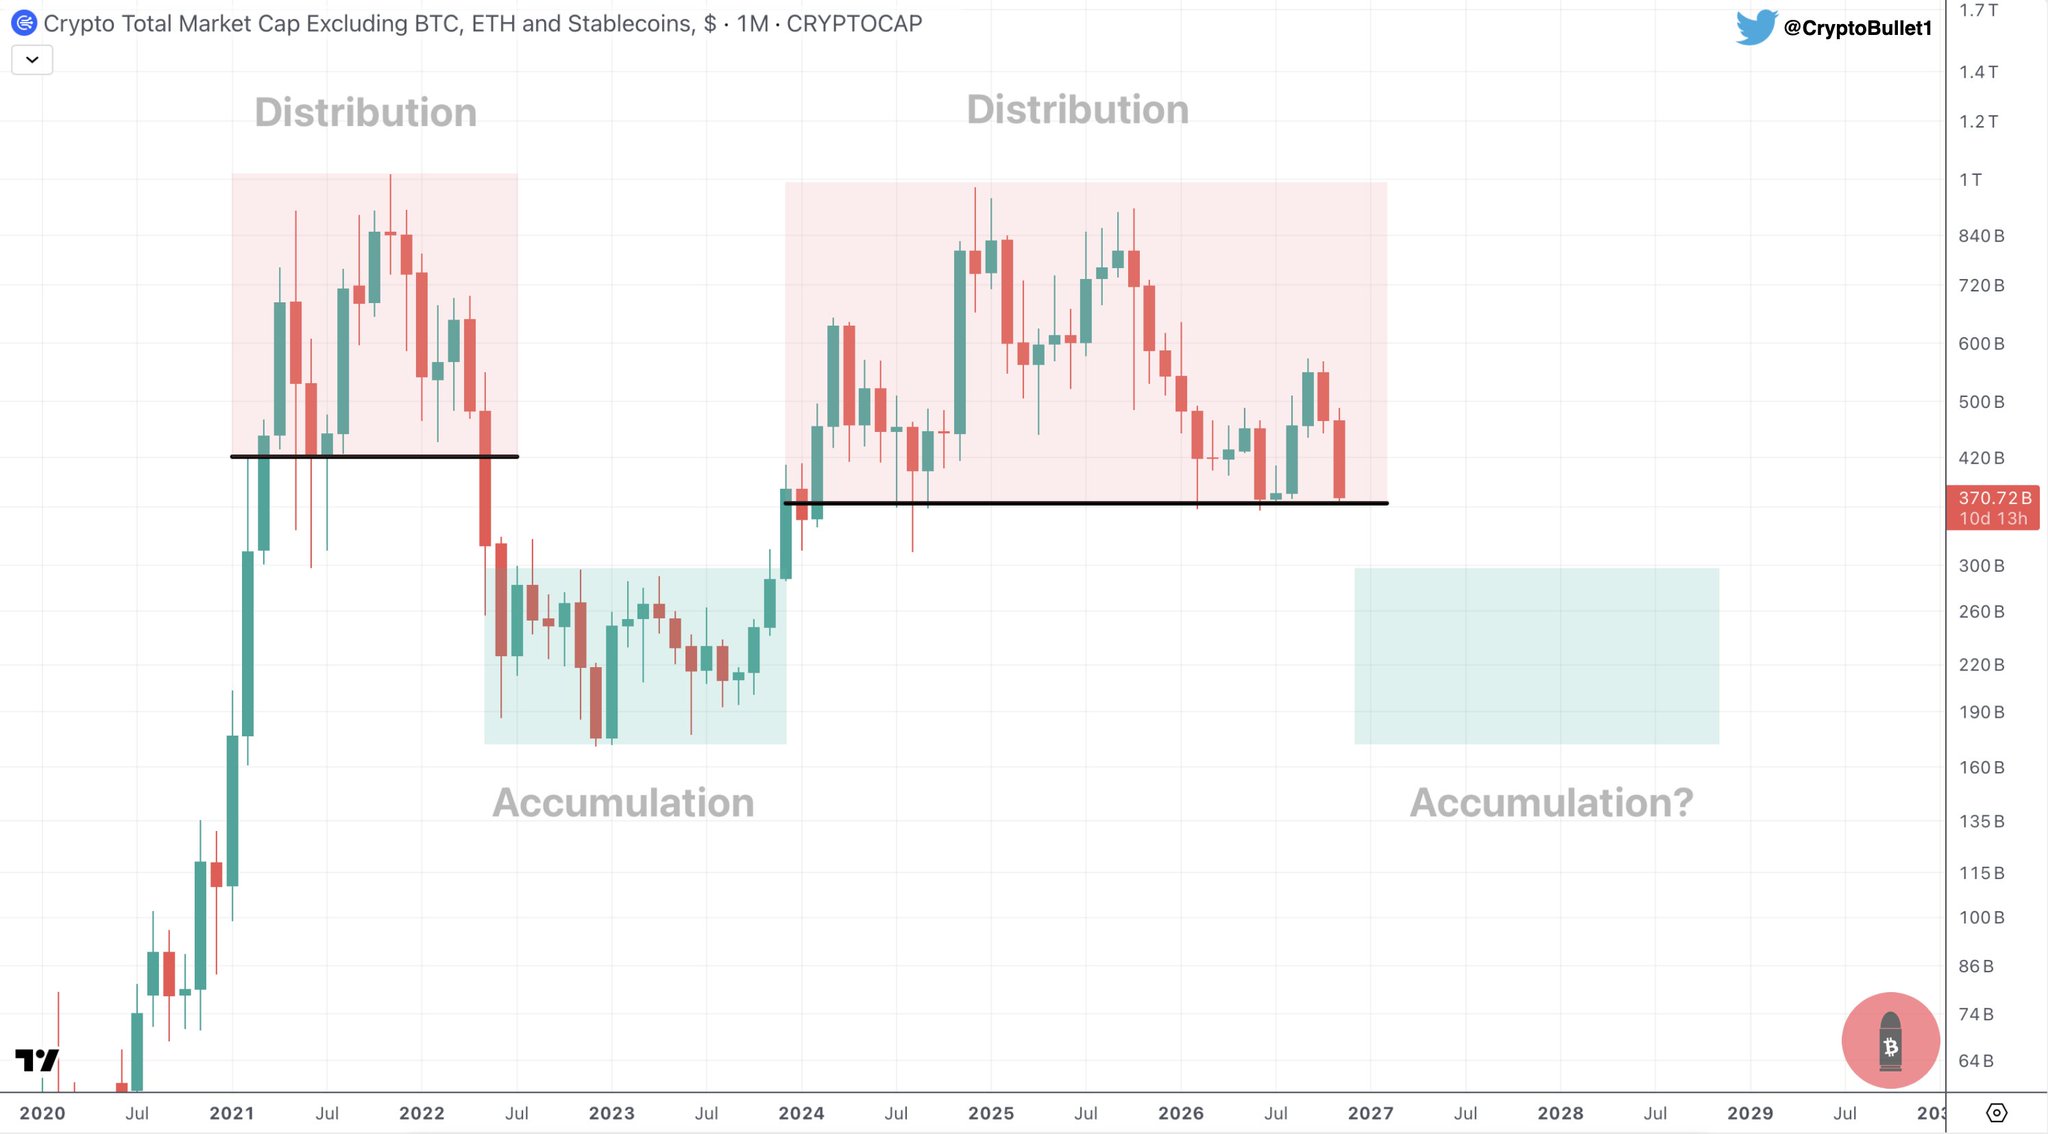
The price axis on the chart spans from 64B at the lower boundary up through 1.7T at the peak, with the current reading of 370.72B sitting in the middle-to-lower range — well off the cycle highs and now beneath the support level that was supposed to define the floor of the second distribution phase. The implication the analyst is drawing is direct: if the pattern repeats with the fidelity it has shown so far, TOTAL3 is not at the bottom. It is in the early stages of a deep accumulation drawdown — the kind the 2022 bear market produced.
Why This Cycle Comparison Matters
The two cycles on this chart are presented as structurally symmetrical — same phase sequence, same support/distribution architecture. That symmetry is not decorative. It is the analytical thesis. If the second cycle is tracking the first, the Distribution phase ending in a breakdown below support is not the conclusion — it is the transition point into a prolonged Accumulation phase, which in the prior cycle meant sustained price compression well below the broken support level before recovery began.
This is consistent with broader altcoin weakness documented across the market. Altcoin sectors have been bleeding against both Bitcoin and in dollar terms, and the pattern of altcoins following Bitcoin into extended losses has been a defining feature of this cycle. Meanwhile, broader market structure signals — including the TOTAL2 breakdown that preceded Coinbase’s correction — have been consistent with the deterioration now visible in TOTAL3.
What the Breakdown Means in Practice
A monthly close below a defined horizontal support level on TOTAL3 carries a specific structural implication: the market has rejected the floor. Buyers who defended that level have been absorbed or have exited. The burden of proof now shifts to the bulls — a recovery above that broken support, confirmed on a monthly close basis, would be required to invalidate the bearish reading. Until that happens, the chart’s default trajectory, as the analyst’s cycle overlay suggests, points toward deeper accumulation territory.
The analyst did not attach specific numeric targets below 370.72B. What the chart does show is the architecture of the prior cycle’s accumulation floor — and that floor was significantly lower than the distribution-phase support level that broke. The gap between the two, in the first cycle, was substantial. If the second cycle compresses to a similar degree, the downside implied by the pattern is material.
Traders watching Bitcoin’s buy/sell pressure dynamics will note that altcoin weakness of this magnitude rarely reverses independently — a structural TOTAL3 recovery would almost certainly require Bitcoin demand to stabilize and capital rotation to resume. Neither is confirmed at time of writing.
The Single Level That Changes the Picture
The horizontal support line now acting as resistance — the same line TOTAL3 has broken below — is the level to watch. A monthly close back above it would signal a false breakdown and would materially alter the bearish cycle-repetition thesis. Without that reclaim, the chart structure as drawn supports continued deterioration toward the projected accumulation zone. At 370.72B, TOTAL3 is below that line. The breakdown is the current structural fact.
The altcoin market’s monthly chart has delivered one of the clearest bearish structural signals of this cycle. Until TOTAL3 reclaims its broken monthly support with a confirmed close above that level, the cycle-repetition pattern points toward deeper drawdown — and the chart, by the analyst’s own read, looks absolutely horrendous.
Source: x.comFrequently Asked Questions
What is TOTAL3 and why does a breakdown on its monthly chart matter?
What would it take to invalidate the bearish TOTAL3 structure?
How does the current TOTAL3 breakdown compare to the 2021–2023 cycle?
Does the TOTAL3 breakdown affect all altcoins equally?
Source: Cryptobullet1 · Published by CoinsProbe Markets Desk
The opinions and market insights shared on CoinsProbe represent the views of individual authors based on prevailing market conditions at the time of publication. Cryptocurrency investments carry significant risk and volatility. Readers are encouraged to conduct their own research and seek professional financial advice before making investment decisions. CoinsProbe and its contributors do not accept responsibility for financial losses or decisions made based on published content.
CoinsProbe may publish sponsored articles, affiliate links, or promotional collaborations. All sponsored material is clearly labeled to maintain transparency with our audience. Our editorial decisions remain fully independent, and advertising partnerships do not influence reviews, rankings, or published opinions.
Since 2023, CoinsProbe has delivered reliable insights on cryptocurrency, blockchain, and digital assets. Our content is created by experienced researchers and analysts who follow strict editorial standards focused on accuracy, transparency, and credibility. Every article is carefully reviewed and verified using trusted sources and current market data. We provide unbiased analysis and timely updates covering everything from emerging crypto projects to major industry developments.