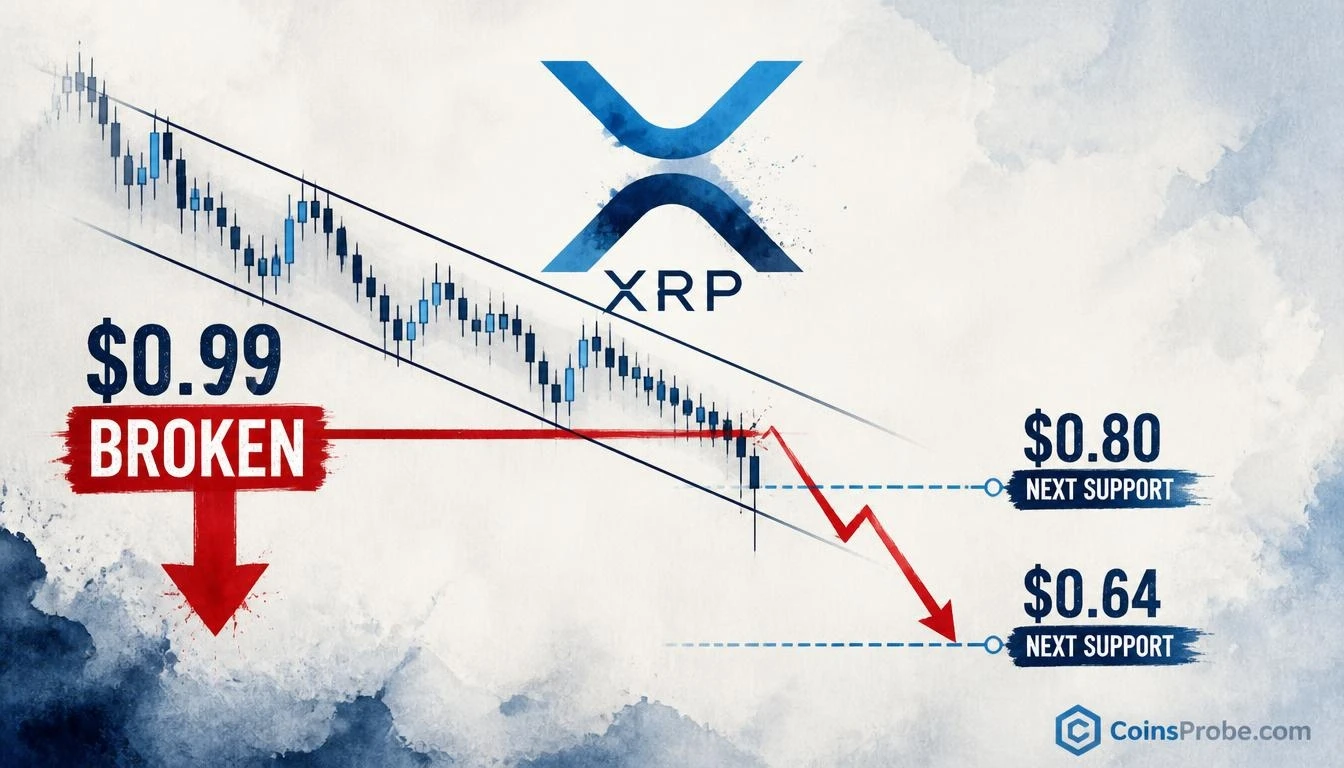
- XRP trades at $0.9517, down 3.47% in 24 hours, after breaking below the $0.99 channel support
- Analyst flags $0.80 as first major support (−16%) and $0.64 as deeper target (−33%) post-breakdown
- Bearish outlook only weakens on a sustained reclaim of $0.99 — now acting as resistance
- XRP spot ETFs saw 5 consecutive outflow days totaling −$7.2M per SoSoValue data
XRP is trading at $0.9517, down 3.47% in the past 24 hours and sitting on a market cap of $60.45 billion — and the technical picture just deteriorated meaningfully. The asset has broken below $0.99, the lower boundary of a defined price channel, a development that one analyst identifies as a signal that a deeper correction may now be underway.
An analyst at @alicharts flagged the breakdown on November 20, 2026, referencing a channel structure with an upper boundary at $1.55 and a lower boundary at $0.99. The post states directly: “XRP has broken below the $0.99 lower boundary of the channel, suggesting that a deeper correction may now be underway.” This follows a prior note from November 13 (post ID: 2121109733511745792) in which the same analyst warned that if $0.99 failed to hold after XRP reversed from $1.55, a correction to $0.80 would become the base case. That condition has now been met.
The Channel Structure — What Just Broke
XRP had been trading inside a defined channel between $0.99 and $1.55 for a sustained period. The $1.55 level acted as the upper resistance boundary, where XRP reversed. The $0.99 level was the lower support boundary — the floor of the structure. That floor has now been decisively broken. When a price channel breaks its lower boundary, the technical implication is straightforward: the range that was containing price is no longer valid, and the asset is free to seek lower equilibrium levels. The analyst had flagged $0.99 as the critical line a week before the breakdown occurred, giving traders a clear invalidation level in advance.
At the current price of $0.9517, XRP is already trading below the broken $0.99 level. The question now is not whether the breakdown occurred — it has — but how far the correction extends. This is part of a broader deterioration in altcoin structure, as covered in the TOTAL3 monthly chart breakdown analysis, where the aggregate altcoin market cap also lost key support.
Next Major Support Levels — $0.80 and $0.64
The analyst identifies two levels as the primary downside targets following the $0.99 breach:
- $0.80 — the first major support level and the nearest structural zone below the broken channel
- $0.64 — the second major support, representing a deeper correction scenario if $0.80 fails to hold
From the current price of $0.9517, the move to $0.80 represents a decline of approximately 16%. A further extension to $0.64 would represent a 33% decline from current levels. Neither level is a speculative target — they are the analyst’s stated structural support zones identified in the breakdown post.
The scale of this potential correction is consistent with the broader environment described across the ongoing altcoin sector bleed, where assets across multiple categories have been unable to sustain bounces against deteriorating macro and on-chain conditions.
The One Condition That Invalidates the Bearish Case
The analyst is explicit about what would weaken the bearish outlook: a reclaim of $0.99. That is the broken support level that now becomes resistance. Until XRP closes back above $0.99 on a sustained basis, the channel breakdown remains in force and the downside targets at $0.80 and $0.64 remain the operative framework.
This reclaim condition matters because broken support levels frequently become resistance — sellers who were previously buying at $0.99 to defend the floor are now trapped and will likely use any bounce toward that level to exit. That structural dynamic makes a clean reclaim of $0.99 more difficult than a first glance at the chart might suggest.
ETF Context — Five Consecutive Outflow Days
The technical breakdown is occurring against a backdrop of weakening institutional demand. XRP spot ETF data via SoSoValue shows the past five trading days registered net outflows totaling $7.2 million, with zero inflow days across that stretch. Total ETF net assets stand at $1.08 billion against a cumulative net inflow since launch of $1.78 billion — suggesting a meaningful portion of institutional capital that entered has since rotated out. Daily trading volume on XRP ETFs stands at $17.8 million, a figure that reflects declining engagement at current price levels.
Macro data releases this week add another layer of uncertainty: Core PCE Price Index and GDP (QoQ) are due November 24, with ISM Manufacturing PMI and JOLTs Job Openings scheduled for November 30. Risk assets, including crypto, have historically been sensitive to Core PCE surprises — a hotter-than-expected reading could further suppress demand for speculative assets like XRP in the near term. This macro backdrop is an additional headwind alongside the channel breakdown discussed here. For broader context on current sell-side pressure dynamics, see the Bitcoin buy/sell pressure delta analysis — the same forces applying downward pressure on BTC are weighing on XRP.
The Setup in One View
| Level | Role | Distance from Current Price |
|---|---|---|
| $1.55 | Upper channel boundary (prior resistance) | +63% |
| $0.99 | Broken lower channel boundary (now resistance) | +4% |
| $0.9517 | Current price (at time of writing) | — |
| $0.80 | First major support (analyst target) | −16% |
| $0.64 | Second major support (analyst target) | −33% |
Key levels identified by @alicharts (X) | CoinsProbe
The channel breakdown is confirmed. The $0.99 level — once support, now resistance — is the single most important price to watch. As long as XRP trades below it, the analyst’s framework points toward $0.80 as the next meaningful resting point, with $0.64 as the deeper scenario if that level cracks. A sustained close back above $0.99 is the only technical development that changes this picture.
Frequently Asked Questions
What does it mean that XRP broke below $0.99?
How far could XRP fall from current levels after the $0.99 breakdown?
What would signal that the XRP bearish outlook is over?
Are XRP ETF flows supporting or weighing on the price?
Source: Ali Charts · Published by CoinsProbe Markets Desk
The opinions and market insights shared on CoinsProbe represent the views of individual authors based on prevailing market conditions at the time of publication. Cryptocurrency investments carry significant risk and volatility. Readers are encouraged to conduct their own research and seek professional financial advice before making investment decisions. CoinsProbe and its contributors do not accept responsibility for financial losses or decisions made based on published content.
CoinsProbe may publish sponsored articles, affiliate links, or promotional collaborations. All sponsored material is clearly labeled to maintain transparency with our audience. Our editorial decisions remain fully independent, and advertising partnerships do not influence reviews, rankings, or published opinions.
Since 2023, CoinsProbe has delivered reliable insights on cryptocurrency, blockchain, and digital assets. Our content is created by experienced researchers and analysts who follow strict editorial standards focused on accuracy, transparency, and credibility. Every article is carefully reviewed and verified using trusted sources and current market data. We provide unbiased analysis and timely updates covering everything from emerging crypto projects to major industry developments.