- SOL is trading at $107.64 (-1.15% 24h), reaching the upper boundary of @CryptoBullet1's defined daily target zone
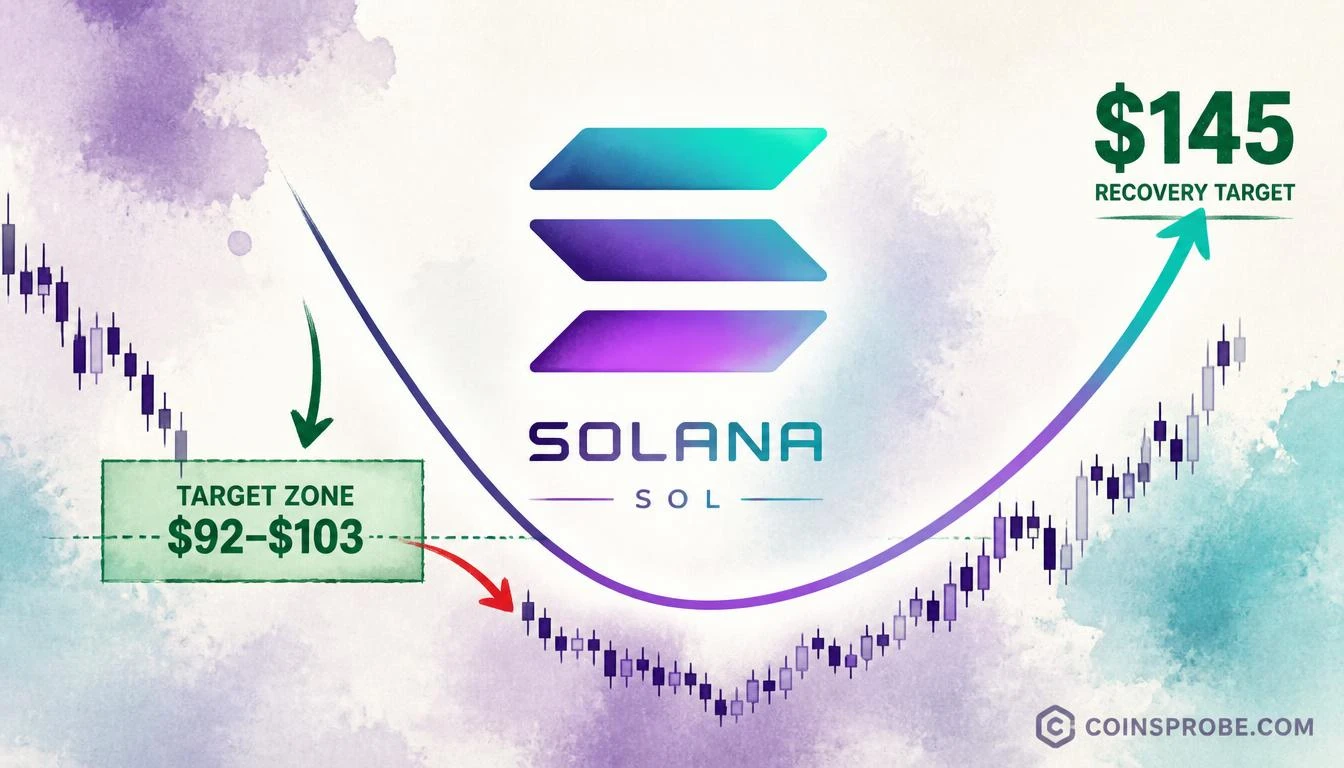
- Analyst expects SOL to pull back deep into the $92–$103 target zone over the coming weeks before resuming upside
- Bearish divergence confirmed on the daily oscillator, consistent with near-term exhaustion at current levels
- Chart's blue arc projects recovery toward $145 following the expected consolidation inside the zone
Solana is trading at $107.64 — down 1.15% over the past 24 hours and carrying a market cap of $63.45 billion — at exactly the moment one analyst says the setup requires patience, not aggression. SOL has reached the upper boundary of a defined technical target zone on the daily chart, and the trader watching it most closely expects price to pull deeper into that zone before any meaningful resumption of upside.
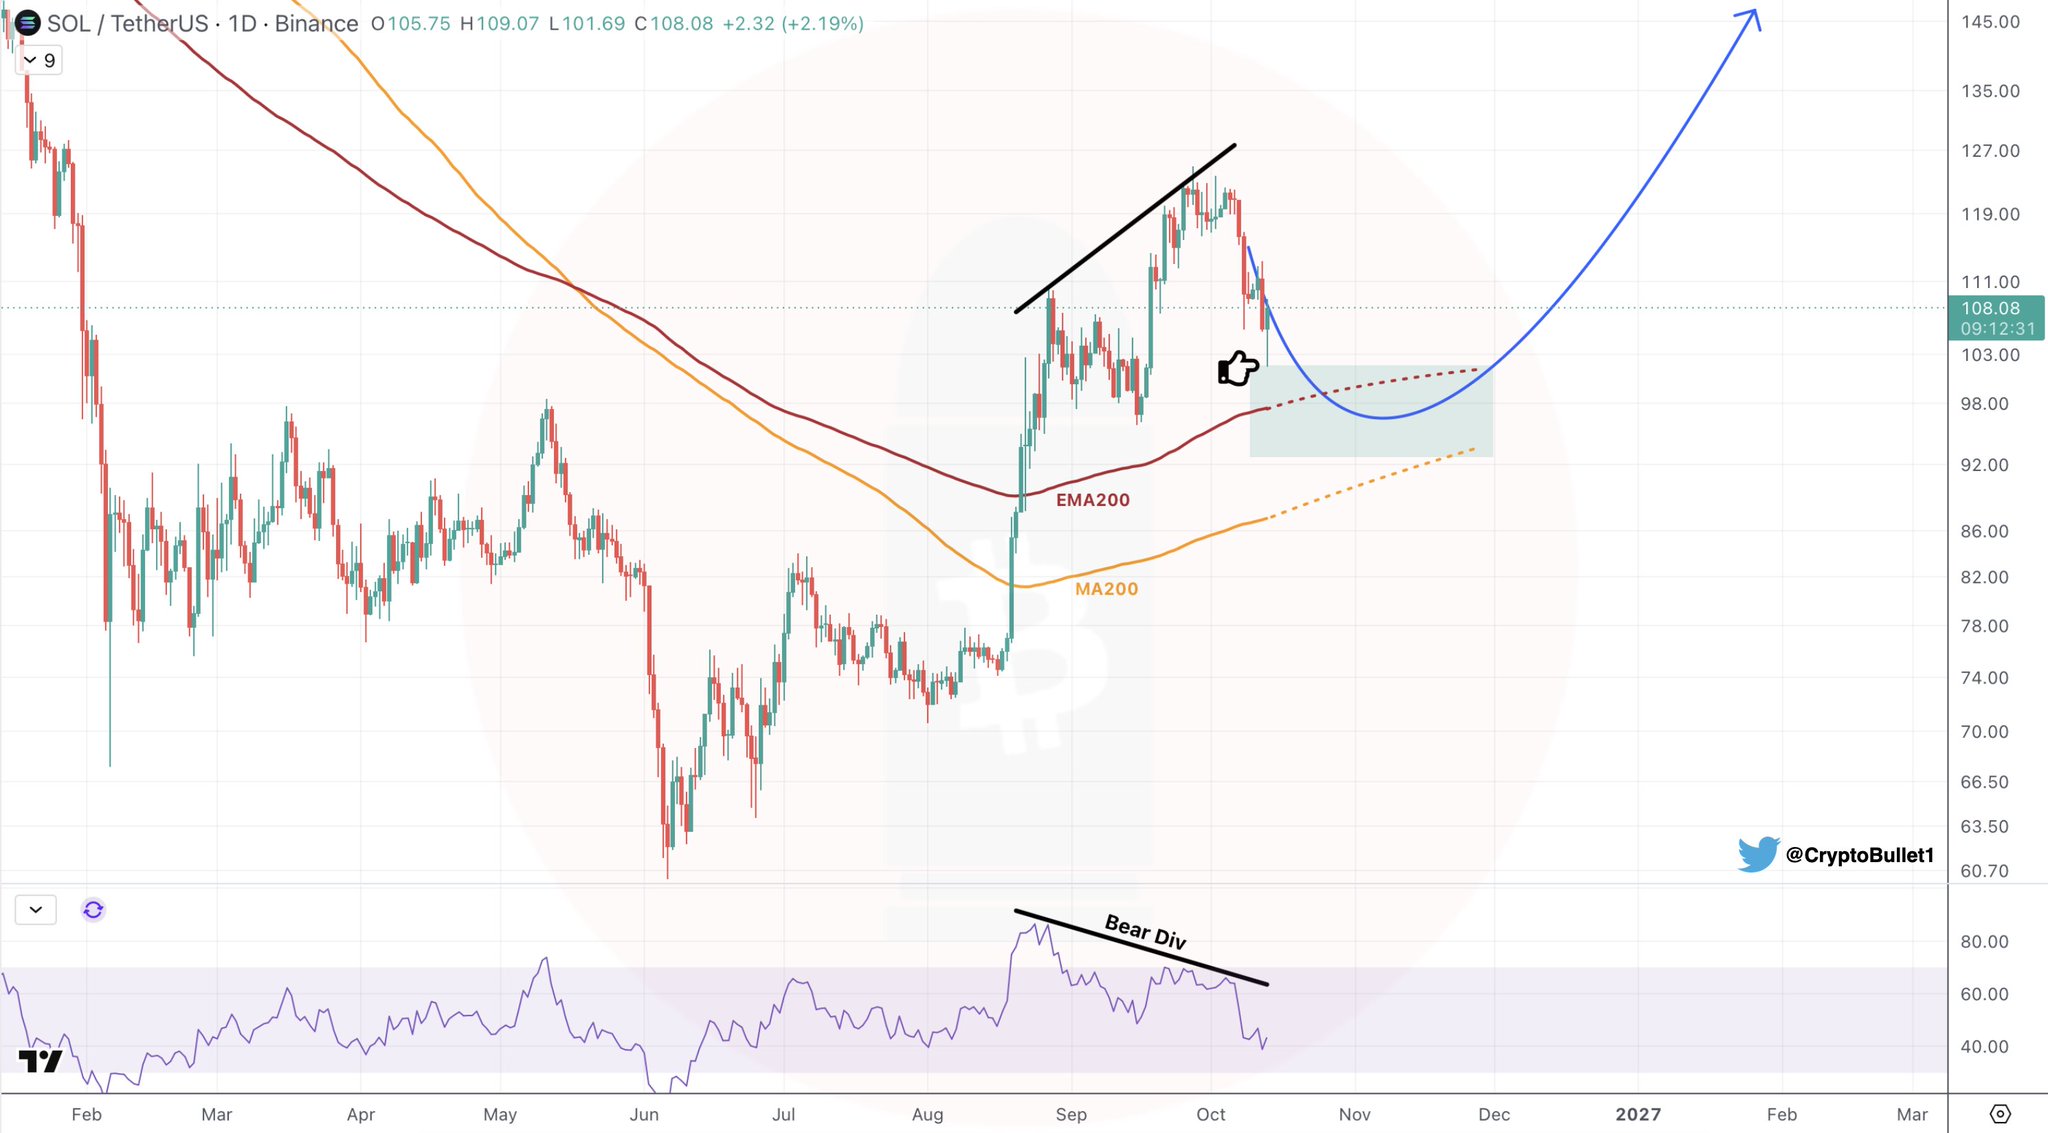
That call comes from @CryptoBullet1, who posted a 1D SOL/USDT update on October 13, 2026, stating plainly: “Reached the upper boundary of my target zone 👌 Expecting $SOL to go deep into that zone in the coming weeks.” The chart he shared on Binance’s daily feed shows the context clearly: a descending resistance trendline capping recent highs, a curved blue arc tracing SOL’s U-shaped recovery path since the lows, and a shaded green rectangle marking the target zone where he now expects price to consolidate.
The Target Zone — What the Chart Shows
The shaded green rectangle on @CryptoBullet1’s daily chart sits roughly in the ~$92–$103 range — a zone that has acted as a prior range area and aligns with levels the chart’s right-axis price ticks (labeled at 92, 98, and 103) confirm as meaningful. The current session printed a high of $109.07 and a low of $101.69 before settling near $108, placing SOL precisely at the upper edge of where the analyst anticipated price would arrive.
The blue arc overlaid on the price structure projects a U-shaped trajectory: a deeper retracement into the zone — potentially revisiting the $92–$103 band — followed by a recovery arc toward the $145 level marked on the chart’s right axis. That $145 figure is a chart annotation representing the analyst’s projected recovery target following the expected pullback, not an immediate price call. The blue arc is a trajectory model, not a guarantee of the path.
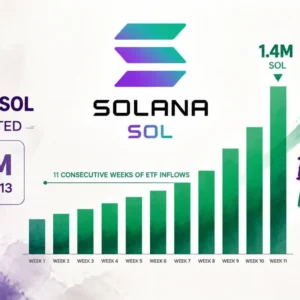
One additional warning flag appears on the oscillator panel beneath the price chart: a bearish divergence (labeled “Bear Div”) is visible, with price making higher highs while the oscillator fails to confirm — a classic signal of waning upside momentum. This is consistent with @CryptoBullet1’s expectation that the current level marks exhaustion rather than continuation. This technical backdrop also aligns with broader institutional interest in Solana: Solana ETF inflows have now posted 11 straight weeks of positive flows, suggesting accumulation interest may emerge on deeper dips.
The Descending Trendline — Still the Structural Ceiling
The black diagonal resistance line on the chart descends from prior swing highs and continues to cap SOL’s recent recovery attempts. Each rally into this trendline has been met with selling pressure, and the current session’s high of $109.07 appears to have tagged this resistance zone once again. Until SOL posts a sustained daily close above this descending line — a level that is dynamic and drifting lower with each passing session — the structural bias on the daily chart remains constrained to the downside short-term.
The EMA200 and MA200 indicators are visible on the chart as additional reference overlays. Their exact readings are not labeled numerically by the analyst, and no specific claim about price relative to these moving averages is made in @CryptoBullet1’s post — so they are noted as chart context rather than analytical anchors for this call.
What “Going Deep Into the Zone” Actually Means
@CryptoBullet1’s language is deliberate: not “a brief dip” but going deep into the zone, and over a multi-week timeframe. That framing implies a consolidation phase rather than a sharp V-shaped rejection. The zone’s lower boundary near $92 represents the maximum depth of the expected pullback within his model. Whether SOL reaches that lower bound or finds support at the zone’s midpoint (~$97–$98) will determine how the blue arc recovery trajectory resolves.
For context on the broader pattern structure, a prior CoinsProbe analysis noted that SOL had been coiling in a bull flag formation at $101 with eyes on $130 — the current move above $100 and into the $107–$109 range represents a partial fulfillment of that pattern’s initial target, which now sets up the retest scenario @CryptoBullet1 describes.
Bullish and Bearish Scenarios
Bullish Scenario — Zone Holds and Arc Resumes
If SOL pulls back into the $92–$103 target zone and finds sustained buying interest — particularly near the $97–$103 band — the blue arc trajectory projects a recovery toward the chart-annotated $145 level. A daily close back above the descending trendline from within the zone would be the confirmation signal that the U-shaped path is intact.
Bearish Scenario — Zone Fails to Hold
A sustained daily close below the lower boundary of the green zone (~$92) would invalidate the arc model as drawn and open downside toward the $86 and $82 levels visible on the chart’s right-axis gridlines. @CryptoBullet1 does not state a specific invalidation level in his post — the $92 lower bound is a visual reading from the shaded rectangle, not an analyst-stated floor.
The setup is not a trade entry signal — it is a positioning map. @CryptoBullet1 identifies where SOL is in its pattern (upper boundary of the zone), where it is likely to go next (deeper into the zone over weeks), and what the longer arc implies ($145 on the recovery). The bearish divergence on the oscillator adds weight to the near-term caution. Watch the $92–$103 zone for accumulation signals as the expected pullback develops.
Source: x.comFrequently Asked Questions
What is the exact target zone @CryptoBullet1 identified for SOL on the daily chart?
What does the bearish divergence on SOL’s daily chart mean?
How long does @CryptoBullet1 expect the SOL pullback to last?
What is the $145 level shown on the SOL chart?
Source: Cryptobullet1 · Published by CoinsProbe Markets Desk
The opinions and market insights shared on CoinsProbe represent the views of individual authors based on prevailing market conditions at the time of publication. Cryptocurrency investments carry significant risk and volatility. Readers are encouraged to conduct their own research and seek professional financial advice before making investment decisions. CoinsProbe and its contributors do not accept responsibility for financial losses or decisions made based on published content.
CoinsProbe may publish sponsored articles, affiliate links, or promotional collaborations. All sponsored material is clearly labeled to maintain transparency with our audience. Our editorial decisions remain fully independent, and advertising partnerships do not influence reviews, rankings, or published opinions.
Since 2023, CoinsProbe has delivered reliable insights on cryptocurrency, blockchain, and digital assets. Our content is created by experienced researchers and analysts who follow strict editorial standards focused on accuracy, transparency, and credibility. Every article is carefully reviewed and verified using trusted sources and current market data. We provide unbiased analysis and timely updates covering everything from emerging crypto projects to major industry developments.