
- Bitcoin is trading at $78,335 (+2.25% 24h) as the 2026 post-midterm 12-month window opens
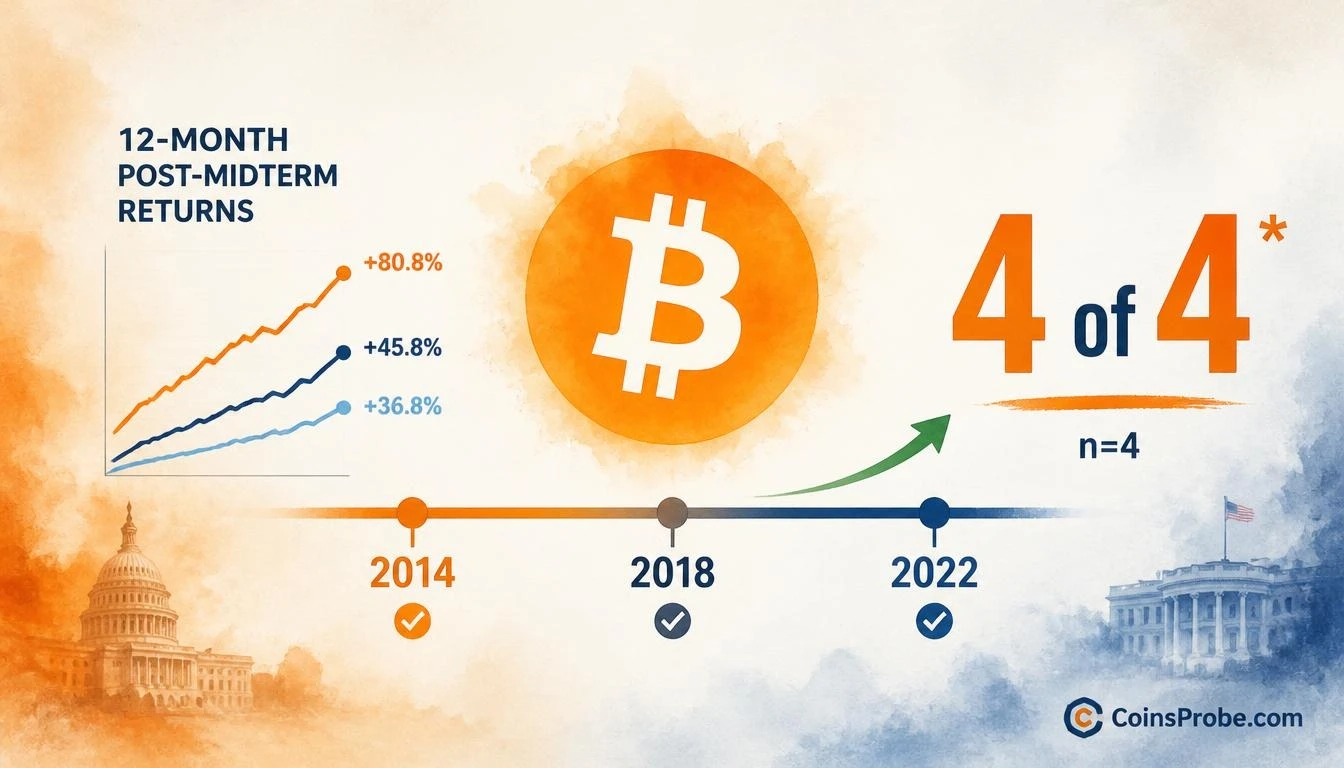
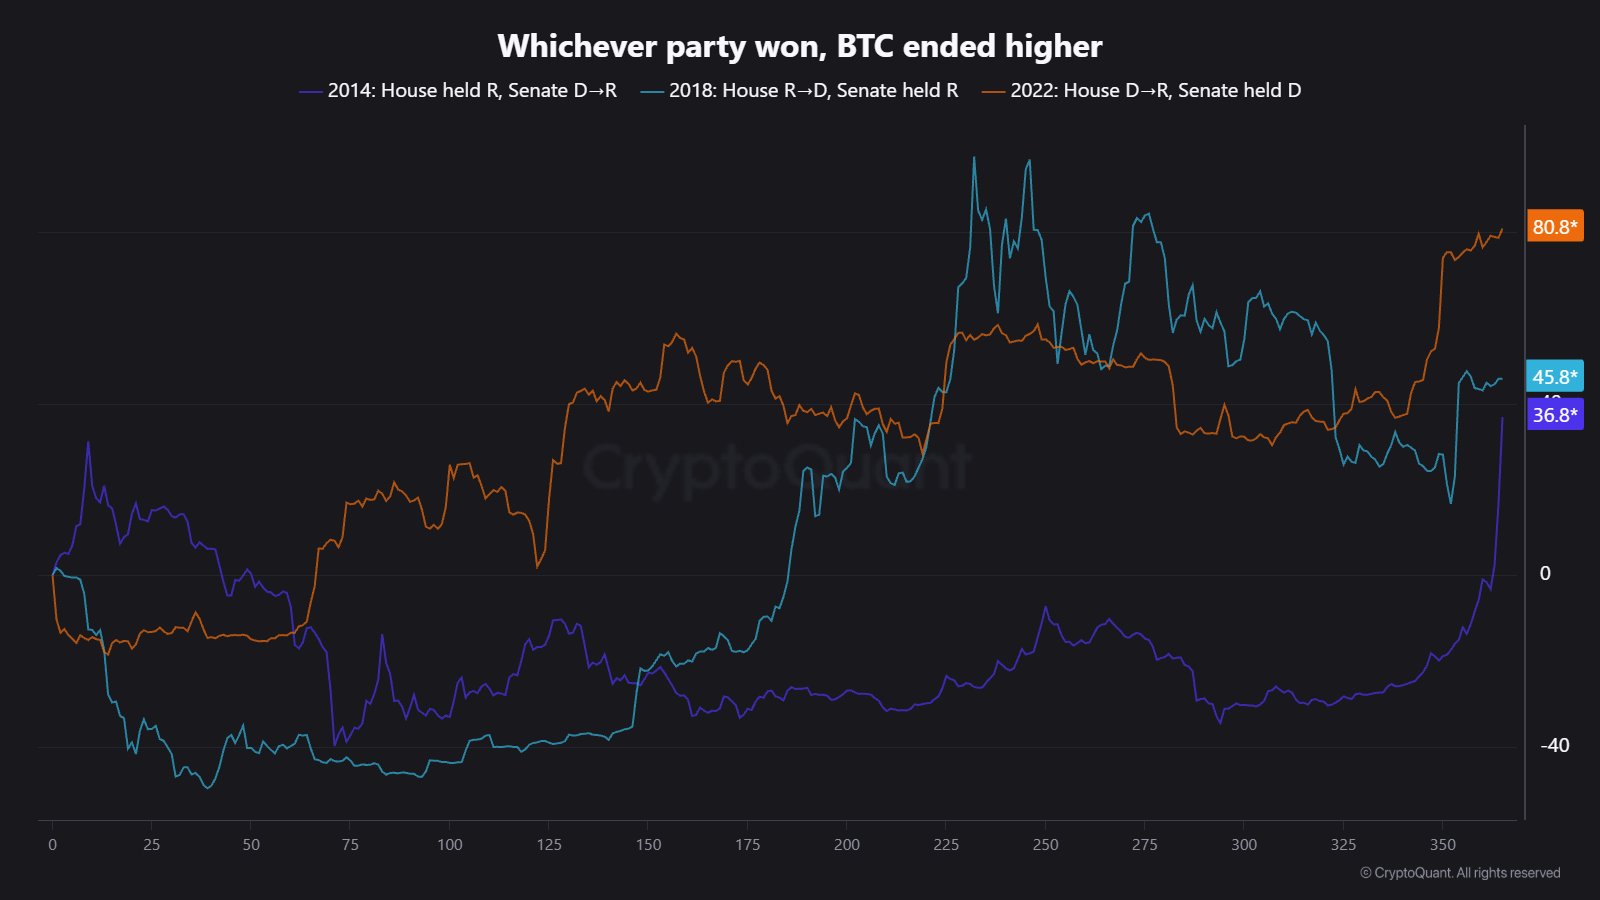
- CryptoQuant data: BTC gained +36.8% (2014), +45.8% (2018), +80.8% (2022) in 12 months after each midterm — 4 for 4 regardless of which party won
- CryptoQuant explicitly flags the limitation: n=4 means "4 of 4 can easily be luck" — no forward projection is statistically justified
- Spot Bitcoin ETFs logged $115.6M net outflow on Nov 3, while markets price 77.1% probability of a December FOMC rate hike
Bitcoin is trading at $78,335 — up 2.25% in the past 24 hours — with a market cap of $1.57 trillion. Beneath the daily price action, an on-chain analytics firm has surfaced a pattern that cuts across every midterm election cycle since 2014: Bitcoin finished higher 12 months later, every single time, regardless of which party gained or lost congressional control. But the firm is not framing it as a trading signal. It is framing it as a statistical curiosity with a critically small sample size.
CryptoQuant (@cryptoquant_com) published the analysis in a multi-part thread timed to the November 2026 midterm cycle. The firm’s conclusion was deliberately restrained: “Which party won didn’t matter. 4 of 4 can easily be luck.” That caveat matters as much as the data itself — and separates this from the typical election-cycle narrative that floods crypto media every two years.
The 12-Month Post-Midterm Record — 4 for 4
The data, measured as 12-month Bitcoin returns following each midterm election since 2014, shows the following:
| Midterm Year | Congressional Outcome | 12-Month BTC Return |
|---|---|---|
| 2014 | House held R, Senate D→R | +36.8% |
| 2018 | House R→D, Senate held R | +45.8% |
| 2022 | House D→R, Senate held D | +80.8% |
Source: CryptoQuant (@cryptoquant_com), data via post dated November 3, 2026
The median 12-month return across the three completed cycles is approximately +45.8%, with the range running from +36.8% (2014) to +80.8% (2022). Every election produced a different outcome for congressional control. Every 12-month window produced a positive Bitcoin return. The two facts are consistent — but CryptoQuant explicitly states that consistency does not establish causation.
Why the Sample Size Warning Is Not Optional Context — It Is the Point
CryptoQuant’s thread frames the 4-for-4 record with a methodological warning that most coverage will bury: n=4 is statistically insufficient to draw forward-looking conclusions. With only four completed midterm cycles in Bitcoin’s existence, a 100% hit rate carries a wide confidence interval. The firm stated directly: “BTC was higher a year later on most days, election or not. 4 of 4 can easily be luck.”
This is not analyst humility for appearances. It is the correct statistical framing. If you flip a coin four times and get four heads, the observed frequency is 100% — but the underlying probability remains 50%. The same logic applies here. The 4-for-4 record is real data. Its predictive value is unproven. Any article that presents this pattern as a reliable forward signal is overstating what the data supports.
What makes the pattern structurally interesting — not statistically proven — is a separate finding from the same thread: midterm elections consistently fall 17 to 25 months before Bitcoin’s halving cycle, and they have historically occurred after bear market lows. The post-midterm gains may be driven by cycle positioning, not by any electoral outcome. The timing overlap with halving cycles and post-bear recoveries is the more credible structural explanation, even if it too involves a limited sample.
The Short-Term Drawdowns That Came First
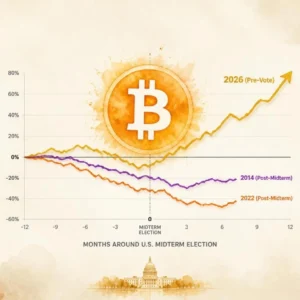
CryptoQuant’s thread also documented the post-election drawdowns that preceded each 12-month recovery — context that the headline gains alone omit. After the 2018 midterm, Bitcoin fell 49.7% over approximately six weeks before reversing. After the 2014 midterm, the drawdown reached 39.8% over roughly ten weeks. The 2022 cycle saw the shallowest immediate pullback at 18.5% over two weeks.
This matters for anyone treating the annual positive return as an entry timing signal. In two of three completed cycles, a buyer immediately after the midterm would have faced a drawdown exceeding 39% before the annual gain materialized. The 12-month return was positive in all three cases — but the path was not. For more context on how Bitcoin has tracked around the 2026 midterm specifically, see Bitcoin’s 2026 Midterm Anomaly — +20.4% Pre-Vote, 4/4 Post-Vote Gains and the broader signal record documented in Bitcoin Midterm Election Signal — 4-for-4 With +63% Median 12-Month Return.
What the ETF and Macro Backdrop Add to the Picture
Separate from the midterm cycle data, the current institutional and macro environment provides concrete near-term context. Spot Bitcoin ETFs recorded a net outflow of $115.6 million on November 3, 2026, extending a streak of three consecutive outflow days with $1.0 billion in net outflows over the past five trading days, per data via SoSoValue. IBIT led outflows at $95.0 million, while FBTC posted a modest $6.8 million inflow. Total ETF net assets stand at $99.16 billion against $56.47 billion in cumulative net inflows since launch — meaning the ETF complex remains deeply in the black despite the recent flow reversal.
On the corporate treasury side, Strategy holds 849,327 BTC as of November 2, 2026, after acquiring 811 BTC for $65.5 million in its latest purchase — part of 1,328 BTC acquired over the prior three weeks for $109.6 million, per SoSoValue. That pace of institutional accumulation is concurrent with the midterm cycle window, adding a structural demand layer that did not exist in the 2014 or 2018 reference cycles.
The macro picture carries a complication the historical data could not have anticipated. Markets are currently pricing a 77.1% probability of a rate hike at the December 9, 2026 FOMC meeting, with another hike scenario priced at 20.4% for January 2027, per SoSoValue data. A tightening cycle running concurrent with Bitcoin’s post-midterm window is a structural difference from prior cycles — one that the n=4 sample cannot account for. Nonfarm Payrolls on November 6, CPI on November 10, and PPI on November 13 will shape the rate trajectory in the weeks immediately ahead.
What the Data Says — and Explicitly Does Not Say
The pattern CryptoQuant has identified is straightforward: in every midterm election year since Bitcoin’s first midterm (2014), BTC has closed higher 12 months after the vote. The firm documents a clear correlation between the midterm calendar, the halving cycle positioning, and post-bear market timing. What it does not document — and explicitly cautions against concluding — is that political outcomes drive this result, or that a fifth instance is statistically guaranteed.
The 4-for-4 record sits alongside a present-tense setup that is structurally different from prior cycles: a live rate-hiking probability, spot ETF outflows running into the cycle window, and an institutional accumulation base that did not exist in earlier iterations. Whether those differences dampen, amplify, or have no effect on the annual return pattern is precisely what a sample of four cannot answer.
At $78,335, Bitcoin is in the same post-midterm window that has produced between +36.8% and +80.8% over 12 months in prior cycles — but the near-term data to watch is not electoral. It is the December FOMC decision and the November CPI print on November 10. Those two data points will determine whether the macro environment supports or complicates the cycle pattern. Watch $78,000 as the immediate support level — it is the zone Bitcoin is defending as the post-midterm window opens.
Source: x.comFrequently Asked Questions
Does it matter which party wins the midterm election for Bitcoin’s price?
What was the worst short-term drawdown Bitcoin experienced after a midterm before recovering?
Why does CryptoQuant say ‘4 of 4 can easily be luck’?
How does the current macro environment differ from prior post-midterm cycles?
Source: CryptoQuant · Published by CoinsProbe Markets Desk
The opinions and market insights shared on CoinsProbe represent the views of individual authors based on prevailing market conditions at the time of publication. Cryptocurrency investments carry significant risk and volatility. Readers are encouraged to conduct their own research and seek professional financial advice before making investment decisions. CoinsProbe and its contributors do not accept responsibility for financial losses or decisions made based on published content.
CoinsProbe may publish sponsored articles, affiliate links, or promotional collaborations. All sponsored material is clearly labeled to maintain transparency with our audience. Our editorial decisions remain fully independent, and advertising partnerships do not influence reviews, rankings, or published opinions.
Since 2023, CoinsProbe has delivered reliable insights on cryptocurrency, blockchain, and digital assets. Our content is created by experienced researchers and analysts who follow strict editorial standards focused on accuracy, transparency, and credibility. Every article is carefully reviewed and verified using trusted sources and current market data. We provide unbiased analysis and timely updates covering everything from emerging crypto projects to major industry developments.