
- SOL trading at $99.10 (–5.01% 24h), hitting @CryptoBullet1's pre-marked buy-the-dip target zone from Oct 7
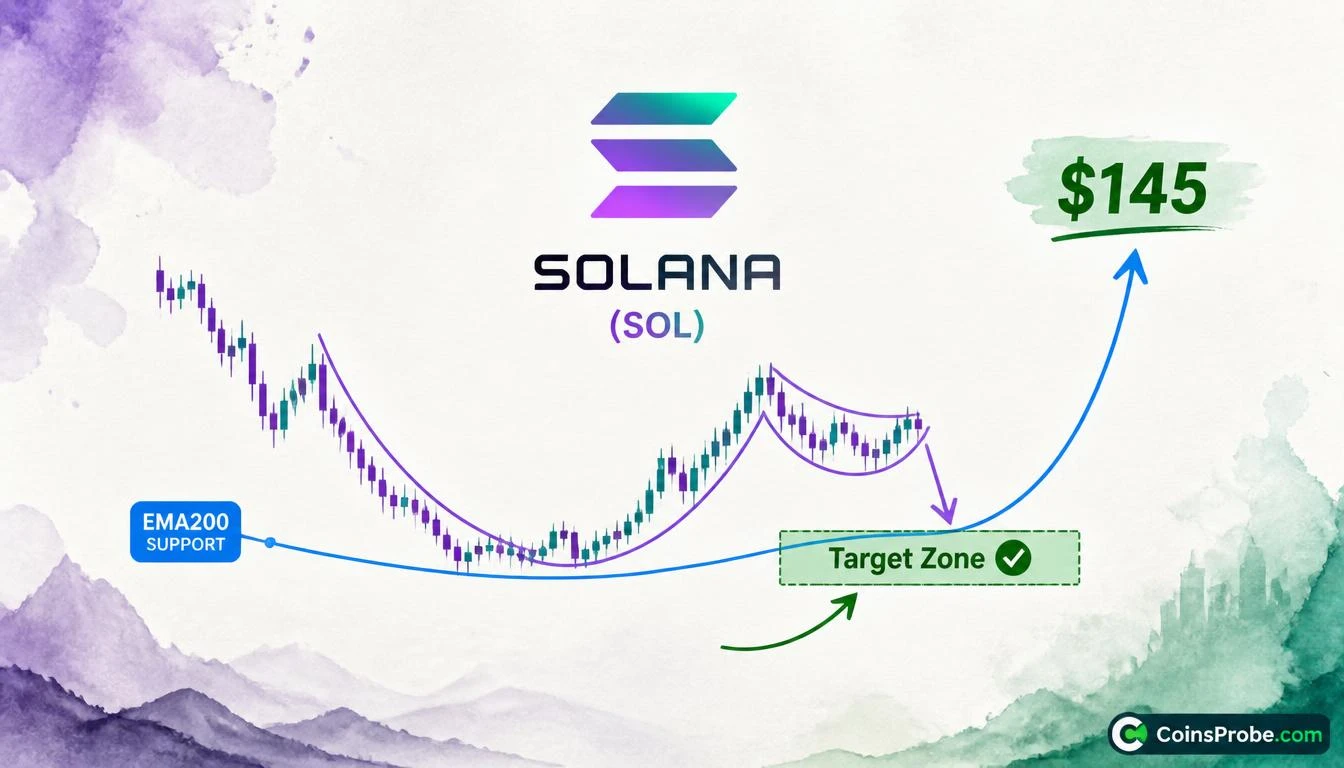
- Cup-and-handle forming on 1D chart with price at EMA200 — analyst's blue arrow projects recovery to ~$145 (+46%)
- Solana network generating $10.55M in 24h fees and $80.33M in 7d fees despite price pullback per DeFiLlama
- SOL spot ETFs saw -$17.3M net outflows over past 4 trading days per SoSoValue — Core PCE on Oct 28 is the macro trigger
Solana is trading at approximately $99.10 — down 5.01% in the past 24 hours — and sitting on a level that analyst @CryptoBullet1 flagged three weeks ago as the exact zone to buy the dip. The call has landed. SOL is now at the target zone with a checkmark.
On October 7, 2026, @CryptoBullet1 posted a 1D SOL chart titled “The dip you want to buy,” identifying a specific support zone as the optimal re-entry area. On October 24, with SOL trading near $98.86 on a daily close, he returned with a single update: “$SOL reached my Target Zone ✅” — no revision, no hedge, no new levels added. The call was complete.
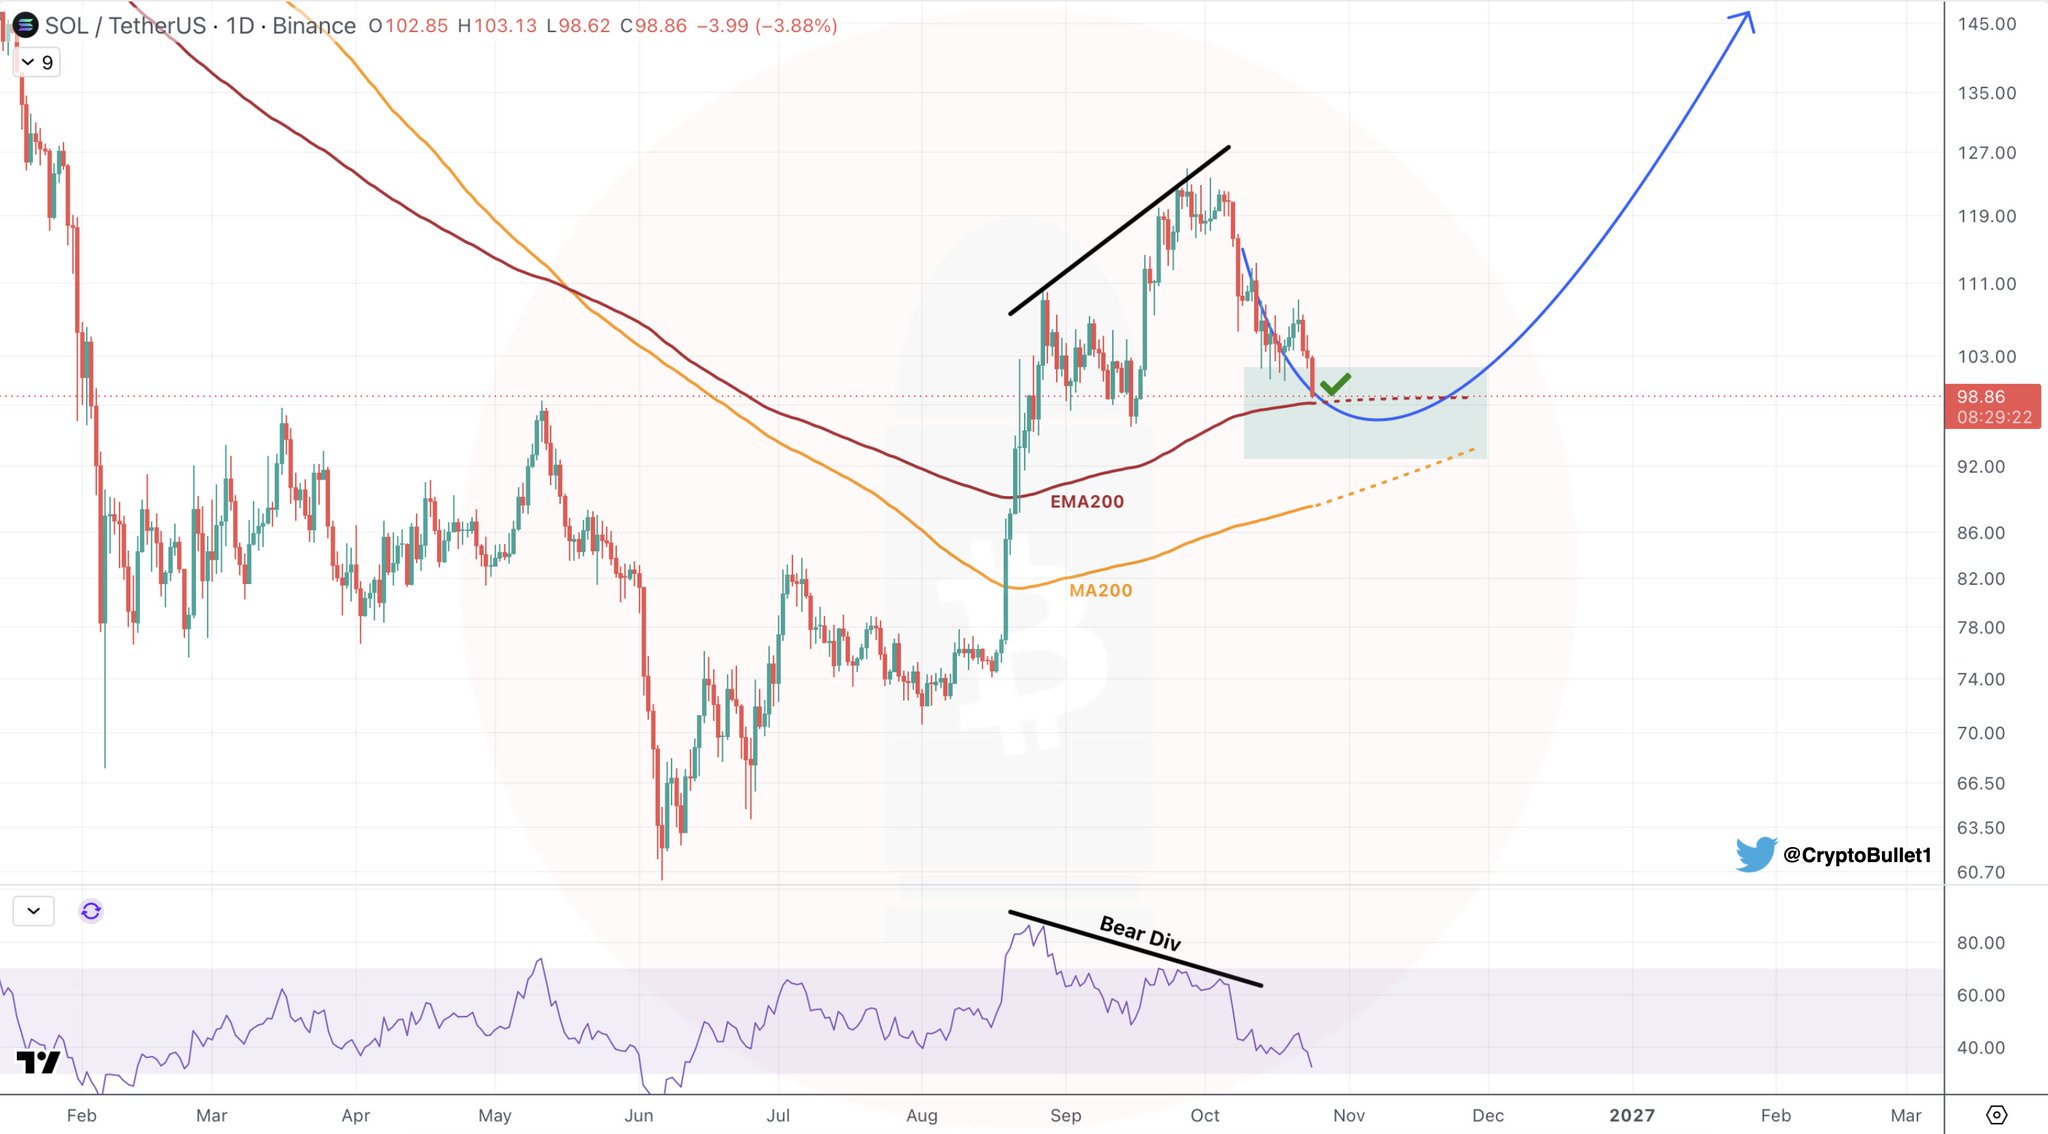
What the Chart Shows — Cup-and-Handle at EMA200 Support
The 1D Binance SOL/USDT chart shared by @CryptoBullet1 reveals a cup-and-handle structure still forming on the daily timeframe. The prior rally was capped by a descending black resistance trendline, and a bearish divergence printed in the oscillator panel ahead of the current pullback — a textbook setup that exhausted the rally and delivered price directly into the analyst’s pre-marked target zone. The green-shaded support box near $98–$103 carries a green checkmark, confirming the zone has been reached. A blue curved arrow projects a recovery toward approximately $145 as the pattern’s completion target.
Critically, SOL is now sitting at the EMA200 — a dynamic support level that has historically acted as a major structural floor during bull-market pullbacks. Price remains below the descending black resistance trendline overhead, meaning the pattern is still forming and a directional break has not yet occurred. The cup-and-handle requires a sustained reclaim of that trendline to confirm the bullish case. The analyst’s arrow points to $145 as the measured target if the handle resolves to the upside.
On-Chain Fundamentals Remain Intact
The price dip stands against a network that continues to generate real economic activity. Solana’s DeFiLlama data shows the chain running at $10.55M in 24-hour fees and $80.33M in 7-day fees, with total value locked at $5.76B. Daily DEX volume hit $2.00B in the past 24 hours, extending a 7-day total of $13.52B. These are not speculative metrics — they reflect sustained on-chain demand even as spot price pulls back. For context on the scale of SOL ecosystem sell pressure, Pump.fun has sold over $875.5M in SOL to Kraken cumulatively, yet the network’s fee generation has remained structurally elevated.
Spot ETF data from SoSoValue adds a layer of caution. As of October 22, SOL spot ETFs recorded a daily net outflow of $8.5M, with the past four trading days collectively seeing -$17.3M net (1 inflow day, 3 outflow days). Total ETF net assets stand at $1.61B against $1.54B in cumulative net inflows since launch. The ETF flow picture is not supportive short-term — institutional demand has paused at the same time price has dipped to the target zone.
Macro Backdrop — Key Catalysts This Week
The timing of SOL’s arrival at the target zone coincides with a heavy macro calendar. Core PCE Price Index (MoM and YoY) and GDP (QoQ) data drop on October 28 — the Federal Reserve’s preferred inflation gauge. Manufacturing PMI follows on November 1, and Services PMI on November 3. These releases will directly influence risk appetite across crypto markets. A softer-than-expected Core PCE reading would be the macro tailwind most likely to trigger the bounce @CryptoBullet1’s chart projects. A hotter print would test whether EMA200 support holds under macro pressure.
This is a setup CoinsProbe has been tracking across Solana’s structure. Earlier analysis flagged how SOL hitting the target zone’s upper boundary preceded a deeper pullback — the price action since has delivered exactly that deeper pullback, now arriving at the lower boundary of the zone. For the longer institutional picture, Solana ETF inflows ran for 11 straight weeks earlier this cycle — context that underscores how much the current outflow streak represents a reversal from prior institutional positioning.
Bullish Scenario — Reclaim of Descending Trendline
If SOL holds the target zone and EMA200, and reclaims the descending black resistance trendline overhead, the cup-and-handle pattern projects a measured move toward $145 — the level marked by @CryptoBullet1’s blue arrow. That would represent approximately a 46% advance from the current $99.10 level. Confirmation requires a daily close above the trendline, not an intraday touch.
Bearish Scenario — Loss of EMA200 and Target Zone
If SOL fails to hold the $98–$103 support zone and breaks below the EMA200 on a daily close, the cup-and-handle’s structural logic is invalidated. The bearish divergence that preceded this pullback would then represent a deeper distribution phase rather than a reset. The next meaningful support is not marked in @CryptoBullet1’s chart — the pattern’s invalidation would require reassessment from a fresh daily close below the zone.
The setup is clear: @CryptoBullet1 called the zone on October 7, and SOL arrived at it on October 24. The EMA200 is providing dynamic support at the same level. The cup-and-handle pattern remains forming, not confirmed. Whether the handle resolves to the upside toward $145 or breaks the zone to the downside will be determined by how SOL closes on the daily chart in the sessions ahead — and how Core PCE lands on October 28.
Watch $98 as the floor of the target zone — a daily close below that level would be the first structural warning that the buy-the-dip thesis is failing.
Frequently Asked Questions
What is the $145 target on SOL based on?
Why is SOL at the EMA200 significant?
What macro events could affect SOL’s bounce from this zone?
What does the bearish divergence on the SOL oscillator mean?
Source: Cryptobullet1 · Published by CoinsProbe Markets Desk
The opinions and market insights shared on CoinsProbe represent the views of individual authors based on prevailing market conditions at the time of publication. Cryptocurrency investments carry significant risk and volatility. Readers are encouraged to conduct their own research and seek professional financial advice before making investment decisions. CoinsProbe and its contributors do not accept responsibility for financial losses or decisions made based on published content.
CoinsProbe may publish sponsored articles, affiliate links, or promotional collaborations. All sponsored material is clearly labeled to maintain transparency with our audience. Our editorial decisions remain fully independent, and advertising partnerships do not influence reviews, rankings, or published opinions.
Since 2023, CoinsProbe has delivered reliable insights on cryptocurrency, blockchain, and digital assets. Our content is created by experienced researchers and analysts who follow strict editorial standards focused on accuracy, transparency, and credibility. Every article is carefully reviewed and verified using trusted sources and current market data. We provide unbiased analysis and timely updates covering everything from emerging crypto projects to major industry developments.