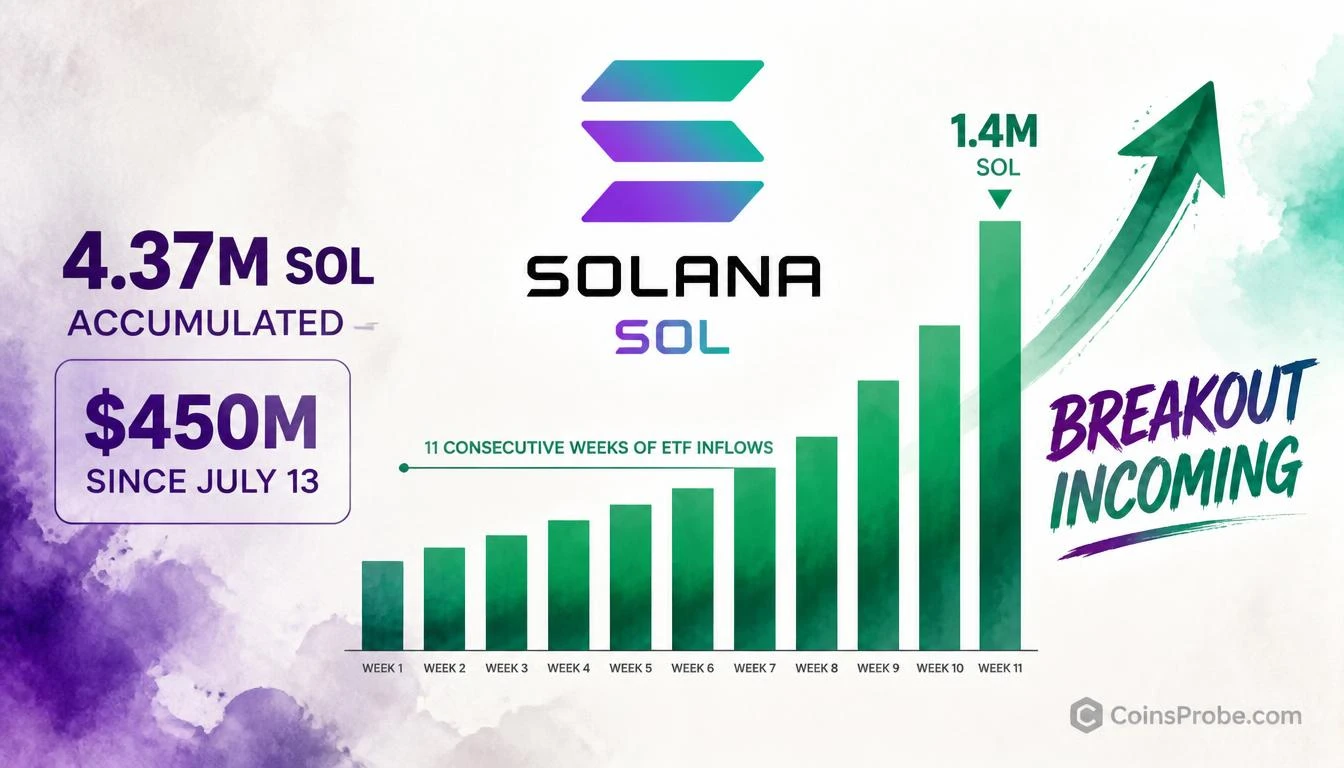

- US Spot Solana ETFs accumulated 4.37M SOL (~$450M) since July 13 — 11 consecutive weeks of net inflows
- September 21 recorded the largest single-week ETF inflow on the chart: ~1.35–1.4M SOL, an accelerating trend
- Analyst @alicharts flags 11 straight inflow weeks and is watching the next leg higher toward $150
- Watch for ETF weekly inflow continuation above 1M SOL — first negative week breaks the 11-streak thesis
Solana is building a case that institutional money is not rotating out — it is accelerating in. US Spot Solana ETFs have absorbed approximately 4.37 million SOL, worth around $450 million, since July 13, marking 11 consecutive weeks of net inflows with no interruption.
Crypto analyst Ali Martinez (@alicharts) flags the streak directly: “US Spot Solana ETFs have accumulated roughly 4.37 million $SOL, worth around $450 million, since July 13. That marks 11 consecutive weeks of net inflows. With institutional demand continuing to absorb Solana, I’m watching for the next leg higher toward $150.”
His framing is unambiguous: this is a supply absorption event, not a sentiment trade.
The ETF Flow Data — What 11 Consecutive Weeks Actually Means
ETF net inflows measure the difference between new capital entering a fund and capital exiting it each week. A single week of inflows can be noise. Three weeks is a trend. Eleven consecutive weeks with zero negative bars is a structural statement about institutional conviction.
The flow chart shared by @alicharts covers weekly ETF data from August 3 through September 21, 2026. What it shows is not a flat accumulation trend — it is an accelerating one. Inflows surged to approximately 1.2 million SOL in the week ending August 24, pulled back modestly into August 31, then hit their highest single-week reading of the entire series at the September 21 bar: an estimated 1.35 to 1.4 million SOL — the strongest institutional weekly buy on record for US Spot Solana ETFs.
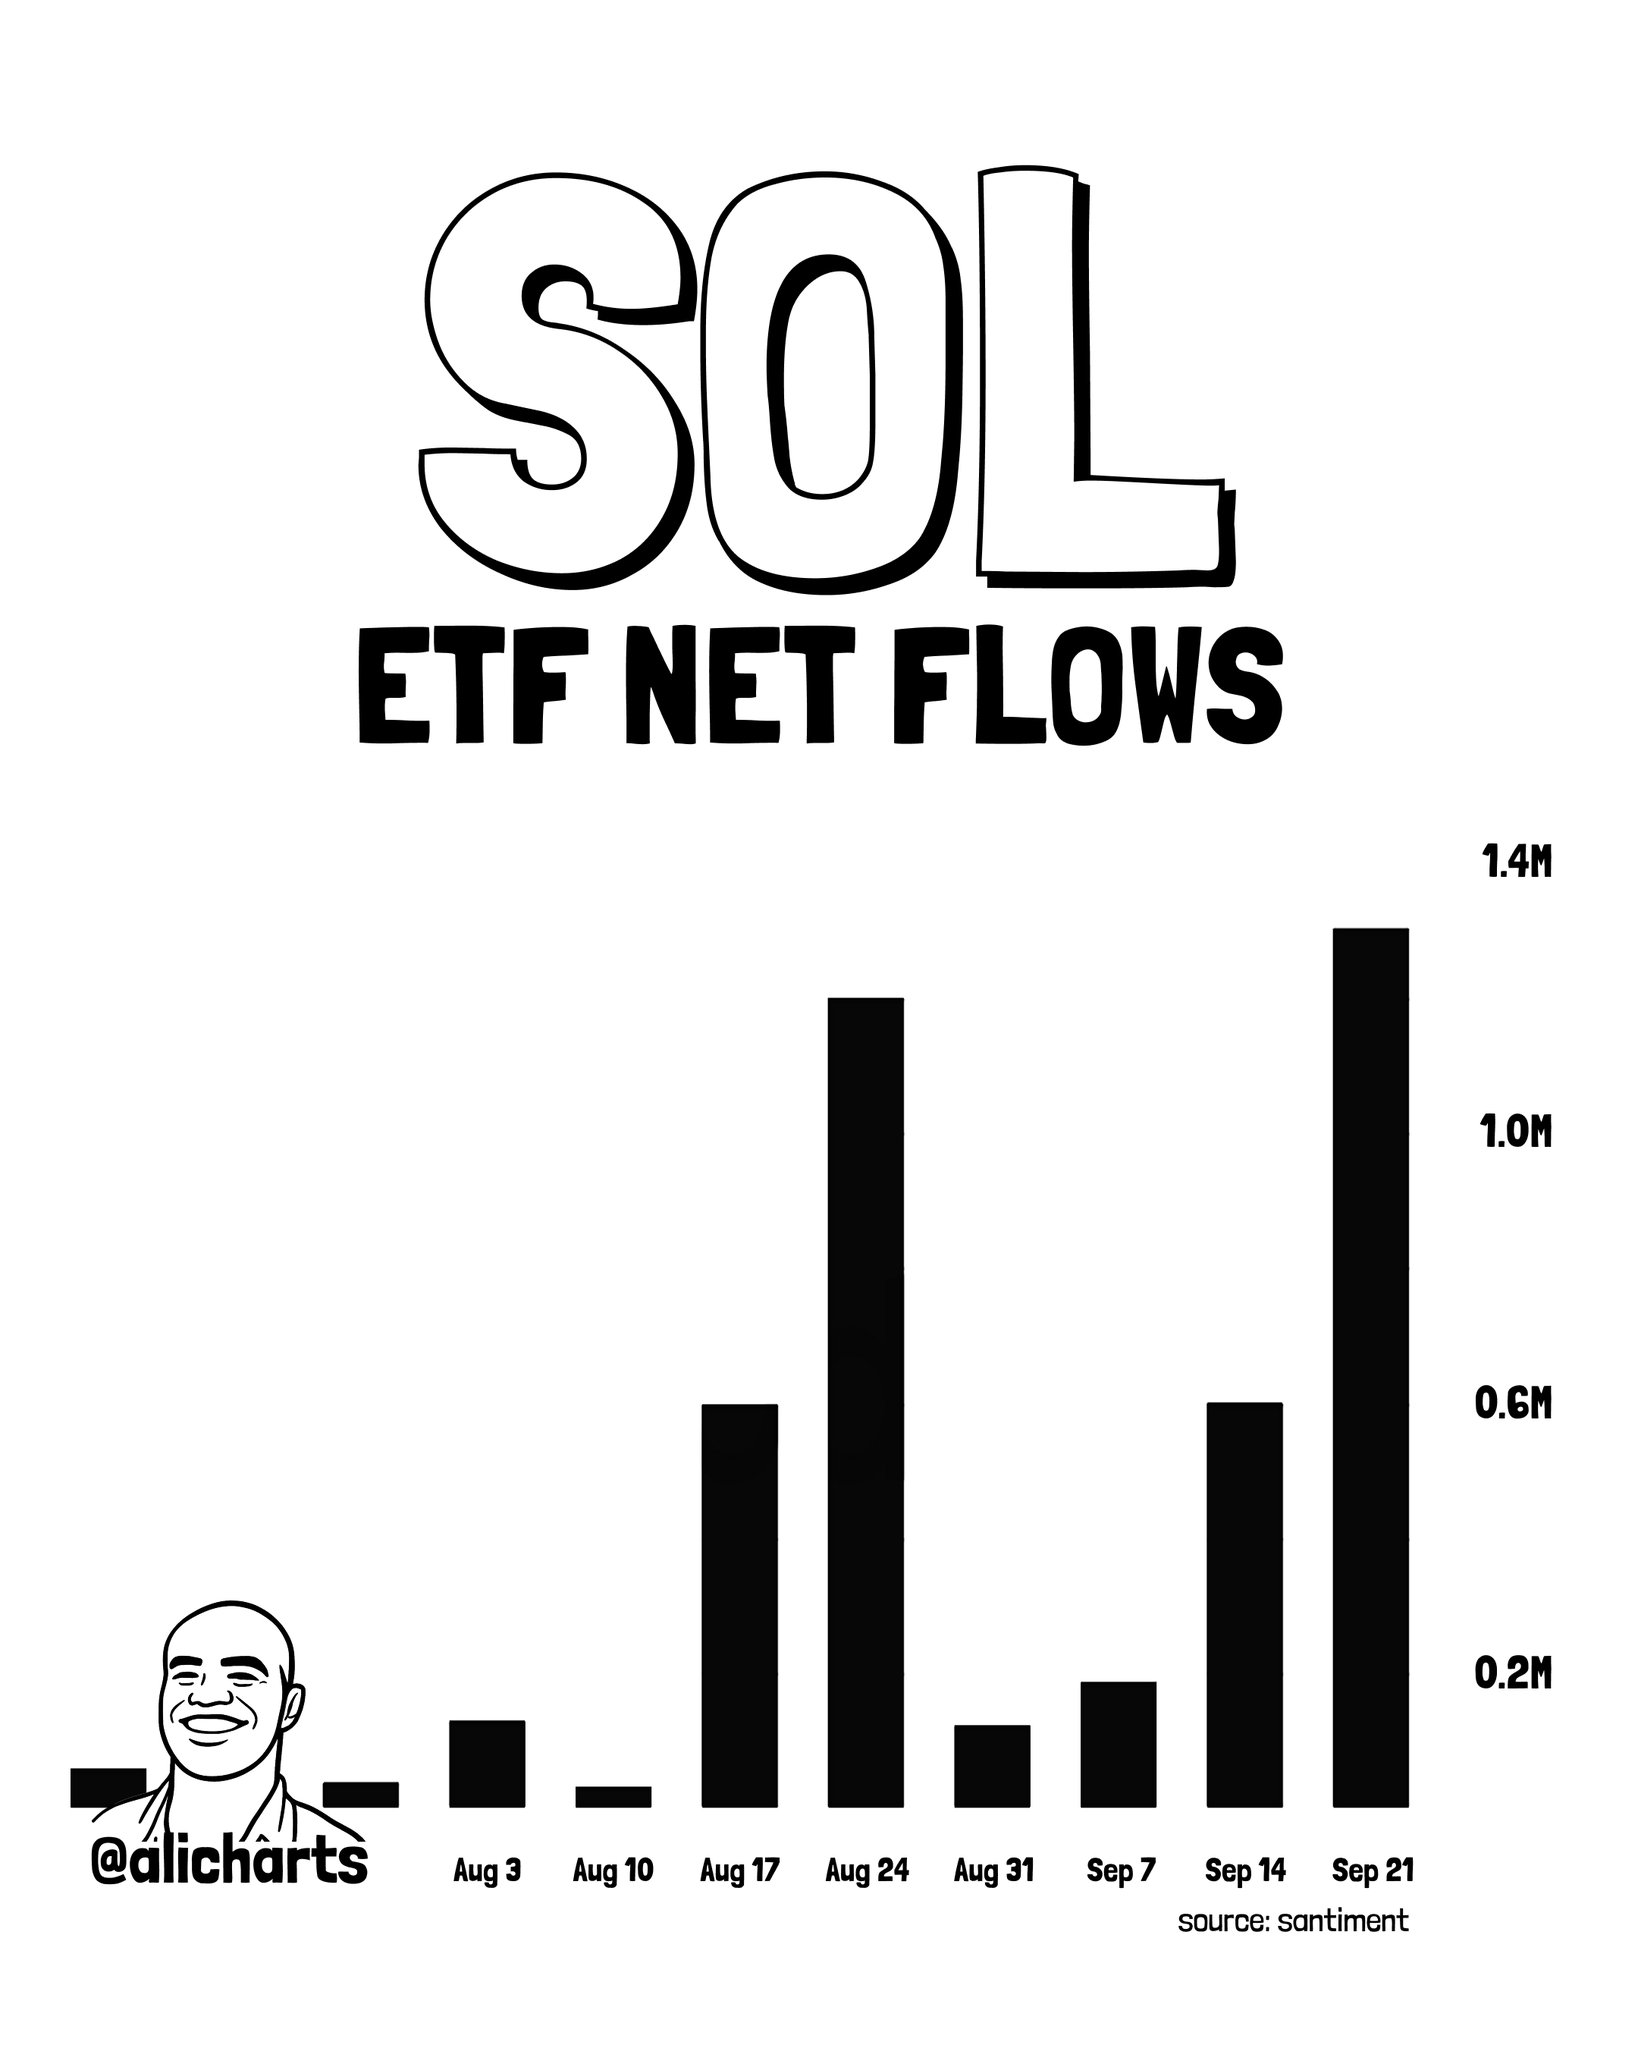
The acceleration matters. If institutional buyers were simply holding a position, inflows would flatten. Instead the final data point on this chart is the largest. That is not consolidation — that is demand expanding at the margin.
Why Supply Absorption Changes the Price Equation
At 4.37 million SOL accumulated since July 13, US Spot ETFs have removed a measurable portion of liquid supply from the open market. This is the direct mechanism connecting ETF inflows to price: spot ETFs must hold the underlying asset, meaning every unit of net inflow represents SOL physically purchased and held off exchange.
The math is straightforward. At approximately $103 per SOL (the implied price from $450M across 4.37M SOL), institutional buyers have been averaging in throughout a range and are now sitting on a position that dwarfs typical retail accumulation events. For context, a single on-chain whale trade that attracted significant attention involved a SOL trader sitting on a $23M unrealized gain from a $67.88M 20x long — the ETF accumulation at $450M is an order of magnitude larger.
When supply tightens and a single demand cohort (in this case, regulated US ETF vehicles) is buying consistently without selling, the price required to source additional SOL rises. That is not a prediction — it is an arithmetic consequence of supply and demand.
ETF Inflows as a Leading Signal — And Its Limitations
ETF flow data is a sentiment and demand indicator, not a direct price trigger. The distinction matters. Inflows confirm that institutional buyers have been active — they do not guarantee that price will respond immediately or proportionally.
What the 11-week streak does confirm with certainty:
- Sustained demand: No single week of outflows across the entire accumulation period since July 13
- Accelerating pace: The September 21 weekly bar (~1.35–1.4M SOL) is the highest on the entire chart
- Scale: $450 million in ETF-driven spot buying represents institutional-grade conviction, not retail positioning
What it does not confirm: the exact price level at which the market reprices this demand, or the timing of any breakout move. ETF flows lag price action in some market phases — buyers accumulate through range, and price only responds when the float of available sellers is exhausted.
Analysts tracking the broader Solana ecosystem have separately noted setups that could accompany an institutional-driven leg higher. Among the altcoin layer, pattern watchers have flagged that tokens within the Solana ecosystem are showing pre-explosion patterns — a signal that is historically consistent with late-stage accumulation in the underlying asset before a directional move.
Institutional Infrastructure Deepening Around Solana
The ETF accumulation data does not exist in isolation. Regulated derivatives infrastructure for Solana has been expanding in parallel. The Moscow Exchange launched perpetual futures for Solana alongside Bitcoin, Ethereum, XRP, and Tron — adding another regulated venue where institutional participants can manage SOL exposure. More futures venues mean more hedging capacity, which lowers the friction cost for large spot positions.
When spot ETF accumulation, ecosystem altcoin positioning, and regulated derivatives expansion occur simultaneously, the structural backdrop for a directional move strengthens — not because any single signal guarantees a breakout, but because the conditions that historically precede sustained institutional-driven rallies are present across multiple dimensions.
Bullish Scenario
If ETF inflows stay above 1 million SOL per week through October, supply keeps tightening. @alicharts is watching the next leg higher, with $150 as the level on the board from current prices near $119. With no corresponding outflow pressure, the spot market float tightens and a breakout from the current range opens the next technical leg higher as flagged by @alicharts. The September 21 inflow acceleration — the largest single-week reading on record — would serve as the demand confirmation signal.
Bearish Scenario
If ETF inflows turn negative for even one week — breaking the 11-week streak — it would signal the first institutional demand reversal since July 13. A net outflow week would not immediately invalidate the bullish structure, but two consecutive negative bars would indicate the supply absorption thesis has stalled. The $450M accumulated position would then become overhead supply rather than support.
The 11-week streak is the metric to watch. @alicharts’ call is built on it continuing. DeFiLlama’s daily Solana revenue data and real-time ETF flow trackers will update that picture as October progresses. Eleven consecutive inflow weeks have put the breakout setup on the table — whether week twelve extends or breaks the streak will determine whether it stays there.