
- SOL trades at $101.24 — up 4.57% in 24 hours — with $59.44B market cap as bull flag forms on 4H chart
- Analyst Ali Martinez (@alicharts) flags $105 as the breakout trigger — a sustained 4H close above it targets $130–$135
- Lower flag support at $95–$97 is the invalidation level — its loss ends the bullish pattern structure
- Measured move projects 28–33% upside from current price if $105 breakout confirms with volume expansion
Solana is trading at $101.24 — up 4.57% in the last 24 hours — with a market cap of $59.44 billion and $3.83 billion in 24-hour volume. At this price, SOL is not simply recovering. According to one closely watched technical analyst, it is compressing inside a textbook continuation pattern that, if confirmed, projects a move to $130 — approximately 28% above current levels.
That pattern is a bull flag on the 4-hour chart, which crypto analyst Ali Martinez (@alicharts) identifies as a near-term breakout setup. His exact words: “A bull flag appears to be forming on Solana’s 4-hour chart. The key level I’m watching for $SOL is $105. A sustained close above it could confirm the bullish breakout and open the door to a rally toward $130.”
The call is specific, the level is named, and the mechanism is a measured-move projection from an established continuation pattern.
The Bull Flag — What It Is and What the Chart Shows
A bull flag is a continuation pattern, not a reversal. It does not form at bottoms — it forms after strong upward impulse moves, during brief, orderly consolidations before the prior trend resumes. The pattern has two components: the flagpole (the sharp rally) and the flag itself (a descending or sideways channel compressing price into a tight range).
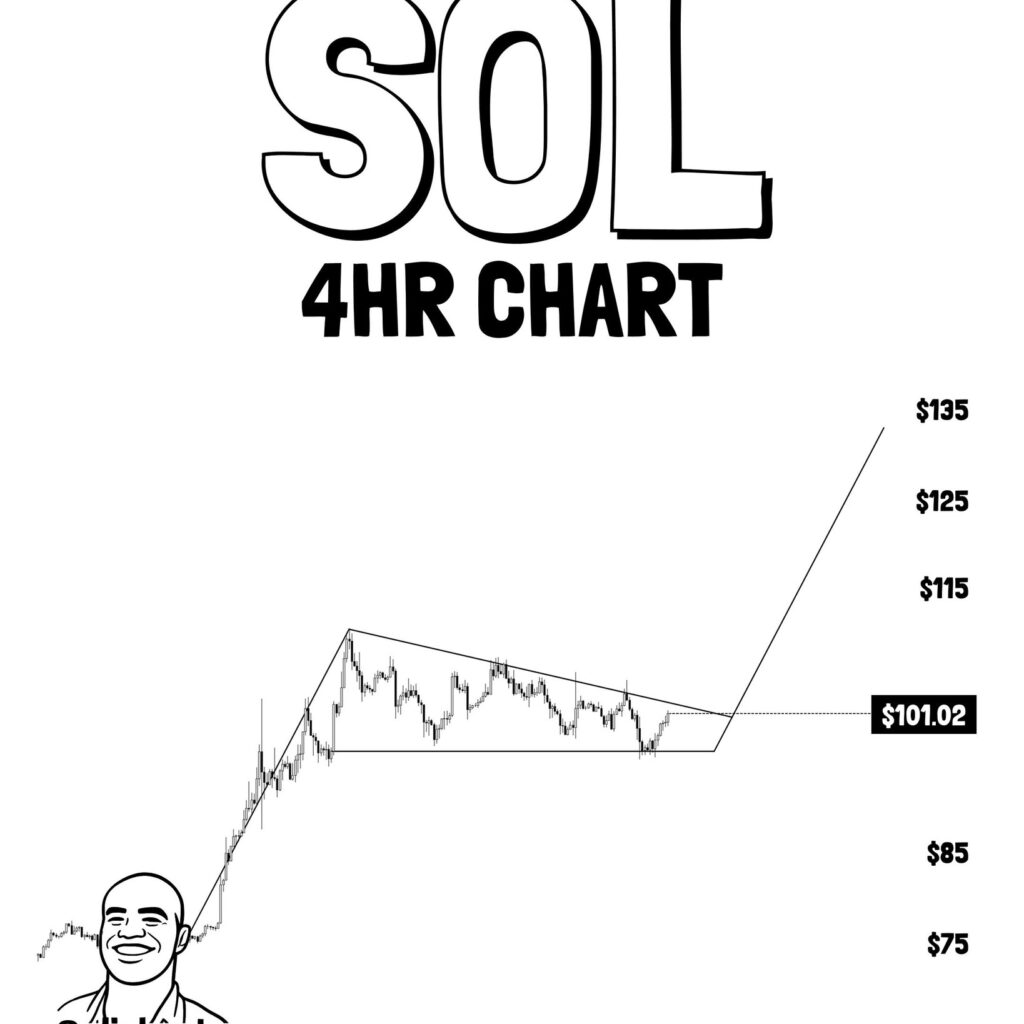
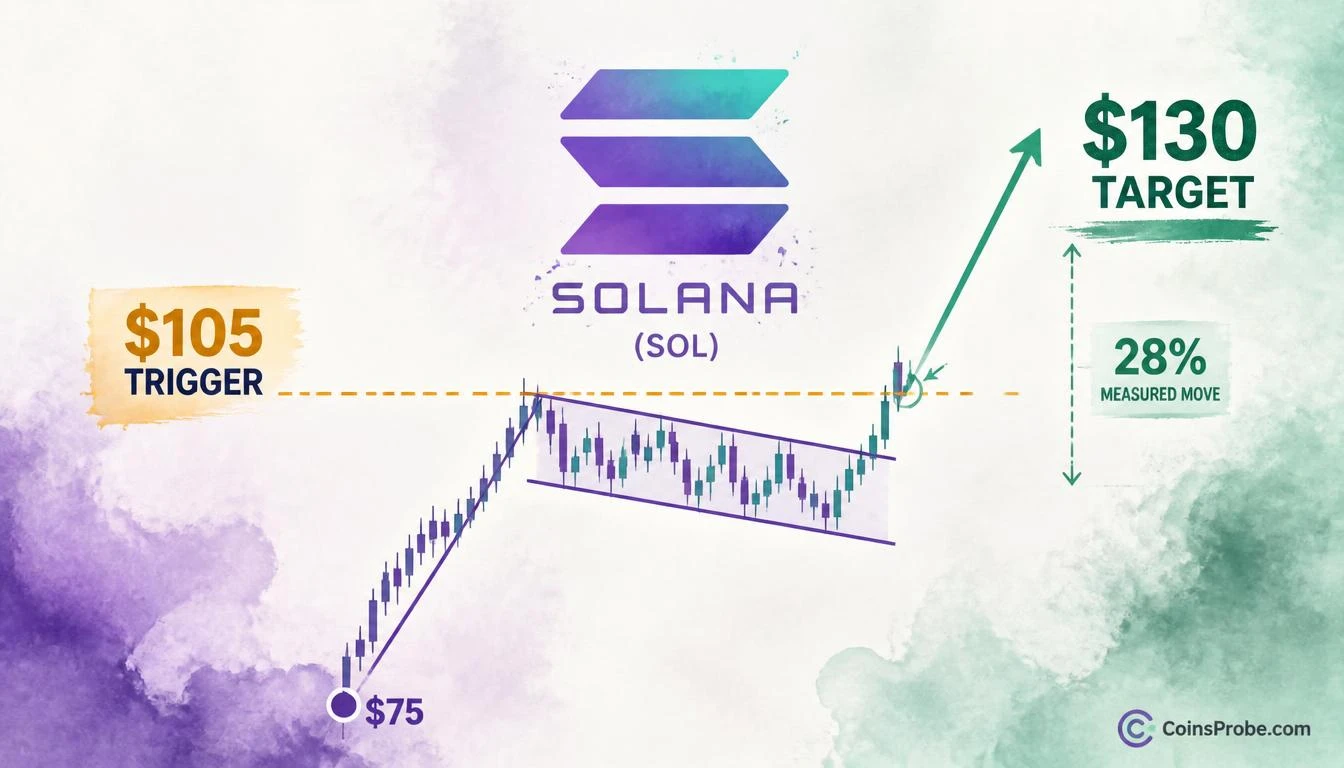
The 4-hour SOL/USD chart shared by @alicharts covers late August through early October and shows precisely this structure. Solana printed a strong impulse leg from approximately $75, establishing the flagpole. Price then entered a descending channel consolidation — lower highs, relatively stable lows — compressing between converging trendlines. The lower trendline support base sits at $95–$97. Current price at $101.24 places SOL mid-flag, with the upper trendline resistance and breakout trigger at $105.
The measured move target — derived by projecting the flagpole length from the breakout point — sits at $135 on the chart, with Martinez citing $130 as the key rally objective. That range represents 28–33% upside from the current price.
One critical technical detail: volume. A bull flag breakout confirmed by volume expansion carries materially higher conviction than one on thin participation. Without volume expansion on the breakout candle, the signal carries elevated failure risk. Traders watching this setup should treat volume as the secondary confirmation requirement, not an afterthought.
$105 — The Exact Trigger Level
The $105 level is not arbitrary. It represents the upper boundary of the descending flag channel on the 4-hour chart — the structural resistance that, when breached with a sustained close, formally ends the consolidation phase and activates the measured move projection.
Martinez is specific about the close requirement: a sustained 4-hour close above $105, not an intraday wick or brief touch. This distinction matters. Wicks through resistance are common during consolidation and do not constitute breakout confirmation. A sustained close requires price to hold above the level through candle close, signaling that sellers at that zone have been absorbed.
At the time of writing, SOL is trading at $101.24 — meaning price needs to advance approximately 3.7% from current levels to trigger the breakout confirmation Martinez is watching.
Why Bull Flags Form — and Why They Often Resolve Higher
The bull flag pattern reflects a specific market dynamic: after a sharp upward move, profit-takers exit, creating the shallow pullback that forms the flag. Meanwhile, buyers who missed the initial impulse use the consolidation to accumulate positions at slightly lower prices. The result is a compression of supply and demand into an increasingly tight range. When the buying pressure finally overwhelms the remaining sellers, price breaks upward — often quickly, because the compressed energy releases in a concentrated burst.
This is the mechanism behind the $130 target. It is not a round number selected arbitrarily. It is the distance of the original flagpole ($75 to the top of the impulse move) projected upward from the $105 breakout level. Measured moves are not guarantees — but they are the market’s mathematical expression of what continuation looks like if the pattern resolves as intended.
This technical setup comes alongside notable fundamental developments. Solana spot ETFs have logged nine consecutive weeks of net inflows totaling $200 million over the past 30 days — a structural demand signal operating independently of short-term chart patterns. Additionally, Solana’s exchange supply has dropped by 3 million SOL, tightening the available float at the same time chart patterns suggest a move is forming.
Key Levels at a Glance
| Level | Role | Significance |
|---|---|---|
| $95–$97 | Lower flag support | Invalidation zone — loss confirms pattern failure |
| $101.24 | Current price | Mid-flag, 3.7% below trigger |
| $105 | Breakout trigger | Sustained 4H close required for confirmation |
| $130–$135 | Measured move target | 28–33% upside from current price |
SOL/USD Key Levels — Bull Flag Setup | Source: @alicharts (X)
What the Signal Says — and What It Doesn’t
What it says: A textbook bull flag continuation pattern has formed on SOL’s 4-hour chart following a strong impulse move from $75. The pattern projects a measured move to $130–$135 if confirmed above $105.
What it doesn’t say: That a breakout is guaranteed. Bull flags fail — price can continue lower, break the $95–$97 support base, and invalidate the entire setup. The pattern is a probability framework, not a certainty.
What to watch for confirmation: A sustained 4-hour candle close above $105, accompanied by above-average volume on that candle. Both conditions together constitute confirmation. Either condition alone is insufficient.
Bullish Scenario — Sustained Close Above $105
A confirmed 4-hour close above $105 with volume expansion activates the measured move projection toward $130–$135. At $130, that represents a 28.4% rally from the current $101.24. This would be consistent with the pattern’s prior impulse magnitude and with the broader fundamental backdrop of consistent ETF inflows and tightening exchange supply.
Bearish Scenario — Loss of $95–$97 Support
Failure to break $105 and subsequent loss of the $95–$97 lower trendline support base would invalidate the bull flag structure. In that scenario, the descending channel resolves as a breakdown rather than a breakout, with no measured move target to the upside and potential re-test of the $85–$88 range. This outcome would represent approximately 14–16% downside from current price.
Bottom Line
Solana is printing a bull flag on the 4-hour chart — a continuation pattern that formed after a strong impulse rally from $75. Analyst Ali Martinez (@alicharts) has identified $105 as the exact breakout trigger, requiring a sustained 4-hour close above that level to confirm the pattern. The measured move target sits at $130–$135, representing 28–33% upside from the current price of $101.24. The pattern is supported by converging fundamental signals: nine consecutive weeks of ETF inflows and a 3-million-SOL drop in exchange supply. The bull flag, however, is a probability framework — not a guarantee. Volume confirmation on the breakout candle is the secondary signal traders cannot afford to ignore. Watch $105 as the level that either confirms this setup or extends the consolidation. Watch $95–$97 as the level whose loss ends the bullish thesis entirely.
Frequently Asked Questions
What is the bull flag pattern forming on Solana’s 4-hour chart?
What price must Solana close above for the breakout to be confirmed?
What is Solana’s price target if the bull flag breaks out?
What level invalidates the Solana bull flag setup?
Why does volume matter for the Solana breakout confirmation?
Source: Ali Charts · Published by CoinsProbe Markets Desk
The opinions and market insights shared on CoinsProbe represent the views of individual authors based on prevailing market conditions at the time of publication. Cryptocurrency investments carry significant risk and volatility. Readers are encouraged to conduct their own research and seek professional financial advice before making investment decisions. CoinsProbe and its contributors do not accept responsibility for financial losses or decisions made based on published content.
CoinsProbe may publish sponsored articles, affiliate links, or promotional collaborations. All sponsored material is clearly labeled to maintain transparency with our audience. Our editorial decisions remain fully independent, and advertising partnerships do not influence reviews, rankings, or published opinions.
Since 2023, CoinsProbe has delivered reliable insights on cryptocurrency, blockchain, and digital assets. Our content is created by experienced researchers and analysts who follow strict editorial standards focused on accuracy, transparency, and credibility. Every article is carefully reviewed and verified using trusted sources and current market data. We provide unbiased analysis and timely updates covering everything from emerging crypto projects to major industry developments.