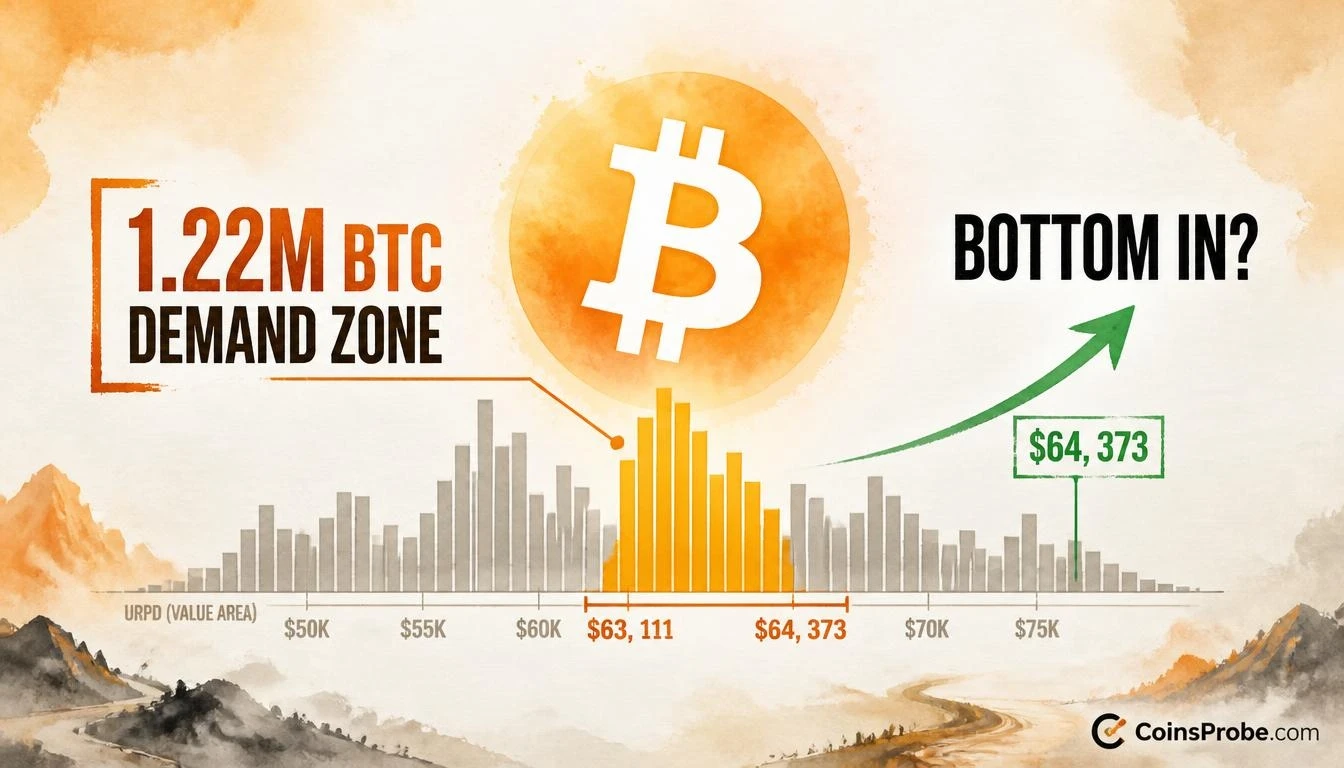
- Bitcoin is trading at $64,146 — directly inside the $63,111–$64,373 URPD demand zone identified by an on-chain analyst
- Approximately 1.22 million BTC previously transacted in this zone, representing ~6.1% of Bitcoin's total capped supply
- Spot Bitcoin ETFs recorded $239.9M in net outflows on Nov 17, with $1.0B in net outflows over five sessions per SoSoValue
- A daily close below $63,111 would invalidate the zone; reclaiming $64,373 is the first structural confirmation signal
Bitcoin is trading at $64,146 — down 1.02% in the past 24 hours — and sitting directly inside one of the most significant on-chain demand clusters identified in this correction cycle. The question on the table is not minor: has Bitcoin already found its macro bottom?
An on-chain analyst flagged the zone using the UTXO Realized Price Distribution (URPD), identifying a dense concentration of approximately 1.22 million BTC that previously changed hands between $63,111 and $64,373. At the time of writing, Bitcoin is trading at $64,146 — squarely within that band. The analyst’s post, published November 18, 2026, frames it plainly: “Bitcoin has reached a major demand zone… This is one of the most significant support zones following the recent market correction.”
What the URPD Actually Measures
The URPD — UTXO Realized Price Distribution — is a Glassnode on-chain metric that maps where existing Bitcoin supply last moved on-chain, grouped by the price at which each UTXO was last transacted. It is not a derivative or sentiment indicator. It is a direct record of cost basis distribution across the entire Bitcoin supply.
When a large volume of BTC clusters at a specific price range on the URPD, it means a significant number of holders acquired — or last moved — their coins at that price. Those holders face a binary outcome at that level: either the price holds and they remain in profit (or at breakeven), or it breaks lower and they enter unrealized loss. Historically, dense URPD clusters act as gravitational support because holders who bought at those levels tend to defend their cost basis.
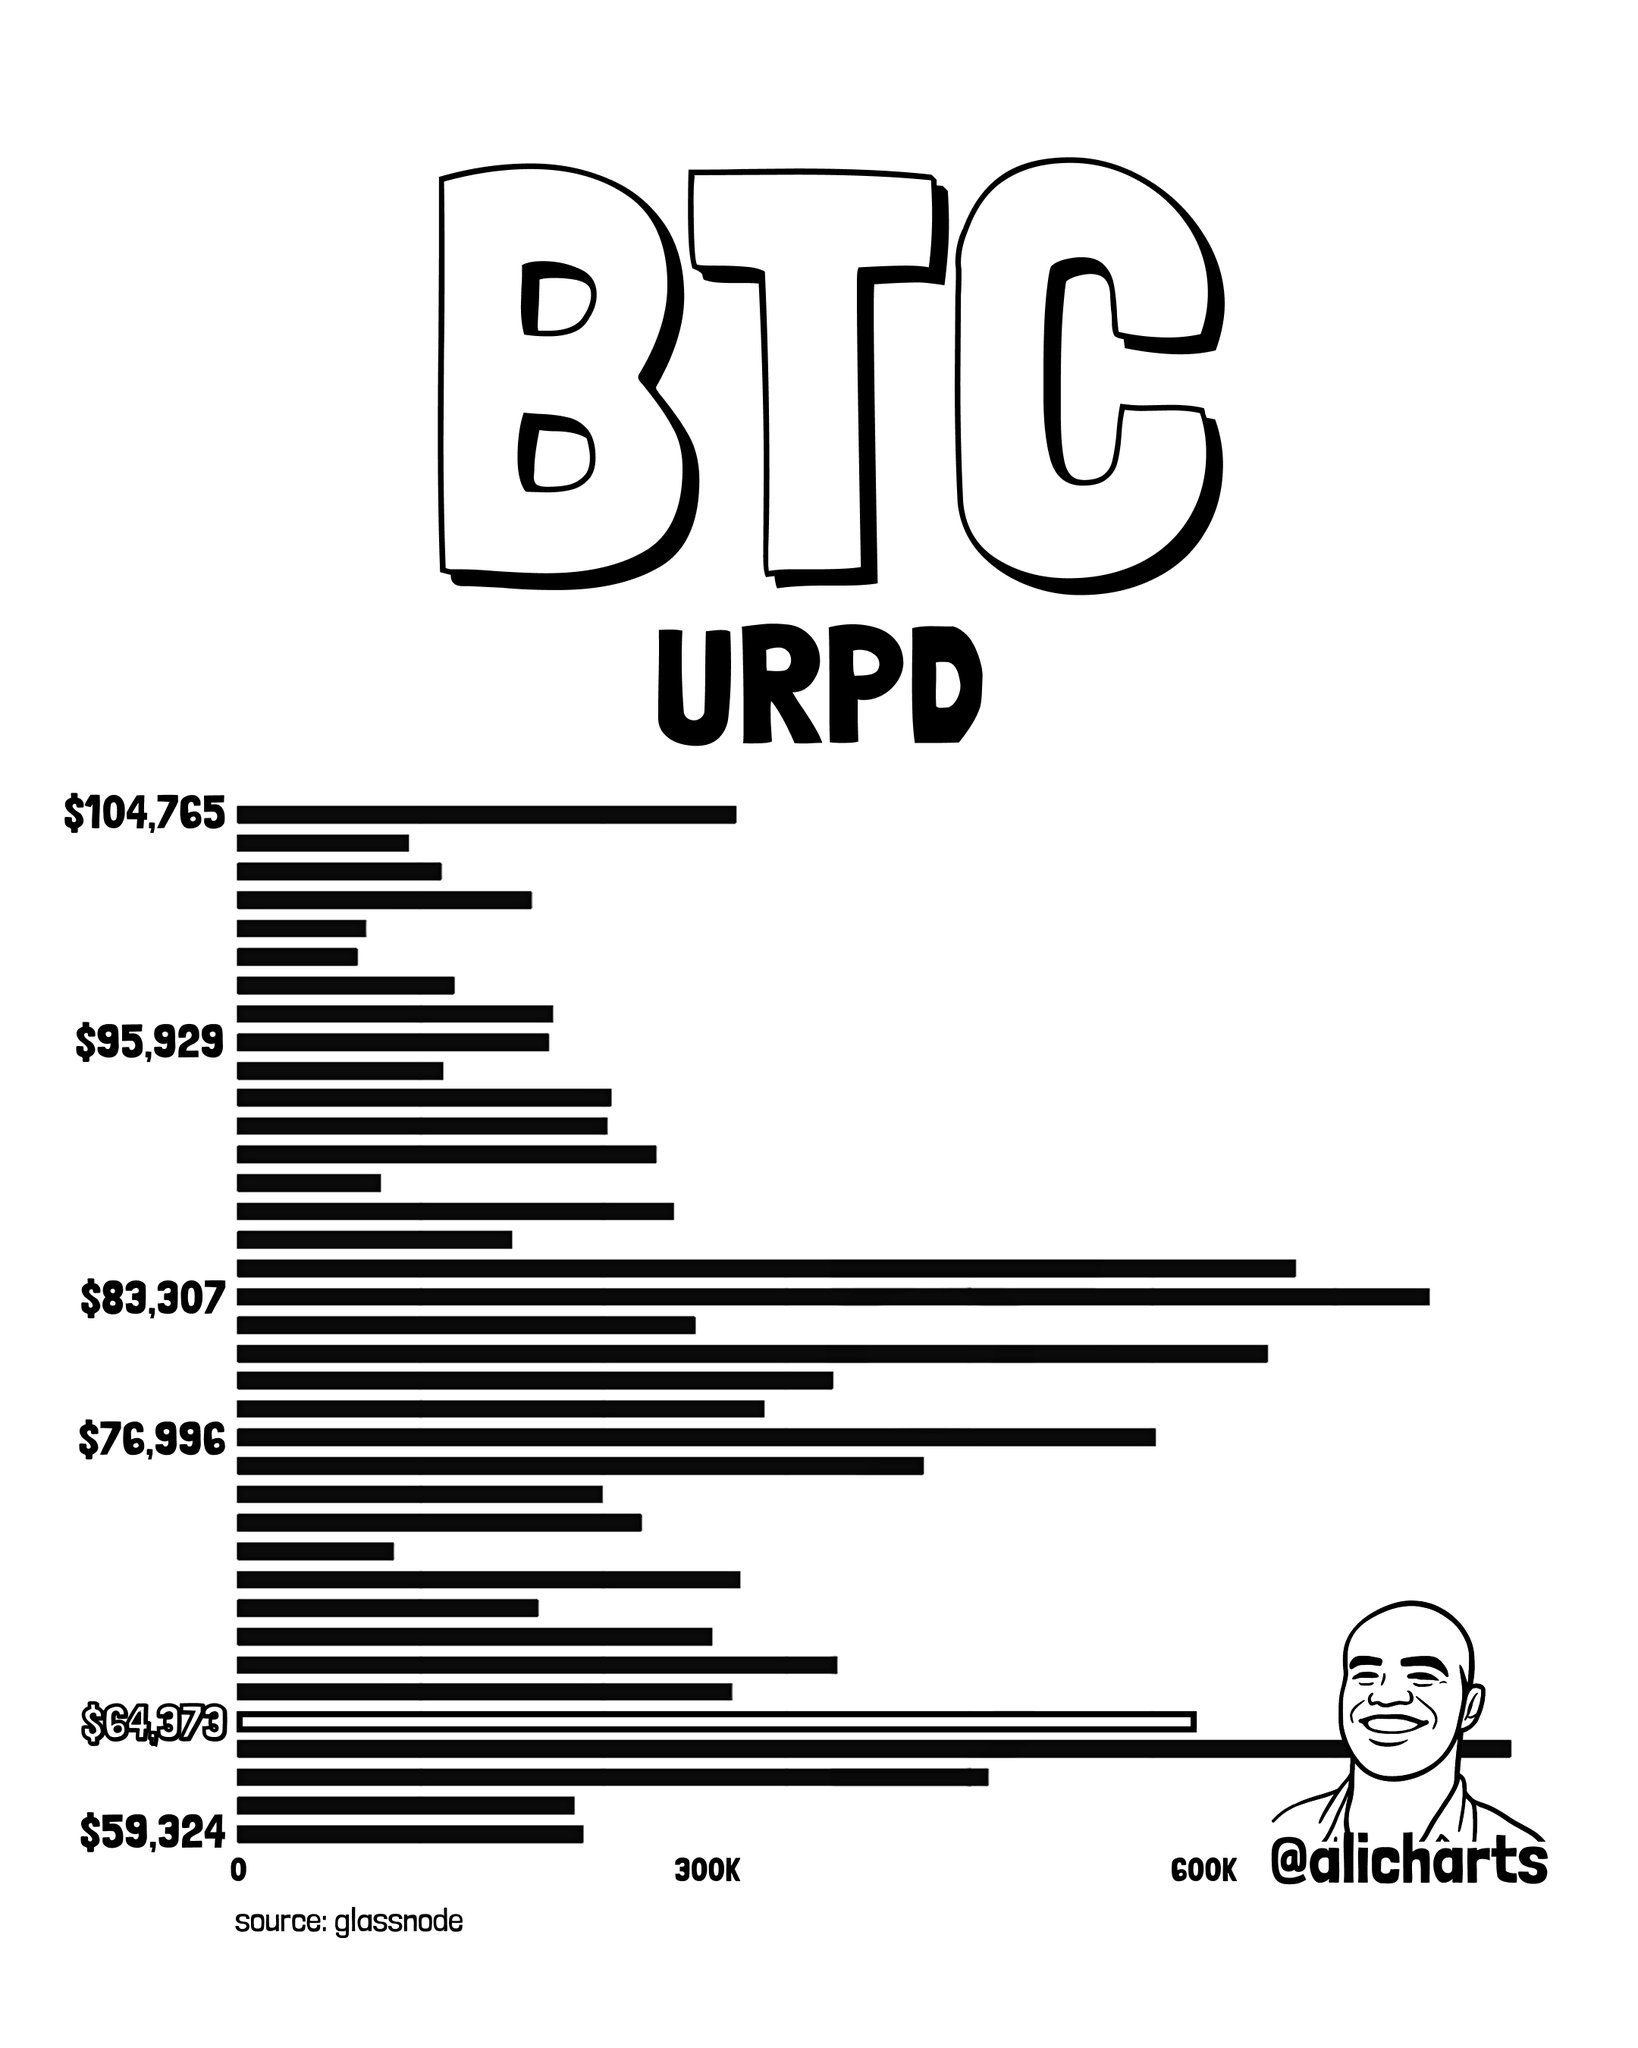
The chart from Glassnode’s data shows the longest bar in the entire distribution sits at approximately the $83,307 zone — suggesting heavier accumulation higher up. But the analyst’s focus is on the $63,111–$64,373 band, which the URPD shows as carrying roughly 1.22 million BTC in prior transaction volume. That is a structurally meaningful concentration.
The $63,111–$64,373 Zone — Why It Matters
At 1.22 million BTC, the demand cluster at $63,111–$64,373 represents approximately 6.1% of Bitcoin’s total 21 million supply cap — a substantial portion of circulating supply with a cost basis anchored to this range. When price revisits a cluster this dense, the market is effectively testing whether those holders absorb selling pressure or capitulate.
The chart labels visible on the URPD visualization confirm price levels at $64,373, $76,996, $83,307, $95,929, and $104,765 — with no significant URPD clusters annotated between $64,373 and $76,996. This gap in the distribution is analytically important: if the $63,111–$64,373 zone fails to hold, the analyst notes the next significant resistance on the upside does not appear until $76,996, implying limited friction in either direction once this zone resolves.
It is also worth noting the broader context for Bitcoin demand heading into this test. Bitcoin’s apparent demand had collapsed to -362,000 BTC earlier this cycle, making the current test of a dense cost-basis cluster particularly significant — this is not a demand-rich environment. That makes the URPD support test more binary, not less.
ETF Flows — Institutional Pressure Remains
The on-chain picture does not exist in isolation. Spot Bitcoin ETF data via SoSoValue adds a layer of caution to the bottom thesis. On the latest available trading date (November 17, 2026), spot ETFs recorded a net outflow of $239.9 million, with IBIT alone accounting for $209.5 million of that figure. Over the past five trading sessions, net outflows total $1.0 billion — with only one inflow day recorded across that window.
Total ETF net assets stand at $79.65 billion, with cumulative inflows since launch at $54.40 billion — meaning the structural institutional base remains intact. But the near-term directional flow is negative, which matters when price is testing a support zone. Where each ETF sits relative to its average buy price becomes a live variable in whether institutional holders add to positions at these levels or continue reducing exposure.
Strategy (formerly MicroStrategy) has continued purchasing: 485 BTC for $33.4 million in the latest acquisition, bringing total holdings to 850,849 BTC as of November 16. Over the past three weeks, Strategy has added 2,332 BTC for $180.8 million — a signal that at least one large corporate holder views the current price range as an accumulation opportunity, not a reason to exit.
The Macro Backdrop — Rate Hike Risk Is Real
One factor that makes the URPD support test more complicated than a simple technical setup: the FOMC rate outlook. Market pricing via SoSoValue shows a 96.7% probability of a rate hike at the December 9, 2026 FOMC meeting — moving from the current 3.75%–4.00% range to 4.00%–4.25%. A second consecutive hike is priced at 69.8% probability for the January 27, 2027 meeting.
Rate hike cycles historically create headwinds for risk assets. Bitcoin at a critical on-chain support zone, in an environment where the Federal Reserve is actively tightening, is a more precarious setup than the URPD alone suggests. The STH-SOPR falling below 1.0 and declining exchange inflows had already flagged that short-term holders were selling at a loss — a capitulation signal that can precede bottoms, but requires demand absorption to confirm one.
Upcoming macro data releases add further catalysts: Core PCE Price Index (MoM and YoY) and GDP (QoQ) print on November 24. Any upside surprise in core inflation would likely reinforce the rate hike trajectory and add pressure on Bitcoin at this exact zone.
What Confirmation Requires
The URPD identifies where supply is concentrated — it does not confirm whether that supply will act as a floor. For the bottom thesis to gain structural validity, two things need to happen: first, Bitcoin must sustain a closing price above $64,373 on the daily timeframe, demonstrating that sellers at this level have been absorbed. Second, ETF outflows — currently running at $1 billion over five sessions — need to stabilize or reverse, confirming that institutional capital is not actively being withdrawn through the correction.
If Bitcoin closes below $63,111 on a daily basis, the 1.22 million BTC cluster has effectively failed as support. In that scenario, the URPD shows the next meaningful concentration lower — the chart labels $59,324 as the next visible level, though the bar width at that level appears thinner than the $63,111–$64,373 zone. The absence of a dense cluster between $63,111 and lower levels means a breakdown through the zone would have limited on-chain friction to slow a move.
The demand zone is real. The 1.22 million BTC figure is on-chain data from Glassnode, not inference. But whether it holds depends on factors the URPD cannot model: ETF redemption pressure, macro rate decisions, and whether short-term holders who already registered losses choose to sell into the zone or hold. Watch $64,373 as the immediate level — a sustained daily close above it is the first structural confirmation the zone is absorbing supply rather than providing temporary friction before a deeper move.
Source: x.comFrequently Asked Questions
What is the URPD and why does the $63,111–$64,373 zone matter for Bitcoin?
What would confirm Bitcoin’s bottom at this zone versus a breakdown through it?
How are Bitcoin spot ETF flows affecting the URPD support test?
Does the FOMC rate hike outlook change the bottom thesis?
Source: Ali Charts · Published by CoinsProbe Markets Desk
The opinions and market insights shared on CoinsProbe represent the views of individual authors based on prevailing market conditions at the time of publication. Cryptocurrency investments carry significant risk and volatility. Readers are encouraged to conduct their own research and seek professional financial advice before making investment decisions. CoinsProbe and its contributors do not accept responsibility for financial losses or decisions made based on published content.
CoinsProbe may publish sponsored articles, affiliate links, or promotional collaborations. All sponsored material is clearly labeled to maintain transparency with our audience. Our editorial decisions remain fully independent, and advertising partnerships do not influence reviews, rankings, or published opinions.
Since 2023, CoinsProbe has delivered reliable insights on cryptocurrency, blockchain, and digital assets. Our content is created by experienced researchers and analysts who follow strict editorial standards focused on accuracy, transparency, and credibility. Every article is carefully reviewed and verified using trusted sources and current market data. We provide unbiased analysis and timely updates covering everything from emerging crypto projects to major industry developments.