- Bitcoin trades at $64,148 (-0.49%) as CryptoQuant documents market resilience after the record $6.3B hack
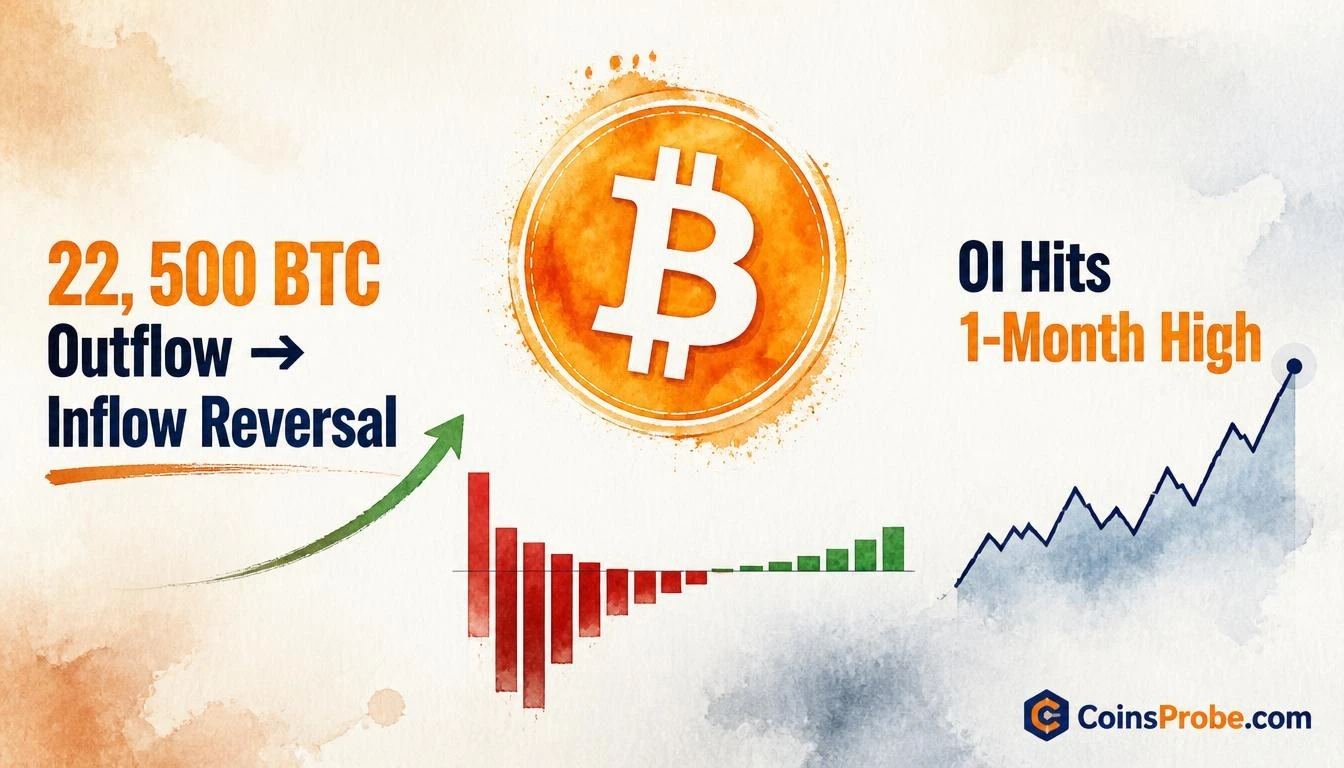
- 22,500 BTC exited Binance on hack day — flows have since reversed to net inflows within two weeks per CryptoQuant
- BTC perpetual futures open interest hit a one-month high even as prices fell — a non-directional divergence signal
- Spot BTC ETFs logged $239.9M net outflow on Nov 17, with -$1.0B over five days per SoSoValue data
Bitcoin is trading at approximately $64,148 — down 0.49% over the past 24 hours — against a backdrop that would have historically triggered a market-wide capitulation. It did not. CryptoQuant’s data shows that in the wake of the largest hack in crypto history, traders held their positions, open interest climbed to a one-month high, and the BTC that fled Binance on hack day has begun flowing back in.
CryptoQuant (@cryptoquant_com) published the analysis on November 18, 2026, framing it plainly: “A record $6.3B hack, and traders stayed put.” What the on-chain data shows across four charts is not a market in panic — it is a market that absorbed the shock and resumed positioning.
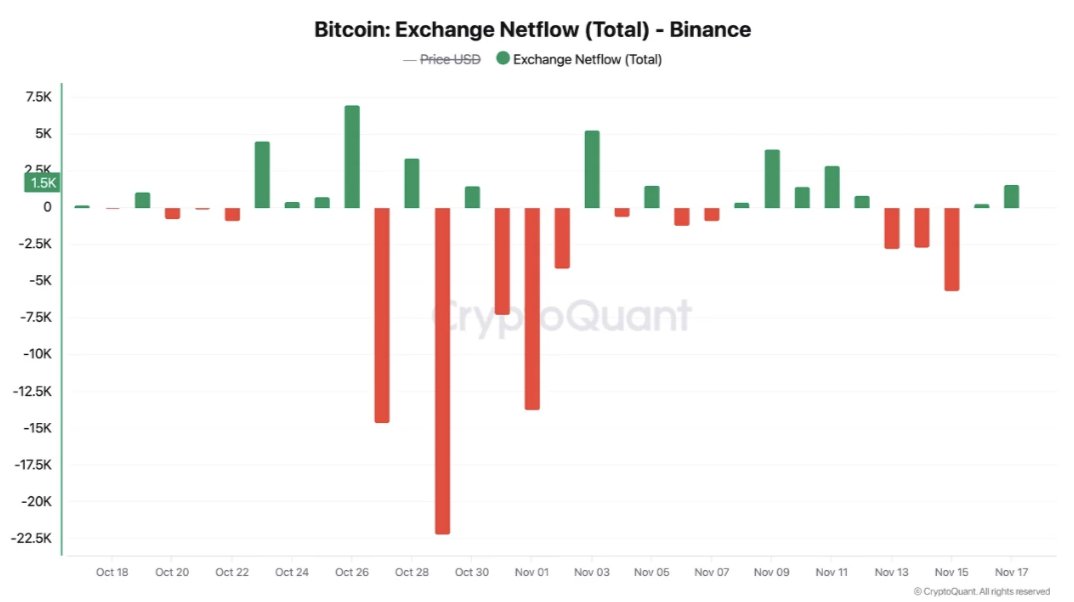
22,500 BTC Left Binance on Hack Day — Now Flowing Back In
The Binance BTC exchange netflow chart covering October 18 to November 17 tells the clearest story. On the day of the hack, approximately 22,500 BTC exited Binance in a single session — visible as the dominant negative bar in the late-October cluster. That scale of outflow in a single day reflects immediate fear-driven withdrawal: users pulling assets off the exchange as the news broke.
What happened next is the signal. Over the two weeks that followed, those outflows moderated. By the November 15–17 window — the most recent data points on the chart — Binance is registering small but positive BTC inflows. The transition from 22,500 BTC single-day outflow to net inflows within a fortnight is not a gradual drift. It is a sentiment reversal with on-chain confirmation. As noted in CryptoQuant’s analysis, Binance has retained its market-share lead post-hack — a development covered separately in Binance Retains Market Share Lead After $6.3B Hack — Key Data.
USDT Netflows: Stablecoin Shock Absorbed, Baseline Restored
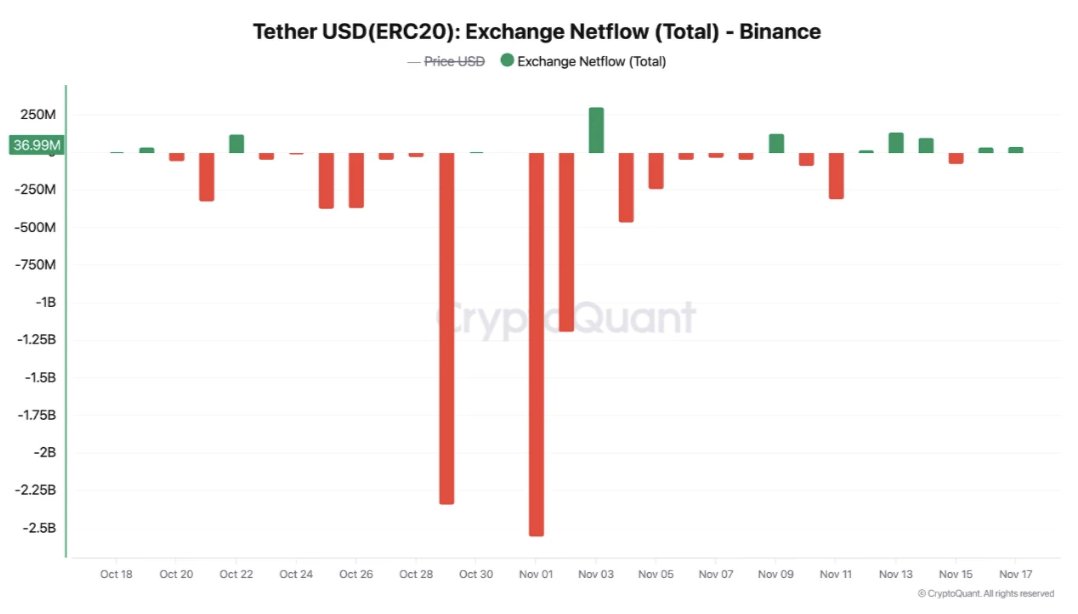
The Tether (ERC20) exchange netflow chart for Binance over the same period — October 18 to November 17 — adds a second dimension to the recovery picture. The chart shows large consecutive negative bars concentrated in the October 28 to November 3 window, representing heavy USDT outflows coinciding with the hack event. A sharp green spike followed around November 3–4, indicating a rapid return of stablecoin liquidity to the exchange.
At the latest data point (November 17), the USDT netflow sits at the 36.99M reference line printed on the chart — essentially at baseline. The extreme outflow episode has fully normalized. Stablecoin flows returning to neutral is structurally significant: it means the buying power that temporarily left Binance has redeployed or is redeploying, not sitting idle in cold wallets indefinitely.
Open Interest Hits One-Month High — Even as Prices Fell
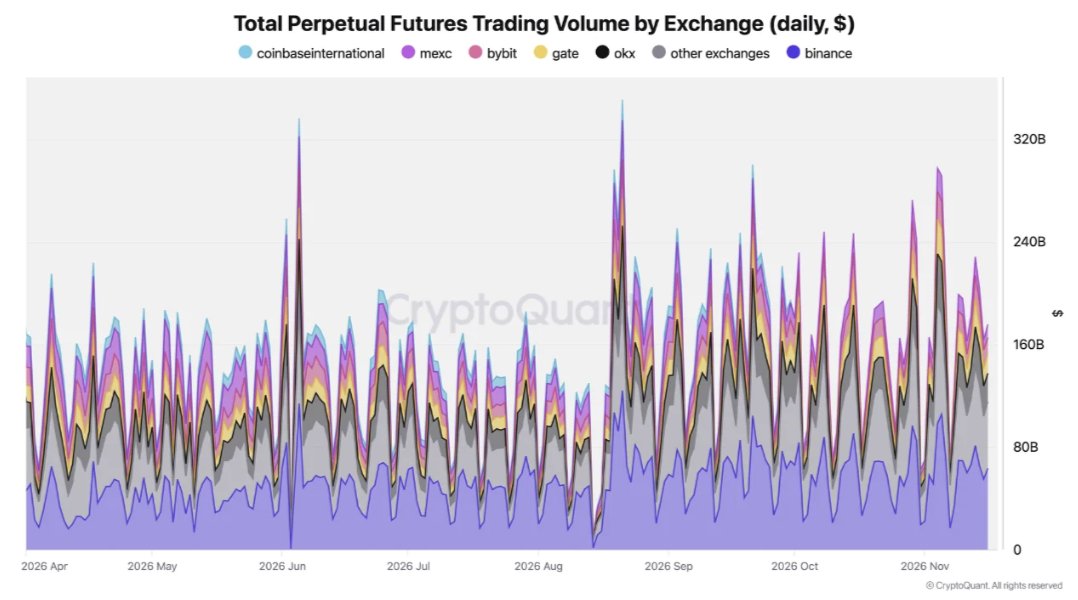
The most analytically striking data point in CryptoQuant’s report is the relationship between open interest and price. Perpetual futures open interest across exchanges hit a one-month high in the period following the hack — while Bitcoin’s price simultaneously declined. The perpetual futures volume chart covering April through November 2026 shows volume spikes becoming more frequent and dense in the October–November cluster, with elevated sustained activity from September onward.
Rising open interest against falling prices is a divergence. It means new leveraged positions are being opened as price drops — not closed. This can represent either aggressive short positioning anticipating further downside, or accumulation-driven long positioning betting on a recovery. Given that BTC flows have simultaneously reversed from outflows to inflows on Binance, the weight of evidence leans toward the latter interpretation: traders are using the price weakness to build positions, not exit them. CryptoQuant’s framing — “traders stayed put” — is supported by this divergence. For further context on current leveraged positioning dynamics, see this Hyperliquid trader with $1.57M lifetime PnL opening a $4.35M BTC short at 5x — a data point that underscores the two-sided nature of current open interest buildup.
Spot Volume Did Not Collapse
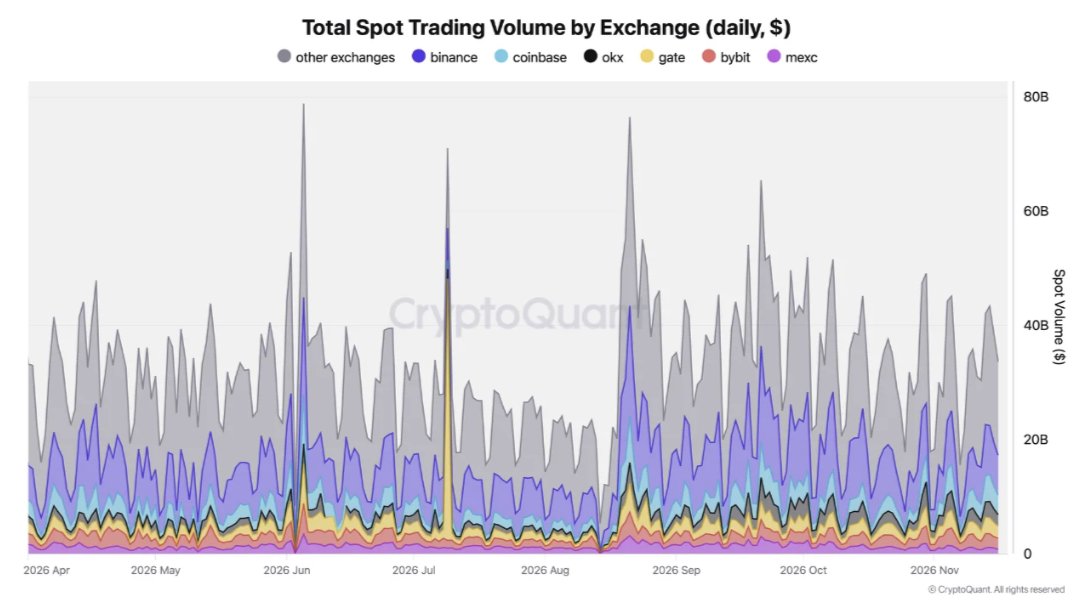
The fourth chart in CryptoQuant’s analysis covers total spot trading volume across major crypto exchanges from April through November 2026. The key observation: despite the $6.3B hack event, spot trading volume did not collapse. The chart shows irregular but persistent volume spikes throughout the period — with notable eruptions around late June, early July, late August, and scattered throughout October–November. Base volume remained consistent with no structural step-down following the hack.
Spot volume holding through a record hack event matters because it separates short-term sentiment from structural market participation. Panic exits manifest in spot volume collapse or sustained below-average readings. Neither occurred here. The market processed the largest hack in crypto history without a durable reduction in trading activity.
ETF Flows and Macro Context
Spot Bitcoin ETF data via SoSoValue provides one complicating layer: the latest trading session (November 17) logged a net outflow of $239.9M, led by IBIT shedding $209.5M. The five-day ETF flow total stands at net -$1.0B, with only one inflow day across the past five sessions. Total ETF net assets are $79.65B, with cumulative inflows since launch at $54.40B.
The ETF outflow trend runs counter to the on-chain inflow recovery at Binance — a split that matters. Institutional ETF holders appear to be reducing exposure at current prices, while on-chain traders are adding to positions. This divergence between the two cohorts is the defining tension in Bitcoin’s near-term setup. Separately, Strategy (MSTR) added 485 BTC for $33.4M in its latest purchase, bringing total holdings to 850,849 BTC as of November 16 — a data point per SoSoValue that represents continued corporate conviction regardless of short-term price movement.
The macro backdrop adds further pressure: markets are currently pricing a 96.7% probability of a rate hike at the December 9 FOMC meeting, per SoSoValue data. A tightening move in December — if realized — represents a headwind for risk assets broadly. Key data releases before that decision include GDP and PCE on November 25 and nonfarm payrolls on December 4. For context on the depth of the recent drawdown traders are navigating, see Bitcoin Traders Down 20% — Deepest Drawdown Since July as Bottoms Form.
What the Data Confirms — And What It Doesn’t
CryptoQuant’s data confirms three things with on-chain precision: the 22,500 BTC single-session outflow from Binance on hack day has reversed to net inflows within two weeks; USDT netflows have normalized back to the 36.99M baseline reference level; and open interest has reached a one-month high even as prices declined. Spot volume did not structurally collapse.
What the data does not confirm is direction. Rising open interest against falling prices is a non-directional signal — it quantifies positioning intensity, not positioning bias. The reversal of BTC outflows to inflows is a sentiment recovery indicator, not a price floor. CryptoQuant is not calling a bottom. The report is documenting market resilience — the absence of capitulation — in the face of an event that historically precedes capitulation. Whether that resilience translates into a price recovery or simply means leveraged positions unwind at a later, lower price remains the open question. The on-chain data is unambiguous about what happened. The price chart will determine what it meant.
At $64,148, Bitcoin is 0.49% lower on the day. Watch the daily open interest reading — if it sustains above the one-month high while BTC inflows to Binance continue, the resilience thesis gains structural confirmation. If open interest begins contracting alongside continued ETF outflows, the divergence resolves bearishly.
Source: x.comFrequently Asked Questions
What does rising open interest alongside falling Bitcoin prices actually mean?
How large was the BTC outflow from Binance on the hack day, and has it fully reversed?
Are Bitcoin spot ETFs also showing inflows after the hack recovery?
What is the FOMC risk for Bitcoin heading into December 2026?
Source: CryptoQuant · Published by CoinsProbe Markets Desk
The opinions and market insights shared on CoinsProbe represent the views of individual authors based on prevailing market conditions at the time of publication. Cryptocurrency investments carry significant risk and volatility. Readers are encouraged to conduct their own research and seek professional financial advice before making investment decisions. CoinsProbe and its contributors do not accept responsibility for financial losses or decisions made based on published content.
CoinsProbe may publish sponsored articles, affiliate links, or promotional collaborations. All sponsored material is clearly labeled to maintain transparency with our audience. Our editorial decisions remain fully independent, and advertising partnerships do not influence reviews, rankings, or published opinions.
Since 2023, CoinsProbe has delivered reliable insights on cryptocurrency, blockchain, and digital assets. Our content is created by experienced researchers and analysts who follow strict editorial standards focused on accuracy, transparency, and credibility. Every article is carefully reviewed and verified using trusted sources and current market data. We provide unbiased analysis and timely updates covering everything from emerging crypto projects to major industry developments.