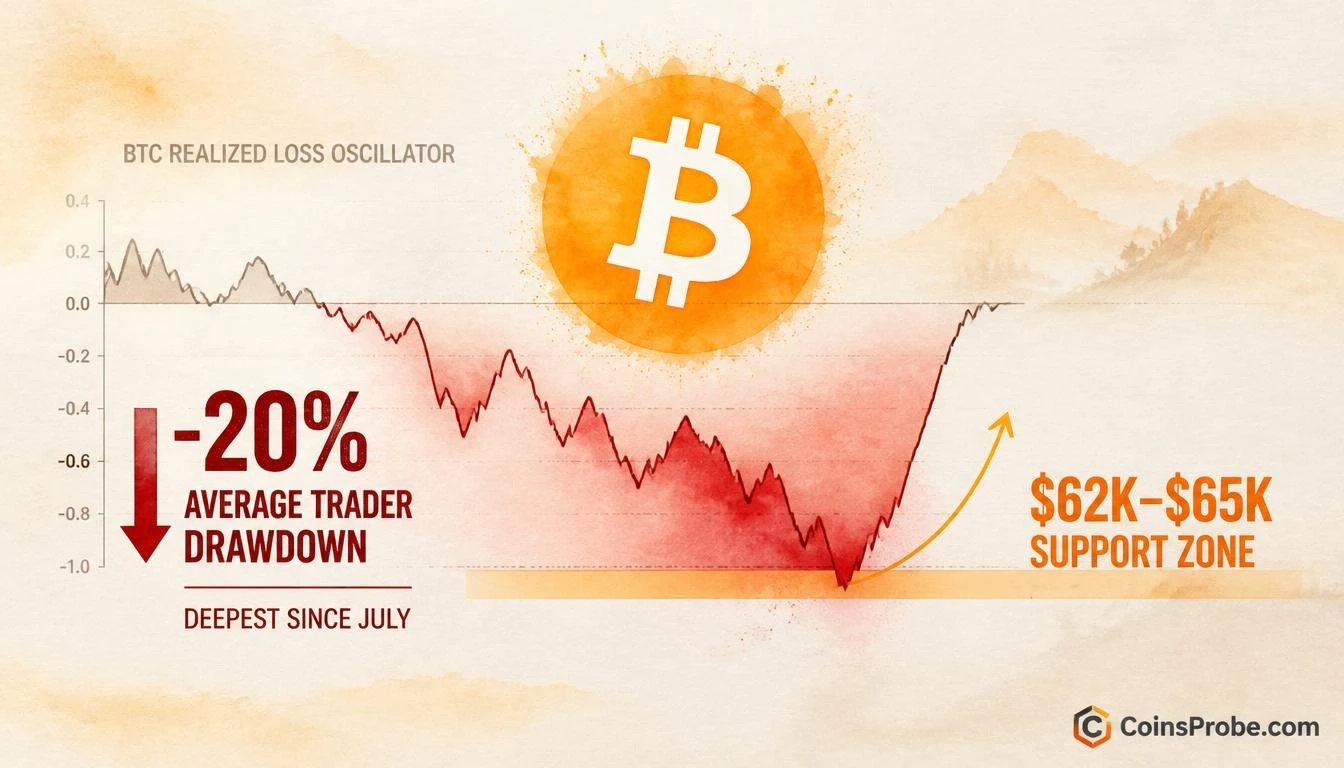

- Bitcoin trades at $64,583, inside the $62K–$65K support zone CryptoQuant identifies as structurally critical
- Average trader drawdown hits −20% — the deepest since July and 67% past the −12% bull-market correction floor
- Largest realized loss event since July 13 confirmed on-chain per CryptoQuant
- CryptoQuant: bottoms form at this level but require at least two months to develop
Bitcoin is trading at $64,583 — down 0.30% over the past 24 hours and sitting at the threshold where, historically, bull-market corrections have found their floor. The on-chain data behind that price is unambiguous: the average Bitcoin trader is currently sitting on a loss of 20%, the deepest aggregate drawdown recorded since July 2026.
CryptoQuant’s on-chain team flagged the reading directly: “Bitcoin traders are down 20% on average, the deepest since July. Bull-market corrections usually bottom near −12%. This one is past it. This is where bottoms form, but they take at least two months.” The same research thread notes that Bitcoin has re-entered a bearish phase, logging its largest realized loss event since July 13 — with $62,000–$65,000 identified as the support zone now in active play.
What the −20% Average Trader Drawdown Actually Measures
The metric CryptoQuant is tracking is not a price percentage from a recent high — it is the average unrealized or realized loss across all active on-chain positions, weighted by their cost basis. When this figure reaches −20%, it means the typical Bitcoin market participant is underwater by one-fifth of their entry value. That is a materially different signal from price drawdown alone, because it captures the actual pain distribution across the holder base — not just the spot price distance from an all-time high.
CryptoQuant’s historical baseline for bull-market corrections is −12%. In a healthy uptrend, corrections tend to exhaust seller pressure around that level — the point at which marginal sellers have capitulated and remaining holders have sufficiently strong conviction to absorb new supply. At −20%, the current reading is 67% deeper than that historical correction floor. The implication is that the market has moved past normal corrective territory and into the zone where structurally significant bottoms have historically formed.
The Realized Loss Signal — Largest Since July 13
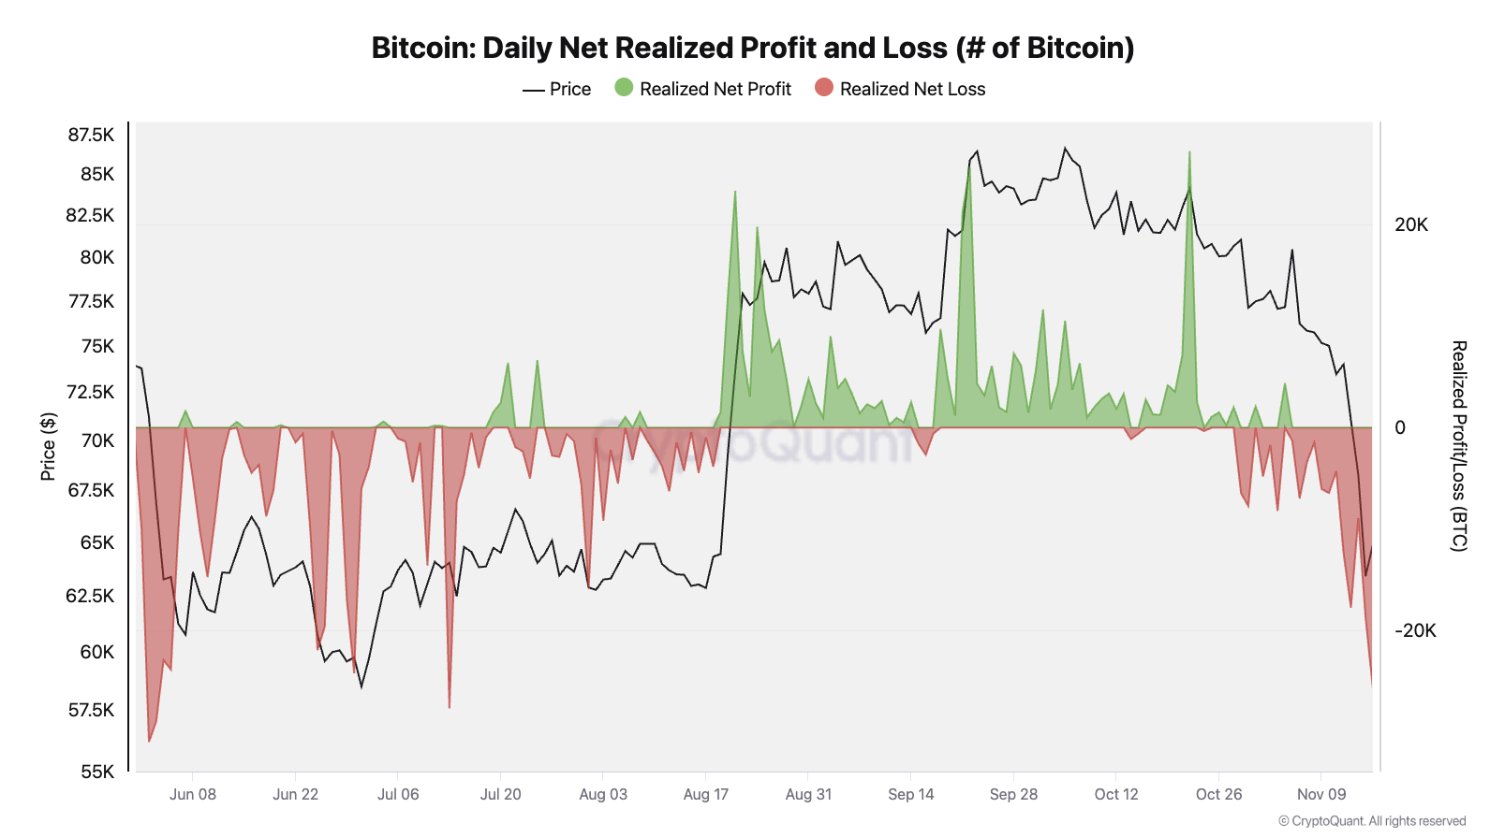
CryptoQuant’s follow-up analysis adds a second dimension: the realized loss event accompanying this drawdown is the largest since July 13, 2026. Realized losses are distinct from unrealized ones — they represent coins that have actually moved on-chain at a price below their acquisition cost. Large realized loss spikes mark moments when holders who had been waiting finally capitulate and sell at a loss. These events are historically associated with exhaustion of downside pressure, not acceleration of it.
The chart CryptoQuant published shows realized profit and loss data across the June–November 2026 window. The rightmost red zone — representing realized losses — has dropped to its deepest visible extent on the chart, matching the depth of the July trough that preceded Bitcoin’s subsequent rally. The pattern status is a confirmed breakdown: price is below support, realized losses are at cycle-deepest readings, and the net profit/loss oscillator is at the zero-line boundary. As covered in Bitcoin Re-Enters Bearish Phase — Largest Realized Loss Since July 13, this is not the first time this sequence has appeared in the current cycle.
The $62,000–$65,000 Support Zone
CryptoQuant’s research thread identifies $62,000–$65,000 as the support zone currently in play. Bitcoin at $64,583 is sitting inside that range at the time of writing — not below it. This positioning matters: the zone represents the confluence of cost-basis clusters where a meaningful cohort of on-chain participants acquired BTC. A sustained close below $62,000 would shift those participants from marginally underwater to significantly underwater, historically triggering accelerated capitulation rather than consolidation.
The $65,000 upper boundary of the zone acts as the near-term reclaim level. CryptoQuant’s data on Bitcoin demand remains deeply negative, meaning organic buying pressure has not yet arrived to validate a floor. Both conditions — a demand recovery AND a hold of the $62,000–$65,000 zone — are required before the bottom thesis can be confirmed.
The Two-Month Timeline — Why Bottoms Here Are Not Instant
CryptoQuant’s note includes a critical qualification that separates this analysis from a simple buy signal: “This is where bottoms form, but they take at least two months.” This is not a hedge — it is a structural observation about how realized-loss bottoms behave. When the average trader drawdown reaches extreme readings like −20%, the market does not snap back immediately. The process of re-accumulation, demand recovery, and sentiment reset takes time. Attempting to time the exact low within that two-month window is statistically unreliable. What the data identifies is the zone — not the day.
This aligns with the broader on-chain picture. As detailed in Bitcoin Hits All-Time High Transaction Count — But the Signals Contradict Each Other, transaction-level data has been sending mixed readings throughout this phase — a pattern consistent with a market in transition rather than one with clear directional conviction.
What Confirmation Requires
CryptoQuant’s analysis sets two conditions for the bottom thesis to advance from signal to confirmation. First, realized losses must begin contracting — the red zone on the oscillator must stop deepening and begin recovering toward zero. Second, demand-side metrics must turn. A realized loss floor without demand recovery is a pause, not a reversal. CryptoQuant’s own demand data remains in negative territory, meaning the second condition has not been met.
The support zone at $62,000–$65,000 is the structural anchor. A sustained move below $62,000 would invalidate the current floor thesis and open the path to deeper realized loss readings — territory not seen in this cycle. A reclaim of $65,000 with contracting realized losses and recovering demand would be the first evidence that the two-month bottoming process is underway.
The on-chain data has identified the zone. The timeline is at least two months. Watch $62,000 as the level that, if lost, eliminates the current floor thesis — and $65,000 as the first marker that the process of recovery has begun.
Frequently Asked Questions
What does a −20% average trader drawdown mean for Bitcoin?
How long does it take for Bitcoin to bottom after reaching these realized loss levels?
What is the key price level Bitcoin must hold to keep the bottom thesis intact?
What is the difference between realized losses and unrealized losses in Bitcoin on-chain analysis?
Source: CryptoQuant · Published by CoinsProbe Markets Desk
The opinions and market insights shared on CoinsProbe represent the views of individual authors based on prevailing market conditions at the time of publication. Cryptocurrency investments carry significant risk and volatility. Readers are encouraged to conduct their own research and seek professional financial advice before making investment decisions. CoinsProbe and its contributors do not accept responsibility for financial losses or decisions made based on published content.
CoinsProbe may publish sponsored articles, affiliate links, or promotional collaborations. All sponsored material is clearly labeled to maintain transparency with our audience. Our editorial decisions remain fully independent, and advertising partnerships do not influence reviews, rankings, or published opinions.
Since 2023, CoinsProbe has delivered reliable insights on cryptocurrency, blockchain, and digital assets. Our content is created by experienced researchers and analysts who follow strict editorial standards focused on accuracy, transparency, and credibility. Every article is carefully reviewed and verified using trusted sources and current market data. We provide unbiased analysis and timely updates covering everything from emerging crypto projects to major industry developments.