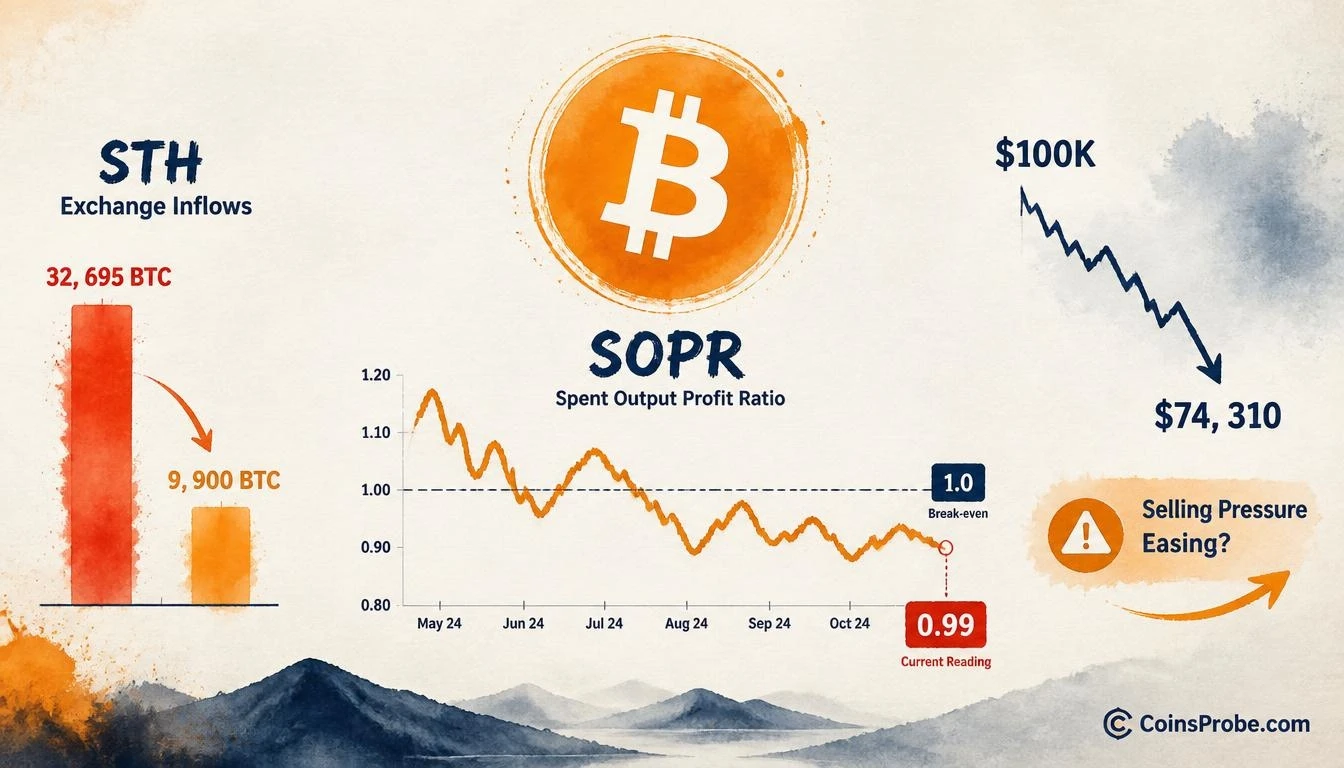

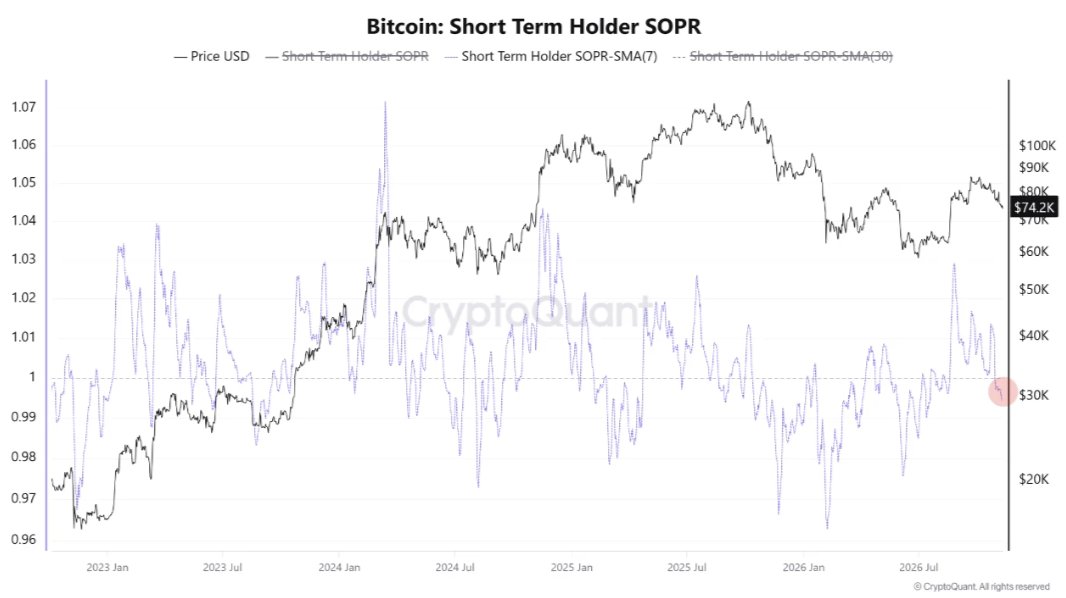
- Bitcoin trades at $74,310 (-0.37% 24h) as STH-SOPR 7MA prints 0.99 — below break-even, confirming short-term holders are in aggregate loss per CryptoQuant
- On Nov 6, 32,695 BTC held at a loss by short-term holders entered exchanges — 89% of all STH inflows; by Nov 9, that figure dropped sharply to 9,900 BTC despite a new price low
- Key metric to watch: STH P&L to Exchanges — a continued decline below 9,900 BTC signals easing sell pressure; a re-acceleration above 20,000 BTC suggests capitulation is unfinished
Bitcoin is trading at approximately $74,310 — down 0.37% in the past 24 hours — with its market cap sitting at $1.49 trillion. Beneath the surface of that price, a specific on-chain signal is flashing: short-term holders are increasingly realizing losses, while the volume of those losses flowing to exchanges is simultaneously contracting. That divergence is the story.
An analyst at CryptoQuant, publishing under the handle @MAC_D46035, documented the pattern in a November 10 Quicktake note titled “Bitcoin: Rising Short-Term Holder Losses Amid Declining Exchange Inflows.” The finding: “Bitcoin continues to face downward pressure, with losses among short-term holders increasing” — but the mechanism behind that pressure may be softening faster than the price drop implies.
The STH-SOPR — What It Actually Measures
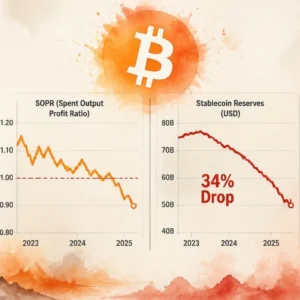
The Bitcoin Short-Term Holder Spent Output Profit Ratio (STH-SOPR), smoothed by a 7-day moving average, tracks whether short-term holders — those who acquired Bitcoin within the past 155 days — are selling at a profit or a loss. A reading above 1.0 means coins are being spent at a gain. A reading below 1.0 means the aggregate short-term holder cohort is selling at a loss.
According to CryptoQuant’s analysis, the STH-SOPR 7MA currently stands at approximately 0.99 — just below the break-even line. The indicator has broken below the 1.0 baseline, confirming that loss realization among short-term holders is now dominant. The chart shared by @cryptoquant_com shows the SOPR line oscillating sharply throughout the January 2023–November 2026 window, with the current reading sitting at or below the 1.0 dashed reference line as Bitcoin’s price has rolled off its ~$100K highs toward $74.2K.
The Exchange Inflow Divergence — Where It Gets Specific
The more precise signal comes from a companion metric: the Bitcoin Short-Term Holder P&L to Exchanges indicator, which tracks how many BTC held at a loss by short-term holders are actually flowing into exchanges. Per the CryptoQuant note, on November 6, approximately 32,695 BTC held at a loss by short-term holders entered exchanges — accounting for roughly 89% of all short-term holder exchange inflows that day. That is a large flush of underwater coins moving toward the sell side.
Then came the pivot. On November 9, when Bitcoin recorded a new price low, that figure dropped sharply to approximately 9,900 BTC. The price made a new low. The loss-realizing exchange inflow did not follow — it contracted by roughly 70% from the November 6 spike. The chart covering October 2 through November 9 shows the P&L axis printing a current reading of approximately −2.1K, with diverging dashed trendlines projected from recent price and P&L action — a megaphone shape that the analyst uses to frame the divergence between continued price weakness and declining selling volume at exchanges.
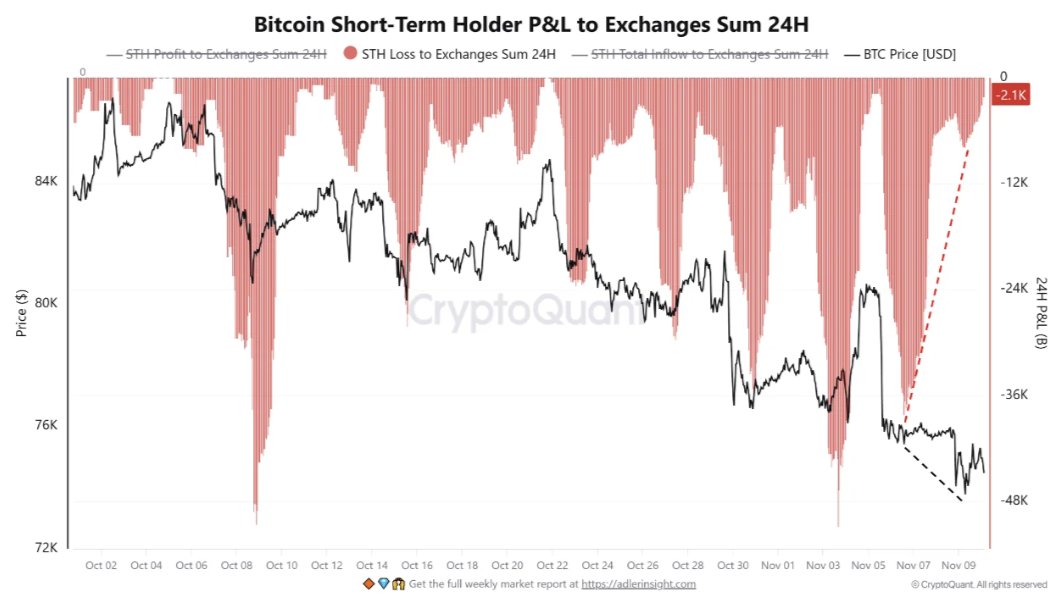
This divergence matters because exchange inflows from loss-sellers are a direct measure of potential sell pressure. When price declines but loss-driven inflows decline alongside it, the implication is that remaining holders are choosing to hold through the loss rather than crystallize it — a behavior pattern CryptoQuant’s analyst associates with easing near-term selling pressure. This dynamic relates to the broader question of how low BTC can go before structural support takes hold.
What the Historical Context Says
The CryptoQuant note explicitly references prior cycle behavior: “During previous bull markets, periods of declining selling pressure following increased loss realization among short-term holders have sometimes presented favorable accumulation opportunities.” The qualifier — “sometimes” — matters. This is not a guaranteed reversal signal. It is a conditional one.
The specific condition the analyst names: a continued decline in exchange inflows from short-term holders at a loss. If that metric keeps falling even as price remains pressured, it would historically correlate with easing downside momentum and an environment where a rebound becomes worth monitoring. The analyst is explicit that further downside remains possible — the signal does not eliminate it. It reframes the risk around selling exhaustion rather than directional certainty.
It is worth placing this in context. Bitcoin previously hit the EMA200 at $77,676 — a level that itself attracted attention as a structural reference point — before sliding further toward current levels. That EMA200 test was flagged as significant by multiple analysts. The subsequent break below it — now confirmed with price at $74,310 — is what has pushed short-term holders who bought near the highs into realized loss territory, feeding the SOPR reading below 1.0. Separately, an analyst had also flagged $73,000 as a potential dip-buy zone following rejection at the 50-day SMA — a level now within striking distance of the current price.
What the Data Confirms — And What It Doesn’t
The CryptoQuant analysis confirms three specific things: (1) STH-SOPR 7MA is at approximately 0.99, below break-even; (2) STH loss-realizing exchange inflows peaked at 32,695 BTC on November 6, representing 89% of total STH inflows; (3) those same inflows contracted to 9,900 BTC on November 9 despite a new price low. These are the documented facts.
What the data does not confirm: a bottom, a reversal, or a minimum downside level. The analyst explicitly writes that “even if Bitcoin experiences further downside, a continued decline in exchange inflows from short-term holders at a loss could signal easing selling pressure.” The operative word is “could.” The metric to track — per the note — is the STH P&L to Exchanges figure. If it continues declining in subsequent sessions, the thesis of easing sell pressure gains weight. If it re-accelerates, the capitulation thesis is not complete.
The divergence between a new price low and a 70% drop in loss-realizing exchange inflows on November 9 is the signal CryptoQuant is watching. The STH-SOPR at 0.99 tells you short-term holders are underwater. The falling exchange inflow figure tells you they are increasingly choosing to absorb that loss rather than sell it. Whether that restraint holds — or breaks — is what determines whether the current price zone becomes a base or a waystation lower. Watch the STH P&L to Exchanges reading daily: a continued contraction toward and below 9,900 BTC strengthens the easing pressure case; a re-acceleration above 20,000 BTC would suggest the capitulation wave is not finished.
Source: x.comFrequently Asked Questions
What does an STH-SOPR reading below 1.0 mean for Bitcoin right now?
Why did exchange inflows from loss-sellers drop to 9,900 BTC on November 9 if price hit a new low?
Does falling exchange inflow from loss-sellers guarantee a Bitcoin price rebound?
What specific number should traders watch on the STH P&L to Exchanges indicator?
Source: CryptoQuant · Published by CoinsProbe Markets Desk
The opinions and market insights shared on CoinsProbe represent the views of individual authors based on prevailing market conditions at the time of publication. Cryptocurrency investments carry significant risk and volatility. Readers are encouraged to conduct their own research and seek professional financial advice before making investment decisions. CoinsProbe and its contributors do not accept responsibility for financial losses or decisions made based on published content.
CoinsProbe may publish sponsored articles, affiliate links, or promotional collaborations. All sponsored material is clearly labeled to maintain transparency with our audience. Our editorial decisions remain fully independent, and advertising partnerships do not influence reviews, rankings, or published opinions.
Since 2023, CoinsProbe has delivered reliable insights on cryptocurrency, blockchain, and digital assets. Our content is created by experienced researchers and analysts who follow strict editorial standards focused on accuracy, transparency, and credibility. Every article is carefully reviewed and verified using trusted sources and current market data. We provide unbiased analysis and timely updates covering everything from emerging crypto projects to major industry developments.