
- Bitcoin trades at $64,539 (-0.34% 24h), inside the $62K–$65K on-chain support zone flagged by CryptoQuant
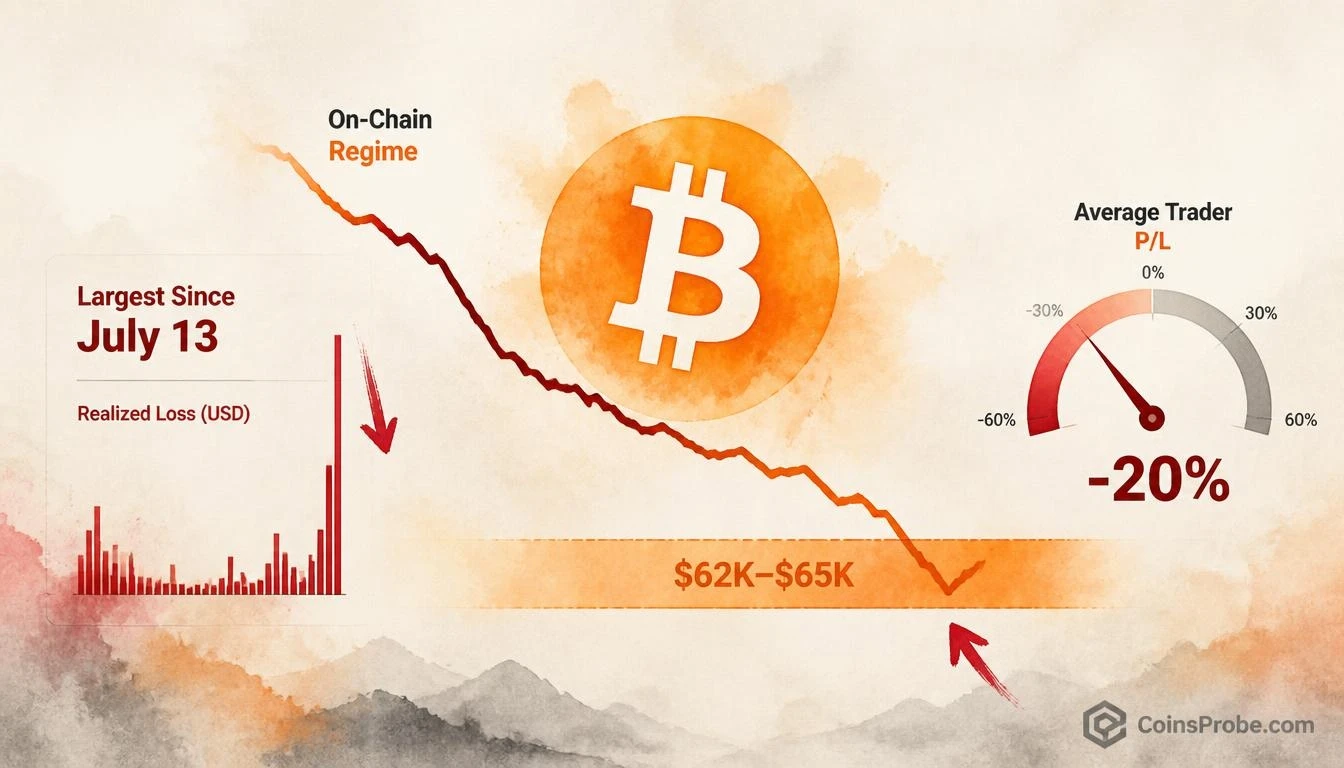
- Largest realized loss event since July 13, 2026 — average trader P/L at -20%, deepest since July per CryptoQuant
- CryptoQuant: bull-market corrections historically bottom near -12% P/L; bottoms of this type require ≥2 months to form
- $62,000 is the critical lower boundary — a sustained break below it deepens the bearish phase classification
Bitcoin is trading at approximately $64,539 — down 0.34% in the past 24 hours — as on-chain data confirms what price action has been telegraphing: the market has re-entered a bearish phase. The signal is not speculative. CryptoQuant’s latest report, titled “Bear Claw: Bitcoin Returns to a Bearish Phase,” delivers a direct, data-backed declaration that BTC has crossed back into negative territory on its key on-chain regime indicators.
CryptoQuant (@cryptoquant_com) published the alert on November 17, 2026, flagging three simultaneous developments: Bitcoin’s return to a bearish on-chain phase, the largest realized loss event recorded since July 13, and the activation of the $62,000–$65,000 support zone as the critical level now in play. At $64,539, Bitcoin is sitting at the lower boundary of that support band.
The Realized Loss Signal — Deepest Since July 13
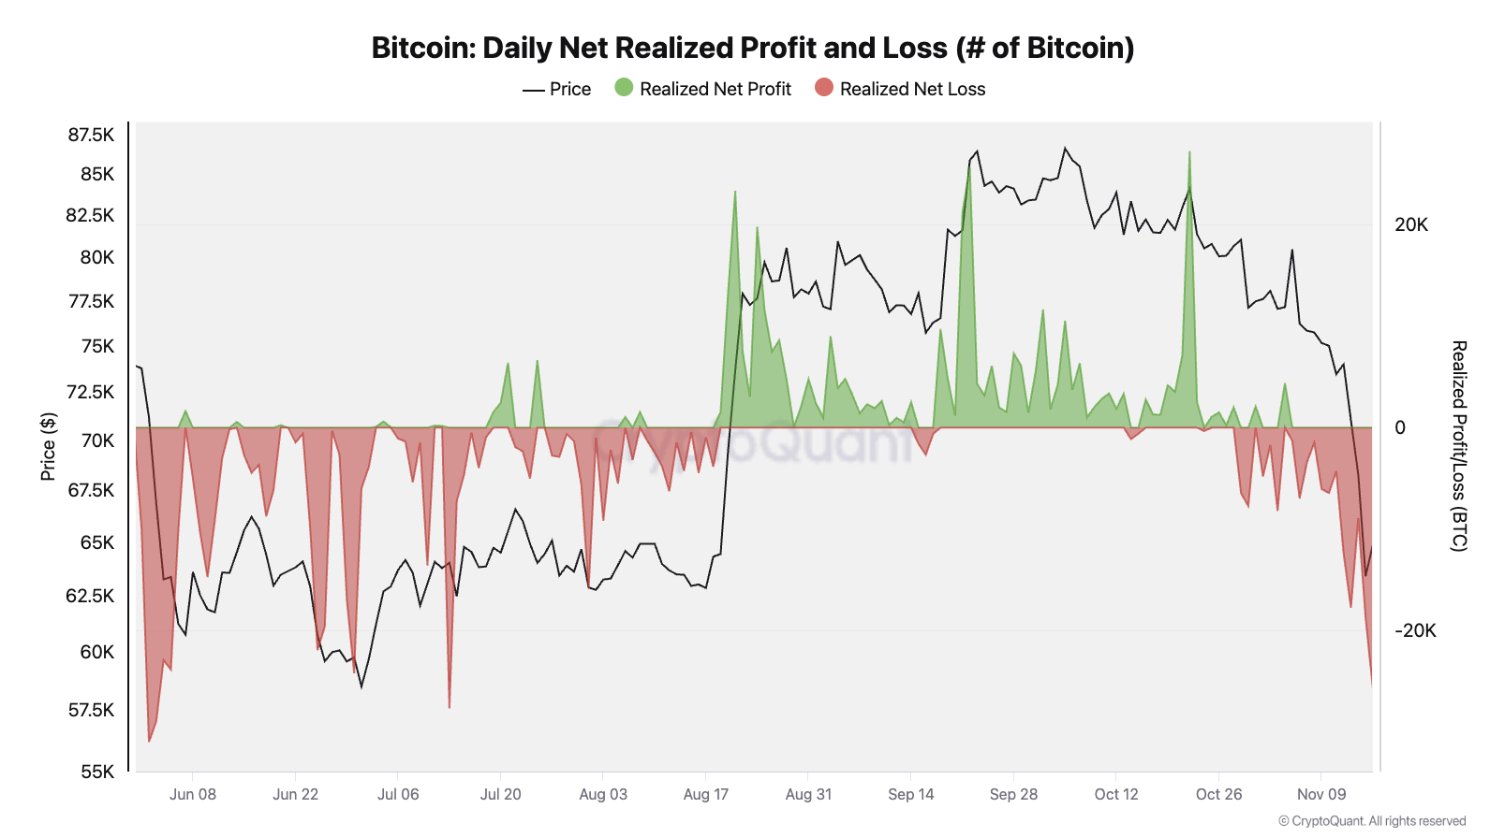
Realized loss measures the aggregate USD value lost by on-chain participants who moved coins at a price lower than their acquisition cost. When this figure spikes, it means a meaningful portion of market participants are selling at a loss — a classic signature of capitulation pressure, not a healthy correction. CryptoQuant’s data shows the current realized loss event is the largest since July 13, 2026 — the last time Bitcoin hit a significant on-chain stress point before its subsequent recovery. The comparison to July 13 is not incidental. That date marked the bottom of the prior corrective phase.
The parallel reading from CryptoQuant’s parent post adds critical context: the average trader profit and loss (P/L) has dropped to −20%, the deepest reading since July. Historical data from CryptoQuant shows that bull-market corrections typically find their floor near the −12% average trader P/L level. The current −20% reading represents an overshoot below that historical threshold — a condition that has historically preceded bottoming behavior, though CryptoQuant’s own analysis notes that bottoms of this type require at least two months to fully form. This is not a signal to expect an immediate V-shaped recovery. It is a signal that the market is absorbing significant pain. For prior context on demand-side conditions, see Bitcoin Demand Shows First Recovery Sign — But Remains Deeply Negative.
The $62,000–$65,000 Support Zone — What It Represents
CryptoQuant identifies the $62,000–$65,000 band as the support zone now actively in play. Bitcoin at $64,539 is not sitting above this zone looking down — it is inside it, testing it in real time. This zone is significant because it represents a concentration of on-chain cost basis for a large cohort of market participants. When price trades into a zone where many coins were acquired, those holders face a decision: hold, accumulate, or sell at a loss. The realized loss spike confirms the latter is happening — but the magnitude of that loss spike also creates the conditions for a potential exhaustion point.
The structure of the support zone matters: $62,000 is the lower boundary, and a sustained break below it would represent a material deterioration of the on-chain picture. $65,000 is the upper boundary — the level Bitcoin has already failed to hold, which is why CryptoQuant’s regime indicator has flipped bearish. The zone is now resistance-turned-support, which means the burden of proof is on buyers.
Bearish Phase — What the Regime Flip Means
CryptoQuant’s on-chain regime classification is not a sentiment indicator. It aggregates multiple hard data inputs — realized losses, profit/loss ratios, demand signals, and flow data — into a composite regime reading. A “bearish phase” classification means the weight of that data has shifted negative. This is the same analytical framework that CryptoQuant has used to call prior regime transitions throughout this cycle.
The significance of the July 13 reference point is structural. That date was the last time CryptoQuant’s realized loss data reached comparable severity. Bitcoin subsequently recovered from that stress event, but the recovery took time — consistent with CryptoQuant’s current observation that bottoms of this type require at least two months to fully develop. Traders watching for a repeat of July’s recovery pattern should not expect the same speed. The on-chain data says the pressure is real, and the resolution will not be instant.
CryptoQuant’s data on broader altcoin flows also reflects this stress: Binance Altcoin Netflow: AI and DeFi Tokens Seeing Exchange Outflows — a pattern consistent with a broader risk-off rotation that tends to accompany Bitcoin bearish phase signals.
The Level That Determines the Next Move
Everything in CryptoQuant’s analysis converges on a single question: does the $62,000–$65,000 support zone hold? If it does, the realized loss spike and the −20% average trader P/L overshoot become the ingredients of a classic capitulation bottom — painful in the short term, constructive over a two-month horizon. If the $62,000 lower boundary breaks on a sustained basis, the bearish phase classification deepens, and the next on-chain support structure becomes the operative level.
At $64,539, Bitcoin is not in freefall. It is in a well-defined on-chain stress zone, flagged by CryptoQuant in real time, with a regime indicator that has flipped bearish and a realized loss signal that matches the severity of the last major corrective low. That is the data. The resolution of the $62,000–$65,000 band is the trade.
Frequently Asked Questions
What does ‘largest realized loss since July 13’ mean for Bitcoin?
Why is the -20% average trader P/L significant right now?
What happens if Bitcoin breaks below $62,000?
How long do bearish phase bottoms typically take to resolve, according to CryptoQuant?
Source: CryptoQuant · Published by CoinsProbe Markets Desk
The opinions and market insights shared on CoinsProbe represent the views of individual authors based on prevailing market conditions at the time of publication. Cryptocurrency investments carry significant risk and volatility. Readers are encouraged to conduct their own research and seek professional financial advice before making investment decisions. CoinsProbe and its contributors do not accept responsibility for financial losses or decisions made based on published content.
CoinsProbe may publish sponsored articles, affiliate links, or promotional collaborations. All sponsored material is clearly labeled to maintain transparency with our audience. Our editorial decisions remain fully independent, and advertising partnerships do not influence reviews, rankings, or published opinions.
Since 2023, CoinsProbe has delivered reliable insights on cryptocurrency, blockchain, and digital assets. Our content is created by experienced researchers and analysts who follow strict editorial standards focused on accuracy, transparency, and credibility. Every article is carefully reviewed and verified using trusted sources and current market data. We provide unbiased analysis and timely updates covering everything from emerging crypto projects to major industry developments.