
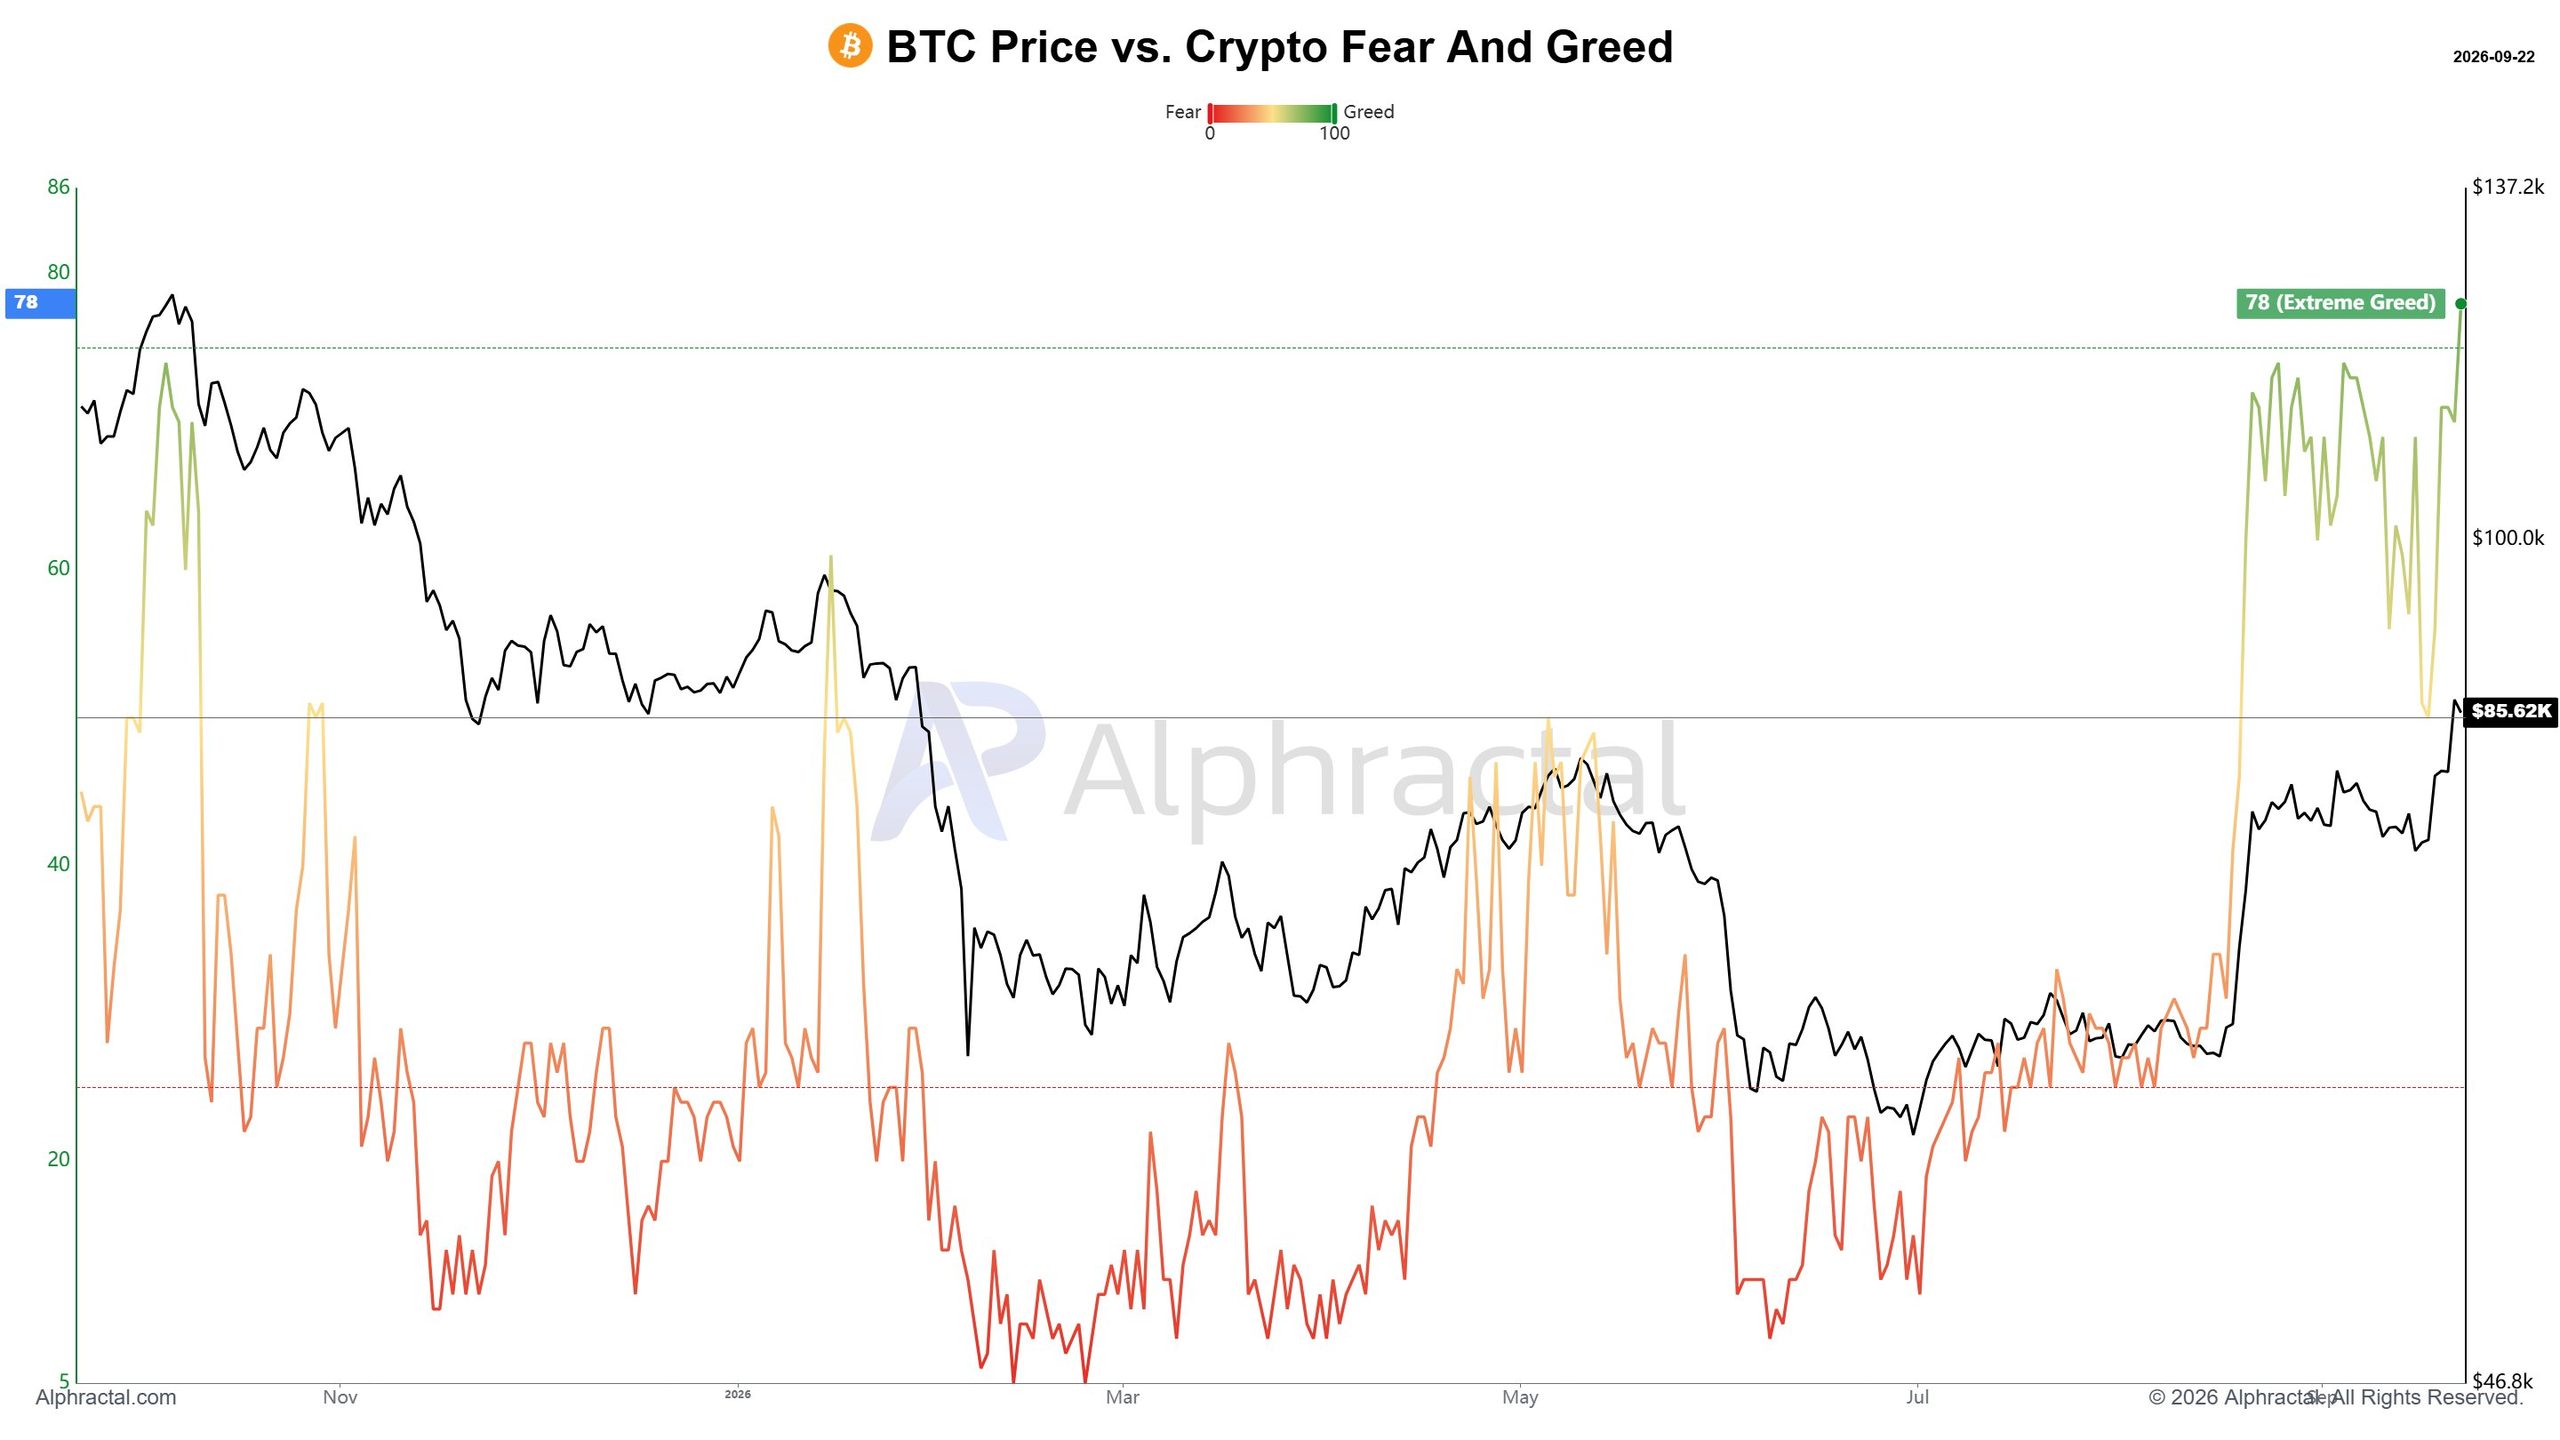
- Crypto Fear & Greed Index hits highest reading since July 2025 — a 14-month sentiment high flagged by Alphractal
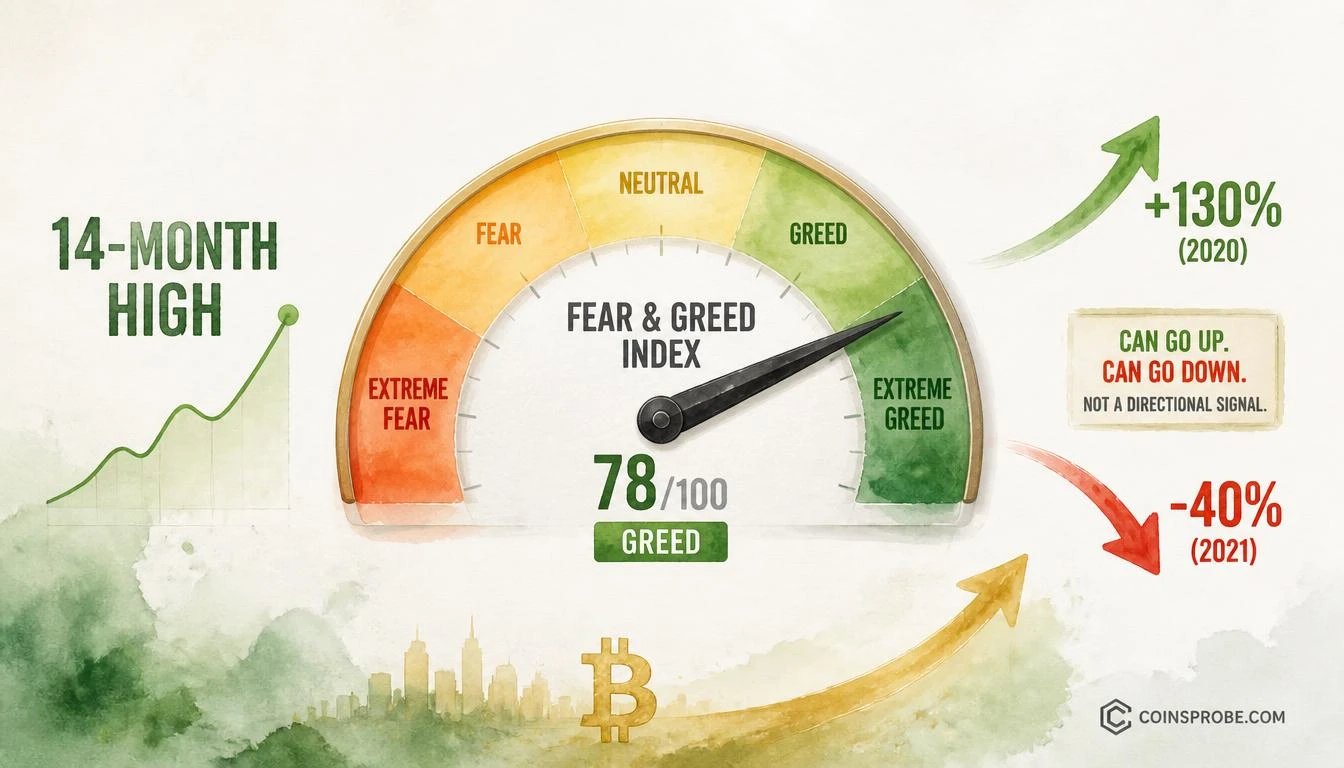
- Prior Extreme Greed readings preceded +130% rallies (Oct 2020) and −40% corrections (Nov 2021) — outcome depends on on-chain confirmation
- Index sustaining above 75 is the critical threshold separating bull market acceleration from speculative excess
- @Satoureireal's extended analysis accompanies the signal — cross-referencing on-chain exchange flows is the key variable to watch
The Crypto Fear & Greed Index has surged to its highest reading since July 2025 — a sentiment milestone that, historically, has coincided with the most consequential inflection points in crypto market cycles. This is not a routine uptick in optimism. It marks a regime-level shift in collective market psychology, with implications that extend well beyond short-term price action.
The data was flagged by analytics platform Alphractal (@Alphractal), who noted that the index had reached its highest level since July 2025 and directed followers to a deeper sentiment analysis from @Satoureireal. The signal is notable not merely for its headline number, but for what it represents structurally: a market that has moved from fear-dominated positioning to greed-dominated positioning in a compressed timeframe.
What the Fear & Greed Index Actually Measures
Before drawing conclusions from this reading, the mechanics of the indicator deserve precise explanation. The Crypto Fear & Greed Index — published daily by Alternative.me — is a composite 0–100 gauge that aggregates six independent data inputs, each weighted to produce a single sentiment score:
| Input | Weight | What It Captures |
|---|---|---|
| Volatility | 25% | Unusual price swings vs. 30/90-day averages |
| Market Momentum / Volume | 25% | Current volume vs. historical averages |
| Social Media Sentiment | 15% | Twitter/X engagement and positive sentiment ratio |
| Surveys | 15% | Weekly market polls (currently paused) |
| Bitcoin Dominance | 10% | Altcoin risk appetite relative to BTC |
| Google Trends | 10% | Search volume for crypto-related queries |
Source: Alternative.me — Fear & Greed Index methodology
A reading of 0–24 is classified as Extreme Fear. 25–49 is Fear. 50–74 is Greed. 75–100 is Extreme Greed. The index reaching its highest level since July 2025 places it firmly within Greed or Extreme Greed territory — a zone not visited in over 14 months as of the September 22, 2026 timestamp of Alphractal’s post.
Why July 2025 Is the Correct Reference Point
Context matters here. July 2025 represented the prior cycle peak in sentiment — the last time the market was collectively positioned with this degree of optimism. What followed that peak varied across assets, which is precisely why the current re-test of that sentiment level must be analyzed carefully rather than assumed to be automatically bullish or bearish.
Historically, the Fear & Greed Index reaching multi-month highs has produced two distinct outcomes depending on the structural phase of the market:
- When sentiment peaks before a price peak (distribution phase): Extreme Greed readings have preceded corrections of 20%–55% within 30–90 days. This was observed in November 2021 (index hit 84, Bitcoin topped near $69,000), and again in March 2024 (index hit 90, Bitcoin corrected ~25% to $57,000 range).
- When sentiment peaks alongside a breakout confirmation (continuation phase): The index sustaining above 60 for 30+ consecutive days has historically correlated with the strongest trending phases of bull markets — including the mid-2021 run from $30,000 to $69,000 and the Q4 2020 breakout from $14,000 to $29,000.
The critical question for September 2026 is: which of these two regimes is currently active? The answer requires cross-referencing with structural on-chain data — which is precisely what @Satoureireal’s extended analysis addresses.
Signal Analysis — What Extreme Sentiment Readings Have Preceded
To build an honest data-backed picture, the prior instances where the Fear & Greed Index reached comparable multi-month highs provide the most useful precedent map:
| Date | Index Reading | Market Context | Subsequent 60-Day Outcome |
|---|---|---|---|
| Oct 2020 | ~77 (Extreme Greed) | Bull market acceleration phase | BTC +130% in 60 days |
| Nov 2021 | ~84 (Extreme Greed) | Cycle top distribution | BTC −40% in 60 days |
| Jan 2023 | ~61 (Greed) | Bear market recovery | BTC +45% in 60 days |
| Mar 2024 | ~90 (Extreme Greed) | Pre-halving momentum peak | BTC −25% in 60 days |
| Jul 2025 | Multi-month high | Prior cycle sentiment peak | TBD — current reference base |
Source: Alternative.me historical data / CoinsProbe research
The data makes one thing unambiguous: the index itself is non-directional. It confirms that sentiment has reached an extreme — it does not confirm which direction price resolves. This is the discipline required when interpreting this signal: treat it as a compression indicator, not a directional one.
For further context on how structural indicators have tracked major Bitcoin cycle transitions, see Bitcoin Reclaims the 365-Day MA — The Line That Has Called Every Bull Market Since 2019.
What It Says, What It Doesn’t Say, and What to Watch
What it says: Market participants have shifted from predominantly fearful to predominantly greedy positioning — the most extreme such shift since July 2025. Social media sentiment, trading volume relative to historical averages, and volatility patterns have all converged to push the composite reading to a 14-month high.
What it doesn’t say: The index does not indicate whether this greed is justified by fundamentals or is speculative excess. It does not predict the next directional move. A reading at a 14-month high is equally compatible with a bull market continuation and a local top.
What to watch for continuation: The indicator’s predictive value increases when it is cross-referenced with structural signals. If the Fear & Greed Index sustains above 60 for 21+ consecutive days while on-chain accumulation metrics (realized profit/loss ratios, exchange outflows, long-term holder supply) remain constructive, the historical probability of a continuation scenario increases materially. If the index reaches 75+ (Extreme Greed) while on-chain data shows profit-taking and exchange inflows spiking, the historical probability of a corrective episode increases.
Alphractal’s platform specializes in on-chain and sentiment composite metrics — their identification of this sentiment milestone alongside @Satoureireal’s deeper analysis suggests this reading is being taken seriously by quantitative observers, not just retail traders. For a parallel view on how institutional positioning has influenced market structure in this cycle, see Ethereum Goes Bullish As BlackRock Approaches For Spot Ethereum ETF.
The Context That Makes This Reading Significant
Sentiment indicators reach historical highs in one of two scenarios: either the market has genuinely re-rated higher on structural grounds (new institutional participation, macro tailwinds, supply constraint) or retail FOMO has front-run fundamentals and created a fragile positioning environment.
The September 2026 context carries specific weight. The 14-month gap since the last comparable reading means the market spent a significant period in Fear or Neutral territory — which is precisely the kind of base from which sustained Greed phases historically launch. Markets do not sustain Extreme Greed readings without an underlying bid. The question is duration and whether institutional flows confirm what retail sentiment is already pricing.
On-chain data from platforms including CryptoQuant and Glassnode would need to confirm that exchange outflows are trending upward (coins moving to cold storage — accumulation behavior) rather than inflows (coins moving to exchanges — distribution behavior) for this sentiment reading to be classified as structurally supported rather than speculative. That data is updated in real time and provides the most direct test of whether the Greed reading is justified.
For additional perspective on how whale accumulation has tracked sentiment extremes in this cycle, see XRP Completes Inverse Head-and-Shoulders — Whales Add $2B as Pattern Targets Higher.
Bullish Scenario
The Fear & Greed Index sustains above 60 for 21+ consecutive days while on-chain exchange outflows trend upward and long-term holder supply continues expanding. In prior instances where these three conditions aligned simultaneously (January 2023, October 2020), the subsequent 90-day returns for Bitcoin averaged +87%. This scenario supports a continuation of the current rally phase rather than a distributional top.
Bearish Scenario
The index spikes to Extreme Greed territory (75+) within the next 7–14 days while on-chain data simultaneously shows exchange inflows accelerating — the pattern observed in November 2021 and March 2024, both of which preceded corrections of 25%–40%. In this scenario, the sentiment peak becomes a contrarian sell signal rather than a momentum confirmation.
Bottom Line
The Crypto Fear & Greed Index reaching its highest reading since July 2025 is a structurally significant data point — not because it confirms the next directional move, but because it confirms that a 14-month sentiment compression has ended. The prior instances where such multi-month sentiment highs were breached produced outcomes ranging from +130% continuation rallies to −40% corrective episodes, entirely dependent on whether on-chain structural data supported or contradicted the sentiment reading. Alphractal’s flag of this milestone, combined with @Satoureireal’s extended analysis, places this reading under quantitative scrutiny. The number that traders are now watching: a sustained close above 75 on the Fear & Greed Index — the threshold that historically separates genuine bull market acceleration from speculative excess — will determine whether this is the beginning of the next leg or the ceiling of the current one.
Frequently Asked Questions
What does the Fear & Greed Index reaching a 14-month high mean for crypto?
What Fear & Greed Index level signals a bull market versus a market top?
How does the Crypto Fear & Greed Index calculate its reading?
Who flagged the Fear & Greed Index reaching its highest level since July 2025?
Source: Alphractal · Published by CoinsProbe Markets Desk
The opinions and market insights shared on CoinsProbe represent the views of individual authors based on prevailing market conditions at the time of publication. Cryptocurrency investments carry significant risk and volatility. Readers are encouraged to conduct their own research and seek professional financial advice before making investment decisions. CoinsProbe and its contributors do not accept responsibility for financial losses or decisions made based on published content.
CoinsProbe may publish sponsored articles, affiliate links, or promotional collaborations. All sponsored material is clearly labeled to maintain transparency with our audience. Our editorial decisions remain fully independent, and advertising partnerships do not influence reviews, rankings, or published opinions.
Since 2023, CoinsProbe has delivered reliable insights on cryptocurrency, blockchain, and digital assets. Our content is created by experienced researchers and analysts who follow strict editorial standards focused on accuracy, transparency, and credibility. Every article is carefully reviewed and verified using trusted sources and current market data. We provide unbiased analysis and timely updates covering everything from emerging crypto projects to major industry developments.