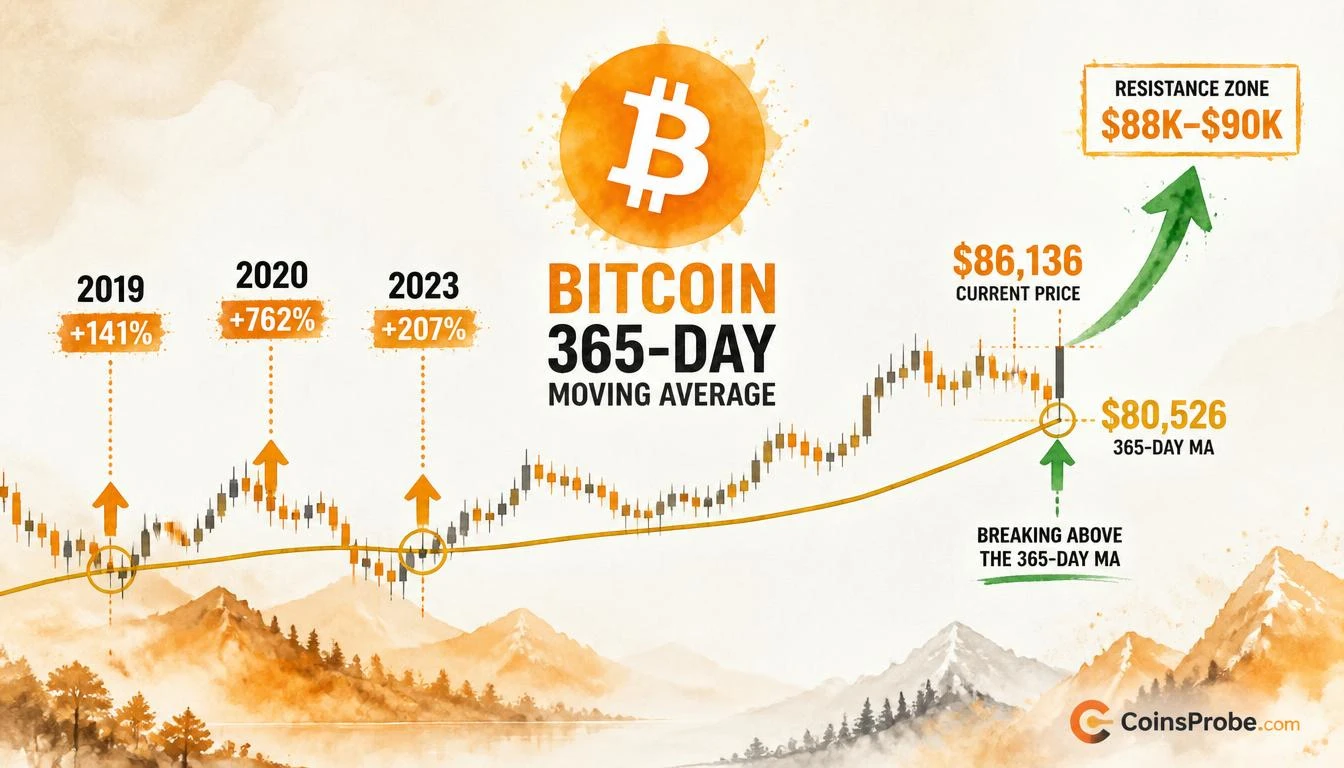

- Bitcoin trades at $86,136 (+0.32%) after closing above the 365-day MA ($80,526) for the first time since March 2023
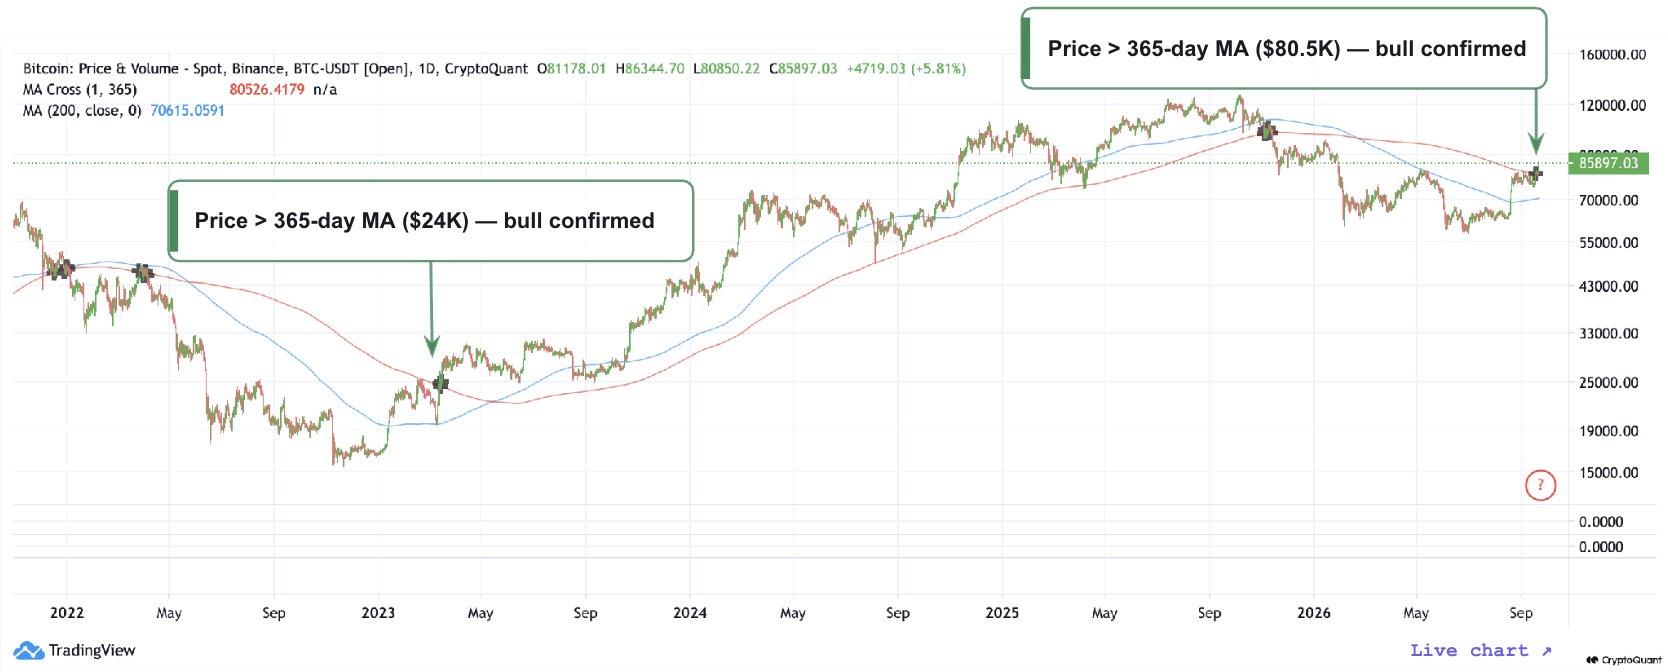
- CryptoQuant declares "Bull market: confirmed" — the 365-day MA has called every Bitcoin bull market since 2019
- March 2023 reclaim of the same signal at $24K preceded a +204% rally to $73,750 all-time high
- Immediate resistance: $88K–$90K
- Signal invalidation level: $80,526 (365-day MA)
Bitcoin is trading at $86,136 — up 0.32% in the past 24 hours — with a market capitalization of $1.73 trillion. One signal has just triggered that, historically, has marked the end of every Bitcoin bear market since 2019: a confirmed daily close above the 365-day moving average.
That confirmation was declared directly by CryptoQuant (@cryptoquant_com), one of the most cited on-chain data platforms in institutional crypto analysis. Their exact statement: “Bull market: confirmed. Bitcoin closed above its 365-day moving average for the first time since March 2023 — the line that has called every bull market since 2019.”
That is not a hedged observation. It is a declarative conclusion from a platform whose Bull Score and moving average signals are monitored by professional traders globally.
The 365-Day Moving Average — What It Actually Measures
The 365-day moving average is not a momentum oscillator. It does not measure sentiment. It measures the average closing price of Bitcoin across every single trading day of the past year — making it the most structurally significant trend filter available on the daily chart. When Bitcoin trades below this line, the asset’s present price is below what the average buyer paid over the past 12 months. When Bitcoin trades above it, the aggregate holder base is in profit and demand is structurally outpacing supply at the macro level.
This is why CryptoQuant describes it as “the line that has called every bull market since 2019.” It is not predictive by design — it is confirmatory. It tells you, with mathematical certainty, that the structure of price has shifted. The question is what has historically followed each confirmation.
Signal — 365-Day MA Reclaim: The Historical Track Record
The daily chart shared by @cryptoquant_com plots the Bitcoin spot price on Binance across the full 2022–2026 period, overlaying both the 365-day MA (currently at $80,526) and the 200-day MA (currently at $70,615). The chart explicitly marks two crossover events: the March 2023 reclaim at approximately $24,000 and the current reclaim at approximately $80,526. Both events follow extended bear market periods where price traded below the 365-day line for months.
The March 2023 instance is the cleanest precedent available. Bitcoin reclaimed the 365-day MA near $24,000 — at the time regarded with significant skepticism — and proceeded to rally to an all-time high above $73,000 in March 2024: a move of approximately +204% from the crossover level. Before that, the same crossover in early 2019 preceded a multi-month advance that ultimately peaked near $14,000 before the larger cycle continued. The signal has not produced a false positive in the period CryptoQuant has tracked it.
| Crossover Date | 365-Day MA Level | BTC Price at Signal | Subsequent Peak |
|---|---|---|---|
| Early 2019 | ~$5,800 | ~$5,800 | ~$14,000 (+141%) |
| Early 2020 | ~$8,000 | ~$8,000 | ~$69,000 (+762%) |
| March 2023 | ~$24,000 | ~$24,000 | ~$73,750 (+207%) |
| September 2026 | $80,526 | $86,136 | TBD |
Source: @cryptoquant_com (X) | CoinsProbe
Why This Reclaim Is Structurally Meaningful — Not Just a Number
The 365-day MA reclaim matters for three compounding reasons. First, it confirms that Bitcoin has sustained enough demand over a sufficient number of sessions to lift the 12-month average price — a process that cannot be manufactured by a single day’s volume spike or a short squeeze. Second, the 200-day MA at $70,615 now sits approximately 17.9% below current price, meaning there is a substantial structural support cushion beneath the current level. Third, the 365-day MA itself — now at $80,526 — becomes the first and most critical invalidation line for the signal. A daily close back below $80,526 would remove the confirmation entirely.
This is also the context in which Bitcoin’s broader market structure is evolving. The broader crypto market has seen major assets printing macro pattern completions, and Bitcoin’s 365-day reclaim acts as the foundational confirmation layer beneath those moves.
$88K–$90K — The Immediate Resistance Zone
CryptoQuant identifies $88,000–$90,000 as the next resistance cluster. This zone is approximately 2.2%–4.5% above the current price of $86,136 and represents the first meaningful supply concentration Bitcoin must absorb to sustain upside continuation. A clean daily close above $90,000 would remove this resistance entirely and open the path toward the prior all-time high zone and beyond.
The 24-hour trading volume of $45.99 billion confirms this is not a low-liquidity signal — institutional participation is present at the level where the crossover occurred. For context, this signal is unfolding while altcoins including Solana are forming their own bullish technical patterns, suggesting the 365-day MA reclaim in Bitcoin may be the macro catalyst underpinning broader market positioning.
What the Signal Says — And What It Doesn’t
What it says: Bitcoin’s daily price has sustained a close above its 365-day moving average ($80,526) for the first time since March 2023. Every prior instance of this signal since 2019 has been followed by a bull market phase, per CryptoQuant’s historical tracking.
What it doesn’t say: The magnitude of the coming move, the exact duration, or whether the current session closes above $88,000. The 365-day MA is a confirmatory signal — not a price target generator.
What to watch for continuation: A sustained daily close — not an intraday spike — above $90,000 would confirm absorption of the immediate resistance cluster and structurally extend the bull confirmation. A daily close back below $80,526 invalidates the signal entirely.
Bullish Scenario — Hold Above $80,526 and Break $90,000
If Bitcoin sustains the 365-day MA as support and achieves a daily close above $90,000, the immediate resistance cluster is cleared. Based on the 2023 precedent (+204% from crossover), a proportional advance from the current $80,526 crossover level projects a long-cycle target above $240,000 — though intermediate targets at prior all-time highs near $73,750 and the $100,000 psychological zone are the first measurable thresholds.
Bearish Scenario — Loss of $80,526
A confirmed daily close back below the 365-day MA at $80,526 would invalidate CryptoQuant’s bull confirmation. The next structural support is the 200-day MA at $70,615 — a level approximately 18% below current price. Loss of $80,526 on a daily close would revert Bitcoin to the same technical posture that preceded every prior bear market phase.
Bottom Line
Bitcoin has closed above its 365-day moving average — sitting at $80,526 — for the first time since March 2023. CryptoQuant, whose on-chain analytics are tracked by institutional desks globally, has issued a direct declaration: “Bull market: confirmed.” Every prior instance of this crossover since 2019 — in early 2019, early 2020, and March 2023 — was followed by a sustained bull market phase, with the March 2023 instance producing a +204% advance from the signal level to the March 2024 all-time high. The 200-day MA at $70,615 provides deep structural support, and the 365-day MA at $80,526 is now the sole invalidation line for this signal. Watch $90,000 on the upside as confirmation that immediate resistance has been absorbed — and watch $80,526 on the downside as the level whose loss ends the bull confirmation entirely.
Frequently Asked Questions
What does Bitcoin closing above the 365-day moving average mean?
When was the last time Bitcoin closed above the 365-day MA?
What is the next resistance level for Bitcoin after this signal?
What price level would invalidate Bitcoin’s bull market signal?
Has the 365-day MA ever produced a false bull market signal for Bitcoin?
Source: CryptoQuant · Published by CoinsProbe Markets Desk
The opinions and market insights shared on CoinsProbe represent the views of individual authors based on prevailing market conditions at the time of publication. Cryptocurrency investments carry significant risk and volatility. Readers are encouraged to conduct their own research and seek professional financial advice before making investment decisions. CoinsProbe and its contributors do not accept responsibility for financial losses or decisions made based on published content.
CoinsProbe may publish sponsored articles, affiliate links, or promotional collaborations. All sponsored material is clearly labeled to maintain transparency with our audience. Our editorial decisions remain fully independent, and advertising partnerships do not influence reviews, rankings, or published opinions.
Since 2023, CoinsProbe has delivered reliable insights on cryptocurrency, blockchain, and digital assets. Our content is created by experienced researchers and analysts who follow strict editorial standards focused on accuracy, transparency, and credibility. Every article is carefully reviewed and verified using trusted sources and current market data. We provide unbiased analysis and timely updates covering everything from emerging crypto projects to major industry developments.