- Bitcoin trades at $63,734 — within the $63,111–$64,373 on-chain demand zone holding 1.22M BTC in cost basis
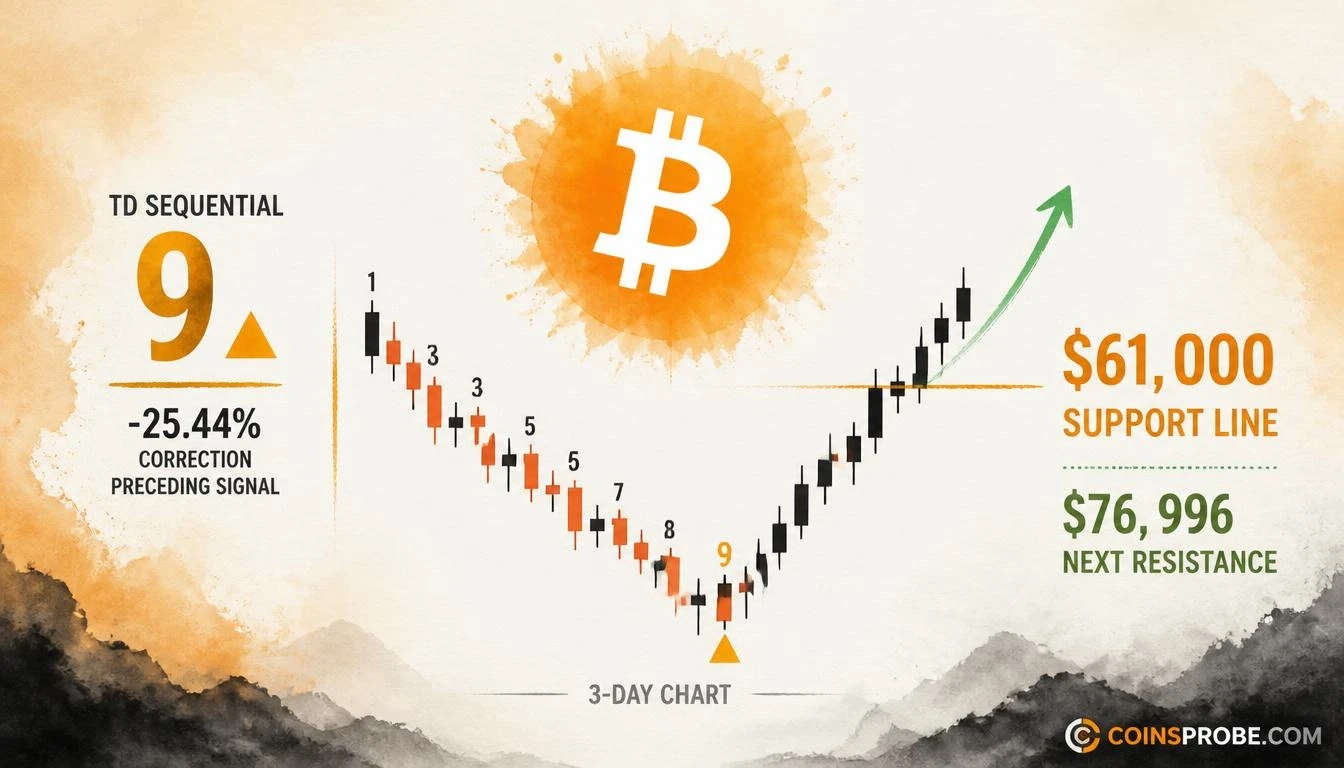
- TD Sequential prints 3-day buy signal — the same indicator flagged -6.21% and -25.44% corrections via prior sell signals
- $61,000 is the explicit setup support trendline — loss of this level invalidates the bullish thesis
- Spot Bitcoin ETFs saw -$306.4M in daily outflows and -$1.01B over five sessions per SoSoValue
Bitcoin is trading at $63,734 — down 0.62% in the past 24 hours — as a closely watched momentum exhaustion indicator prints its first bullish signal in this correction cycle. The Tom DeMark Sequential has just completed a “9” buy count on the 3-day chart, a signal that identifies trend exhaustion rather than a price level, and one that has historically preceded sharp short-term reversals.
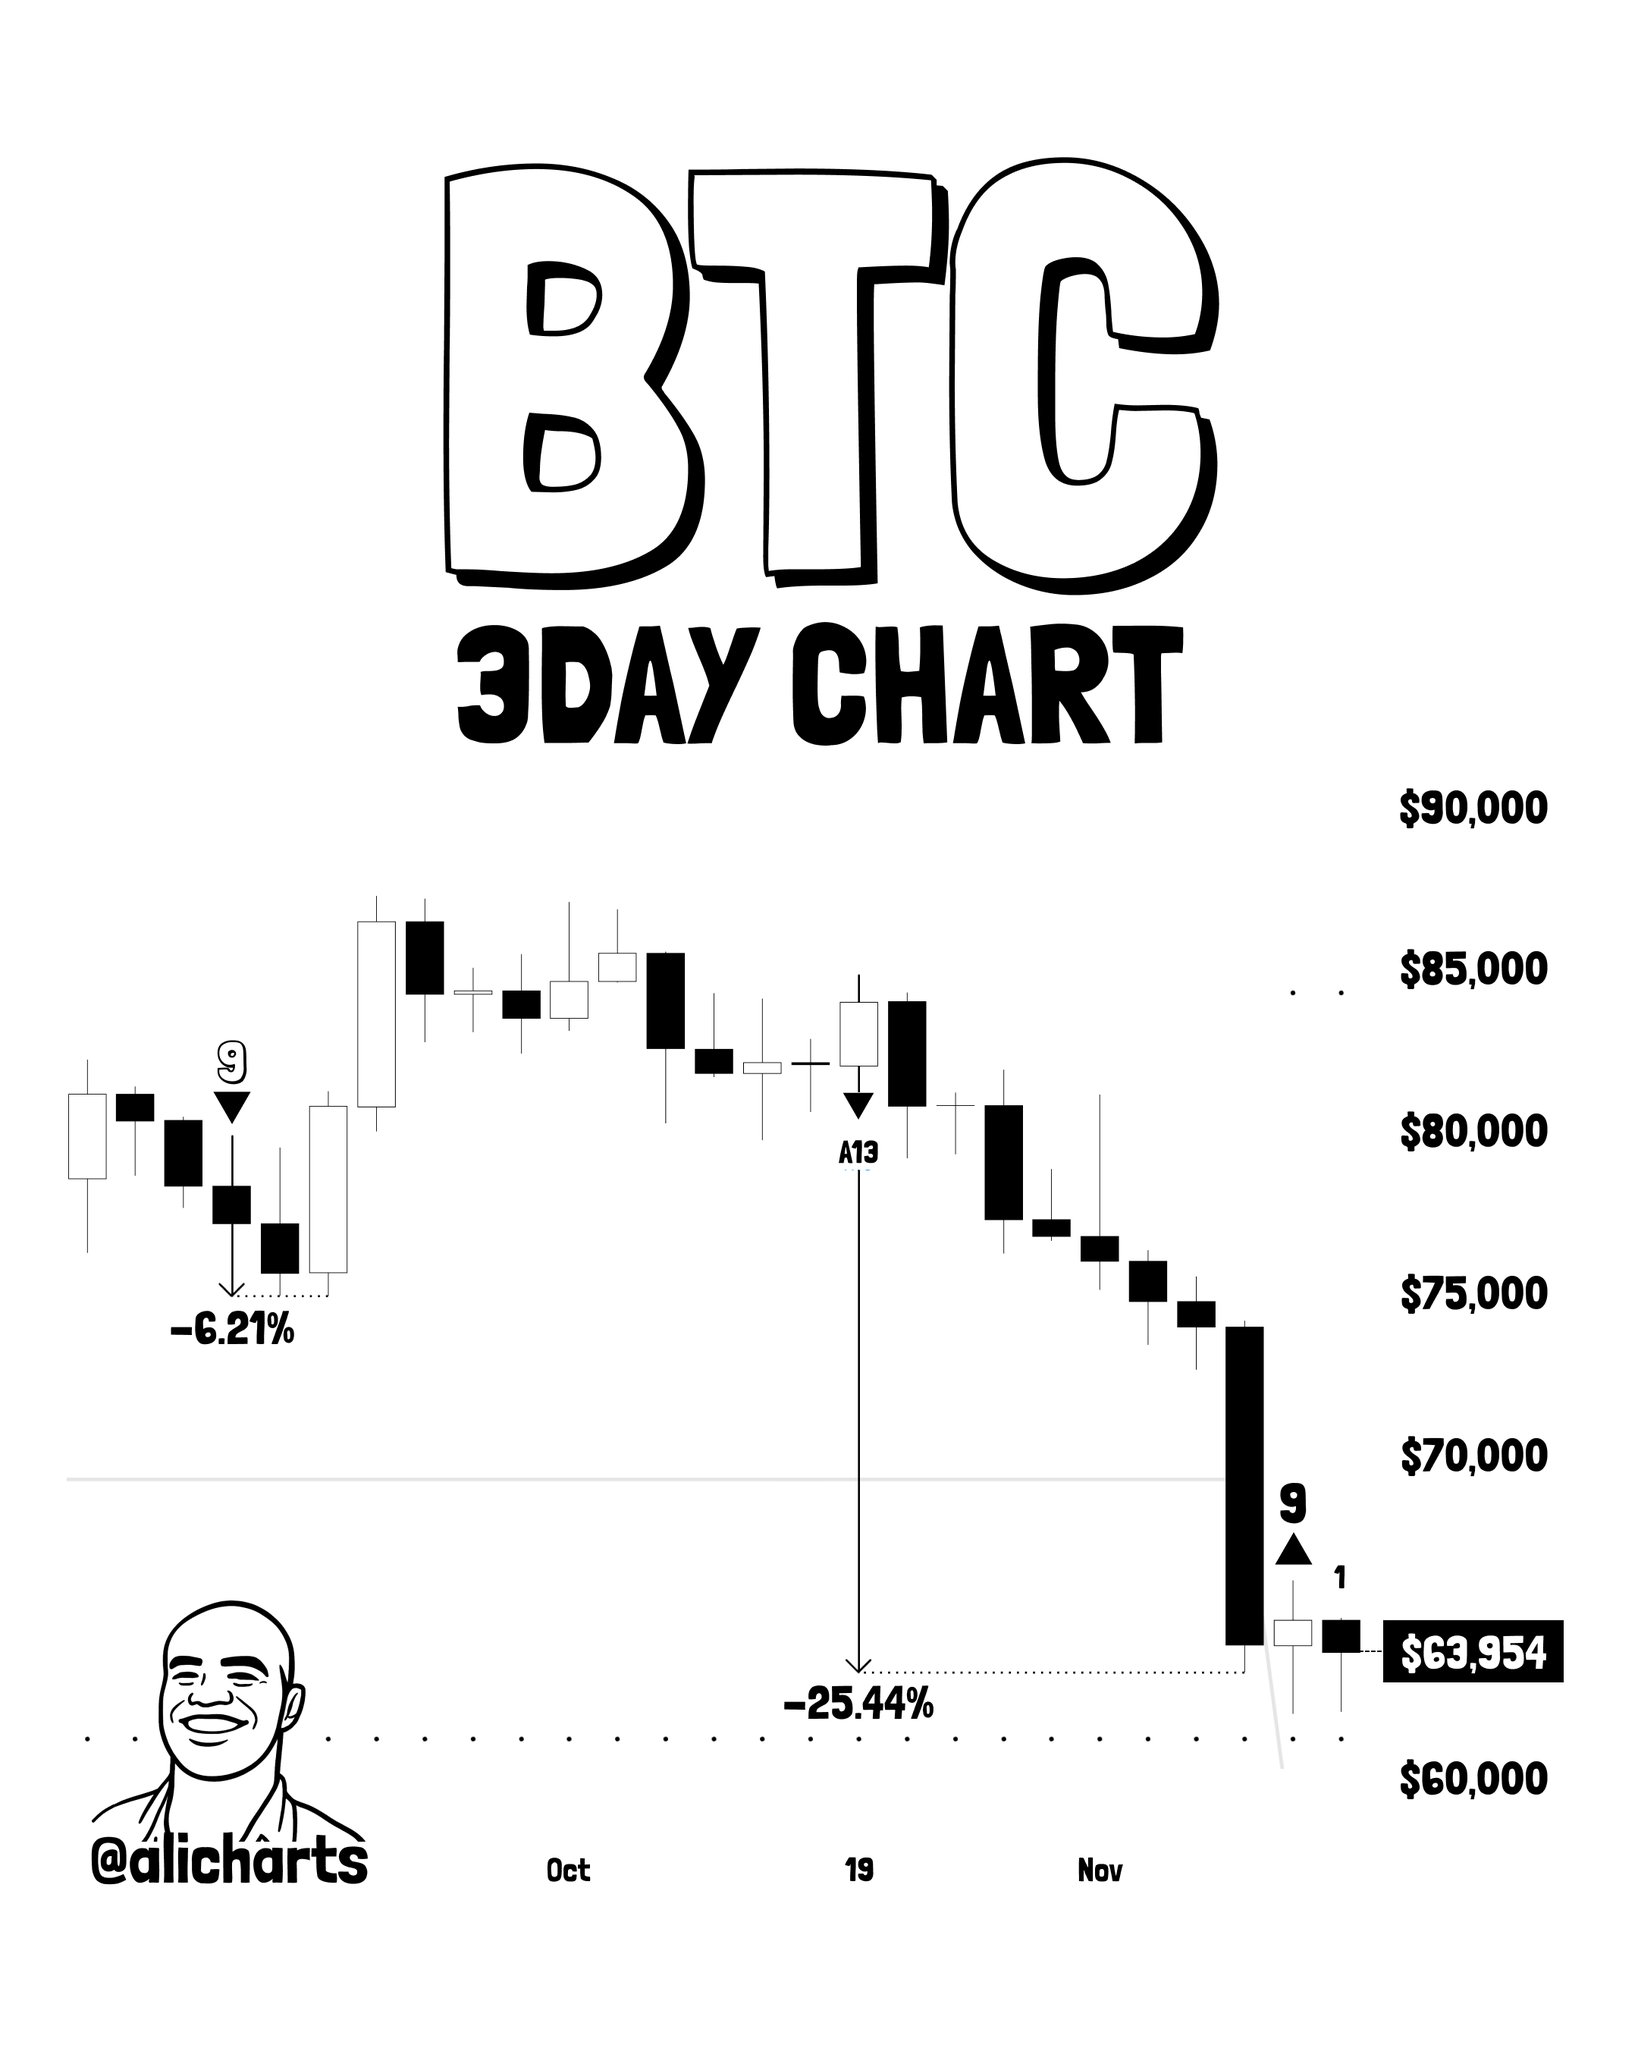
An analyst whose prior TD Sequential calls accurately flagged Bitcoin’s most recent sell signals — the -6.21% and -25.44% corrections that preceded this drop — has now identified a bullish counterpart. In their words: “The Tom DeMark Sequential has flashed a buy signal on Bitcoin’s 3-day chart, suggesting a rebound could be starting. As long as $BTC remains above the setup support trendline at $61,000, a spike in buying pressure could trigger a 1–4 candlestick rebound.”
What the TD Sequential Actually Measures
The TD Sequential is not a price-level indicator. It counts nine consecutive 3-day candle closes, each lower than the close four bars prior, to identify when a downtrend has statistically exhausted its momentum. When nine consecutive qualifying closes complete, the indicator prints a “9” with an upward triangle — not a prediction of direction, but a signal that selling pressure has historically run its course. The same logic works in reverse: the two bearish “9” sell signals this analyst flagged earlier this year preceded corrections of 6.21% and 25.44% respectively, establishing a documented track record on this specific timeframe.
The 3-day chart now shows a completed bullish “9” buy count followed by a “1” on the latest candle — meaning the indicator has reset and a new potential Sequential countdown has begun. What the signal says is that downward momentum is exhausted. What it does not say is how large the rebound will be, or whether it begins immediately.
The Setup: $61,000 Support Trendline Is the Condition
The analyst’s bullish thesis carries one explicit condition: Bitcoin must hold above the setup support trendline at $61,000. At $63,734 at time of writing, BTC sits approximately 4.3% above that level — not a wide buffer given the asset’s current volatility. A second reference point from the analyst’s prior on-chain work is also relevant here: a demand zone identified between $63,111 and $64,373, where on-chain data shows 1.22 million BTC changed hands — a concentration of cost-basis holders who represent natural demand. Bitcoin is currently trading within that exact zone. The analyst has also noted that above $76,996, there is little meaningful resistance — meaning any confirmed rebound faces a relatively open road until that level.
One important note flagged in the analyst’s reply thread: stop-loss placement below $60,900 carries specific risk due to record liquidation clusters sitting between $62,000 and $60,000. That range represents a high-density liquidation zone where cascading long exits could accelerate any break below $61,000 sharply. This is a risk context, not a prediction — but it matters for understanding why $61,000 is the specific line and not an approximation.
ETF Flows Add a Counterpoint
The technical signal arrives against a difficult institutional backdrop. Spot Bitcoin ETFs have recorded $306.4 million in net outflows on the latest trading date, with $1.01 billion in net outflows across the past five trading days — four of the five sessions were negative, data via SoSoValue. IBIT alone saw $148.7 million in outflows, with AUM sitting at $48.72 billion. FBTC and GBTC recorded $69.3 million and $20.3 million in outflows respectively.
Sustained ETF outflows at this scale represent genuine sell-side pressure from institutional accounts — not noise. That context matters: a TD Sequential buy signal identifies exhaustion of organic selling momentum, but it does not override structural institutional liquidation if that continues. For more on how demand signals interact with the current cycle, see Bitcoin Demand Collapses to -362,000 BTC as Miner Flows Surge 16-Fold.
Strategy (formerly MicroStrategy) continues to accumulate on the other side of this institutional selling: total holdings now stand at 850,849 BTC as of November 16, with a latest purchase of 485 BTC for $33.4 million and $180.8 million deployed across the past three weeks per SoSoValue data.
The Macro Overlay — FOMC Hike Risk Is Real
One forward-looking risk deserves direct mention. Market pricing currently assigns a 92.7% probability to a rate hike at the December 9 FOMC meeting, with the federal funds rate moving to 4.00%–4.25%. A second consecutive hike by January 27, 2027 is priced at 68.1% probability for the 4.25%–4.50% range per SoSoValue data. Rate hike cycles historically compress risk asset multiples — and a confirmed hiking path removes one of the macro tailwinds Bitcoin has historically relied on. Core PCE and GDP data due November 24 will update this picture materially. For context on how ETF positioning tracks this risk, see Where Every Spot Bitcoin ETF Sits vs. Its Average Buy Price.
Track Record on This Timeframe
The same analyst identified two bearish TD Sequential “9” sell signals on this same 3-day timeframe earlier this year. Both proved accurate: the first preceded a 6.21% correction and the second a 25.44% correction. The current buy signal is structurally the mirror of those calls — a completed nine-count in the opposite direction, at a point where cumulative downside from recent highs now exceeds 25%. Whether the buy signal matches the sell signals’ accuracy will be determined by price action at and above $61,000 in the next one to four 3-day candles. Each 3-day candle represents 72 hours of price action, meaning the signal’s validity window spans roughly the next 4–12 days.
STH-SOPR dynamics add another layer of context to current market positioning — see Bitcoin STH-SOPR Falls Below 1.0 — What Declining Exchange Inflows Signal for the on-chain parallel to this technical setup.
What Happens at $61,000
A sustained close below $61,000 on the 3-day chart invalidates the buy signal’s bullish premise. The analyst explicitly frames $61,000 not as a support level in the conventional sense, but as the setup support trendline — the structural condition the Sequential count requires to remain valid. Loss of that level, particularly given the liquidation density between $62,000 and $60,000, could trigger accelerated downside rather than a gradual deterioration. No specific downside target is stated — but the density of that liquidation cluster makes the break zone high-consequence regardless of magnitude.
Conversely, holding $61,000 and generating a momentum expansion over the next one to four 3-day candles — with $76,996 identified as the first zone of meaningful resistance — would validate the signal’s core thesis: that the 25%-plus correction from prior highs has exhausted its selling pressure at this demand zone.
The TD Sequential has two completed sell signals and zero completed buy signals on this timeframe so far in this cycle. The buy signal is now on the board. Bitcoin at $63,734 sits 4.3% above the line that determines whether it counts for anything — watch $61,000 as the binary level.
Source: x.comFrequently Asked Questions
What is the TD Sequential buy signal on Bitcoin’s 3-day chart?
Why is $61,000 the critical level for this Bitcoin buy signal?
How long does the TD Sequential rebound window last on the 3-day chart?
Do Bitcoin ETF outflows affect the TD Sequential buy signal thesis?
Source: Ali Charts · Published by CoinsProbe Markets Desk
The opinions and market insights shared on CoinsProbe represent the views of individual authors based on prevailing market conditions at the time of publication. Cryptocurrency investments carry significant risk and volatility. Readers are encouraged to conduct their own research and seek professional financial advice before making investment decisions. CoinsProbe and its contributors do not accept responsibility for financial losses or decisions made based on published content.
CoinsProbe may publish sponsored articles, affiliate links, or promotional collaborations. All sponsored material is clearly labeled to maintain transparency with our audience. Our editorial decisions remain fully independent, and advertising partnerships do not influence reviews, rankings, or published opinions.
Since 2023, CoinsProbe has delivered reliable insights on cryptocurrency, blockchain, and digital assets. Our content is created by experienced researchers and analysts who follow strict editorial standards focused on accuracy, transparency, and credibility. Every article is carefully reviewed and verified using trusted sources and current market data. We provide unbiased analysis and timely updates covering everything from emerging crypto projects to major industry developments.