
- Bitcoin trades at $63,374 — down 1.81% in 24 hours — as SSR Oscillator reads 45.45 and continues declining
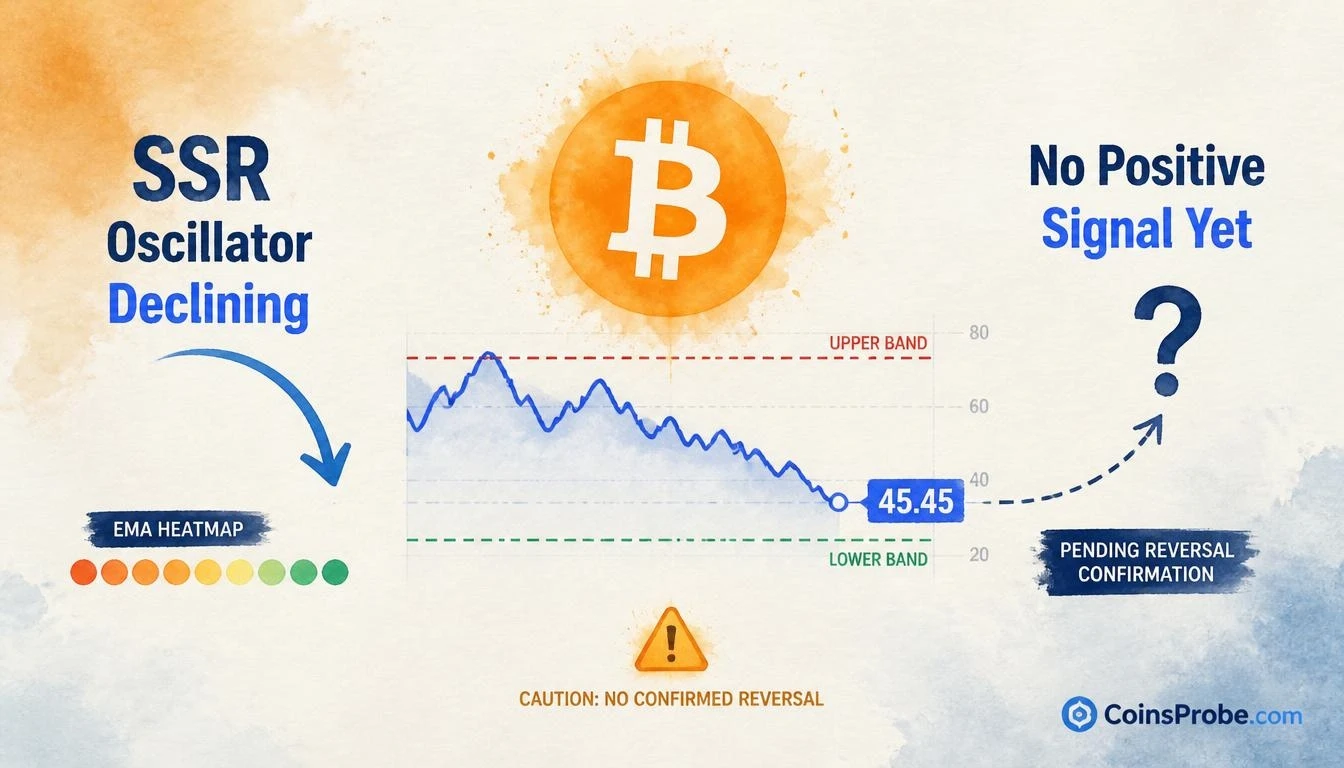
- Alphractal: SSR Oscillator has not yet confirmed a positive liquidity signal; stronger shift in stablecoin buying power may take more time
- Confirmed bullish signal requires oscillator to visibly reverse upward — no inflection has occurred at time of writing
Bitcoin is trading at approximately $63,374 — down 1.81% over the past 24 hours — with its market capitalization sitting at roughly $1.27 trillion. The price action arrives alongside a specific on-chain warning: the metric that measures stablecoin buying power relative to Bitcoin’s size is declining, and it has not yet produced the confirmation signal that has historically preceded sustained rallies.
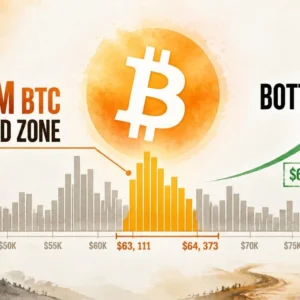
The observation comes from on-chain analytics platform Alphractal (@Alphractal), whose published analysis on November 18, 2026 states directly: “The Bitcoin Stablecoin Supply Ratio Oscillator is declining, but it has yet to confirm a positive signal. A stronger shift in liquidity conditions may still take time.” That is not a bullish call. It is a measured caution flag on the state of crypto-native liquidity — and it arrives at a price level that has drawn considerable attention from multiple on-chain frameworks. Bitcoin’s current zone near $63,111–$64,373 sits within a 1.22M BTC demand cluster tracked by on-chain cost-basis data, adding structural context to why the liquidity reading matters here.
What the Stablecoin Supply Ratio Oscillator Actually Measures
The Stablecoin Supply Ratio (SSR) compares Bitcoin’s market capitalization to the total supply of stablecoins circulating in the crypto ecosystem. The underlying logic is mechanical: when stablecoin supply is large relative to Bitcoin’s market cap, there is proportionally more dry powder available to flow into BTC. When Bitcoin’s market cap grows faster than stablecoin supply — or stablecoin supply contracts — that buying power ratio deteriorates.
The oscillator version of this metric normalizes those raw ratio readings against a moving average, producing a signal that oscillates above and below a central band. Readings in the upper zone (red/orange on Alphractal’s EMA heatmap, above the 60 threshold) have historically corresponded with periods when stablecoin liquidity was relatively thin compared to Bitcoin’s size — often late in bull cycles. Readings in the lower zone (blue, below 42) have historically indicated abundant stablecoin dry powder relative to BTC market cap — conditions that have preceded significant upside moves as that capital deployed.
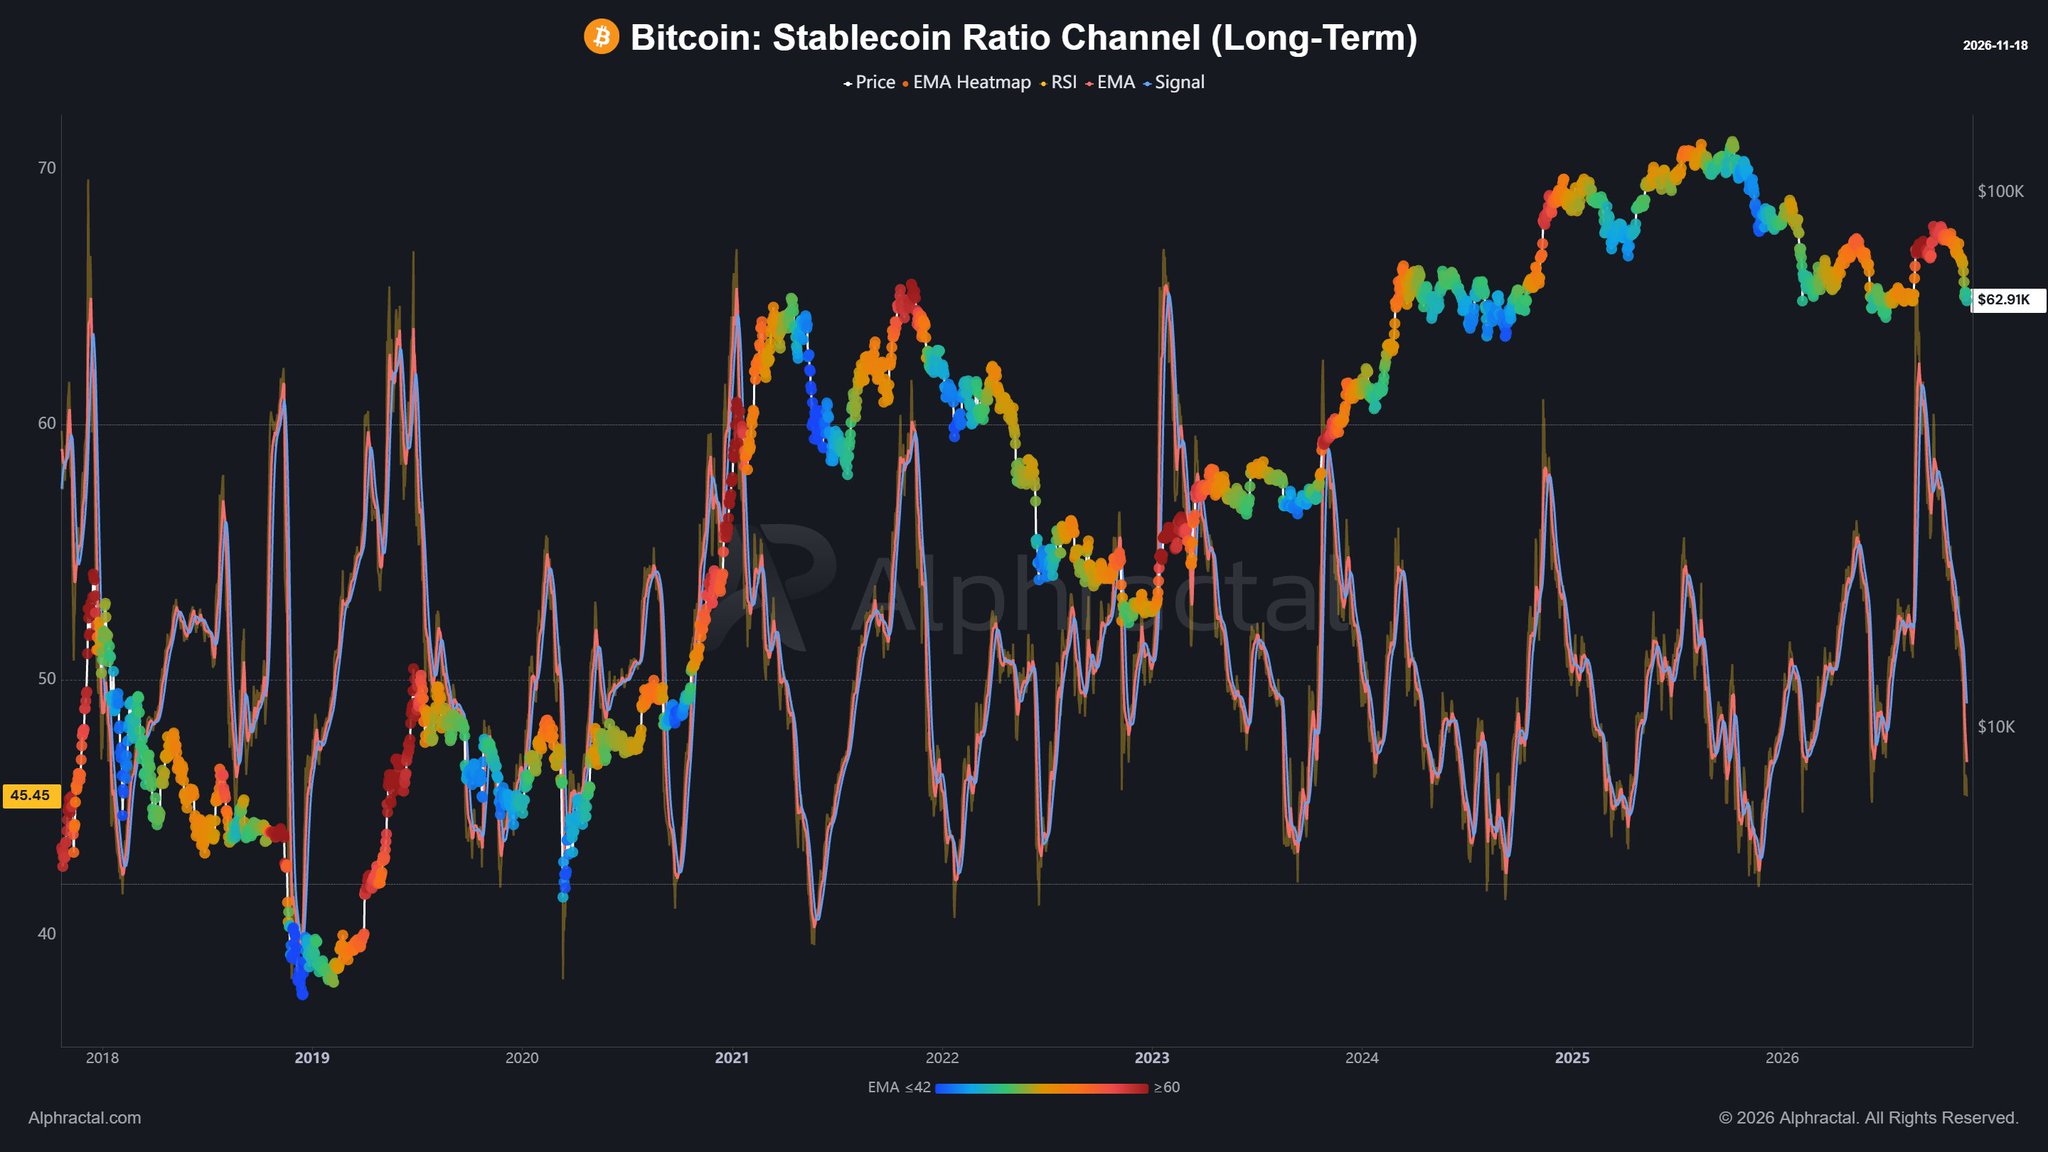
The current oscillator reading, as printed on Alphractal’s chart, is 45.45 — sitting in the mid-range of the band, below the elevated red/orange territory seen at recent highs, but not yet at the lower-band levels that would signal maximum stablecoin buying power availability. Critically, the oscillator’s trajectory is downward. It has pulled back from elevated levels, which might initially appear constructive. But Alphractal’s analysis clarifies the nuance: a declining oscillator from elevated territory does not automatically constitute a bullish re-entry signal. A confirmed positive signal requires the oscillator to reverse and show a meaningful upward inflection — something that has not yet occurred.
What the Charts Show — Two Lenses on the Same Signal
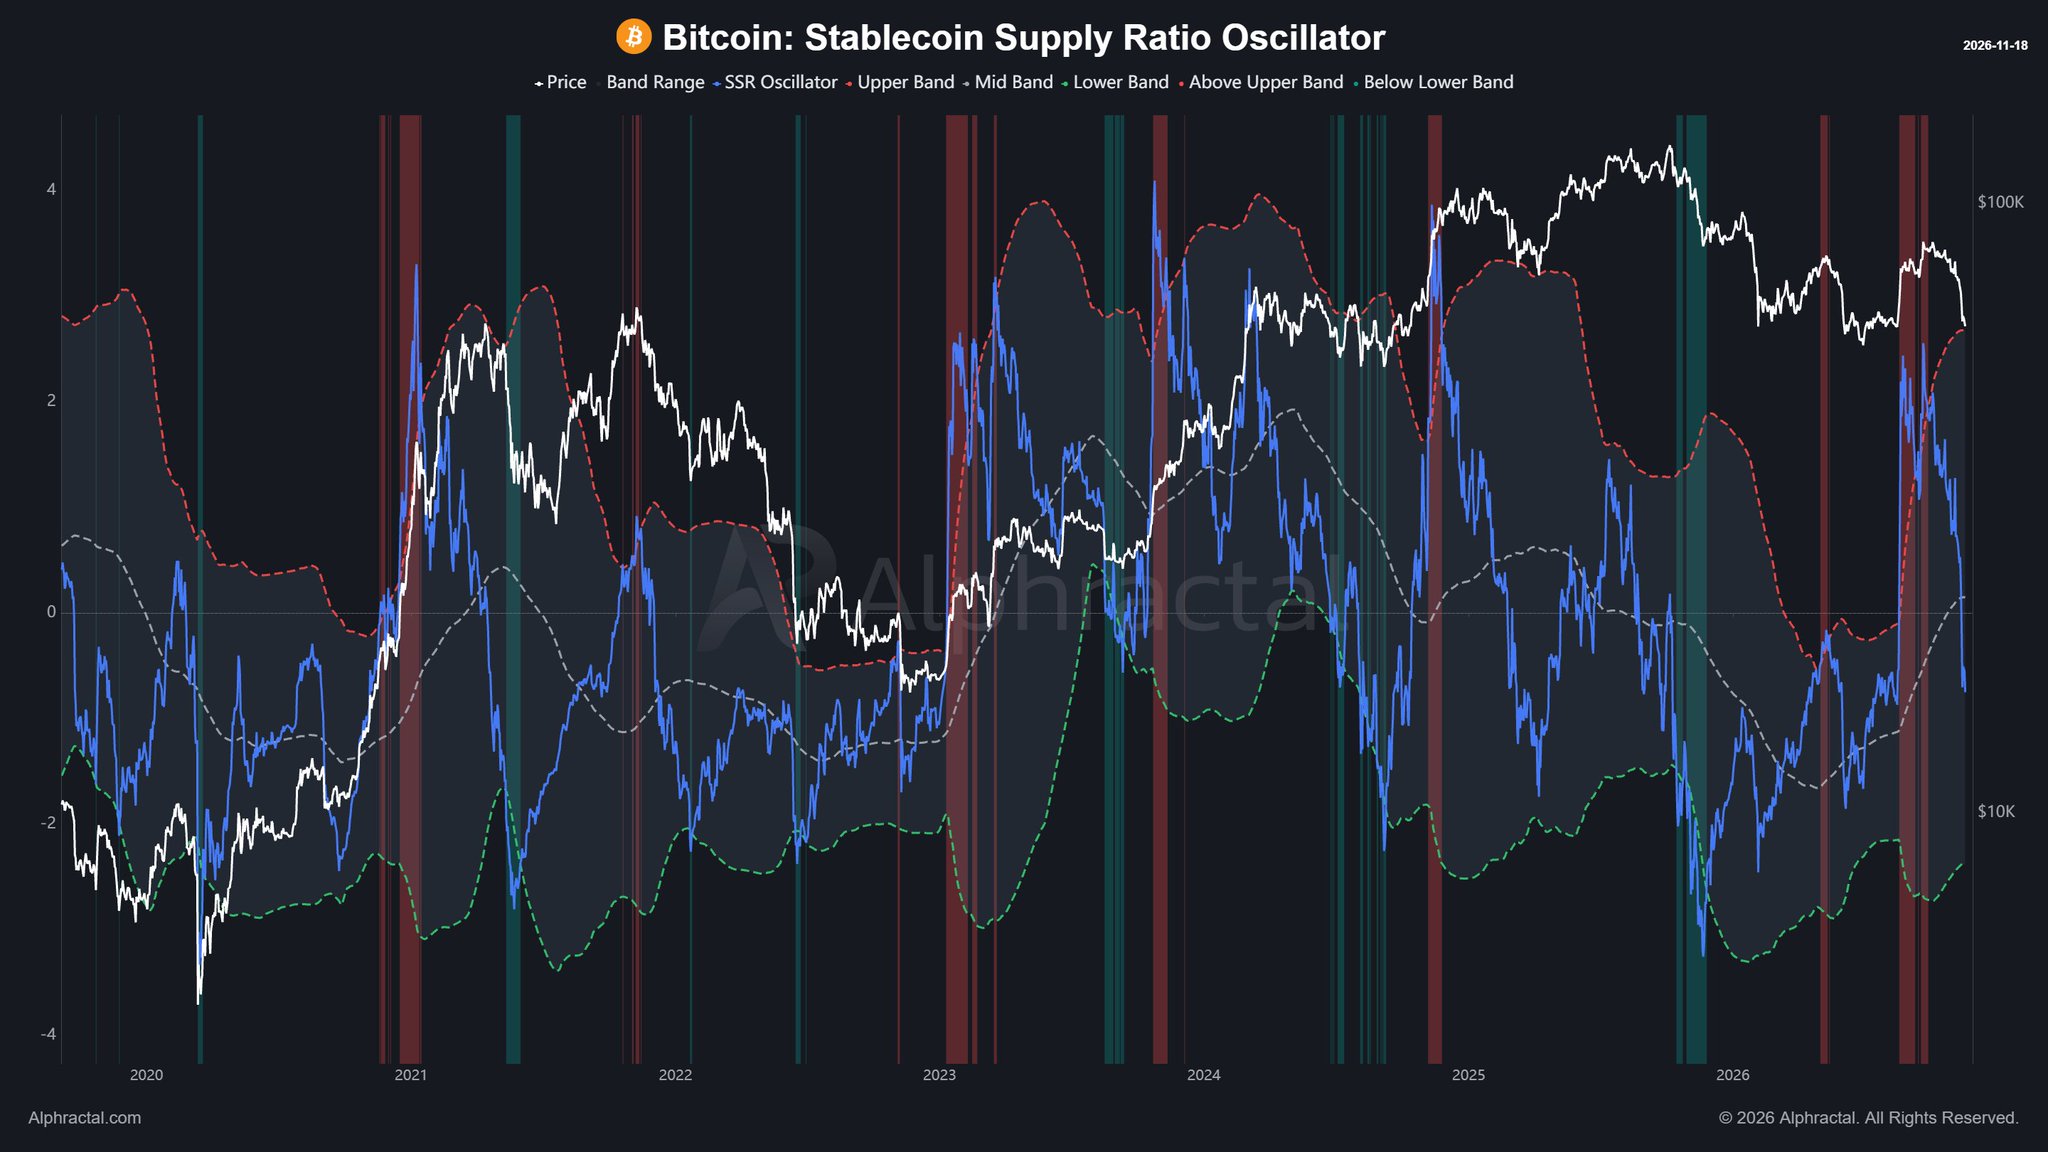
Alphractal published two charts alongside the analysis, both examining the SSR framework from different angles across overlapping multi-year periods.
The first chart applies an EMA heatmap coloring system to the oscillator dots — blue for cold/low readings (below 42), transitioning through green and into red for hot/elevated readings (above 60). The oscillator is currently near the 45.45 level printed on the chart, with dot coloration showing a cooling from prior red-orange territory. The price axis on the right runs from $10K at the lower end to $100K at the upper end, with Bitcoin’s current level marked at approximately $62.91K on the chart — consistent with current spot price. The pattern status is explicitly still forming: the cooling in the oscillator has not produced a confirmed bullish reversal.
The second chart presents the SSR Oscillator as a blue line plotted against a standard band structure with upper (red dashed), mid (grey dashed), and lower (green dashed) reference levels, with the oscillator scale running from -4 to +4. The blue line is on a declining trajectory from a recent peak, positioned below the upper band but above the mid-band. No breakout or breakdown is confirmed. The declining direction, without a reversal, is the signal Alphractal is flagging as requiring patience.
Why This Matters at $63,374
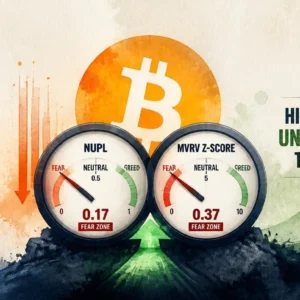
The timing of this liquidity caution is worth placing in context. Bitcoin’s broader on-chain picture has shown mixed signals in recent weeks. NUPL and MVRV Z-Score readings entered a fear zone signaling significant unrealized loss pressure in the market. Separately, whale balances rose to 3.02M BTC, raising questions about whether coins are changing hands at current levels. The SSR Oscillator now adds a third dimension: even if accumulation is occurring, the stablecoin-denominated buying power available to drive sustained price appreciation has not yet reached the conditions that typically precede major moves.
The mechanism is straightforward. Stablecoins represent the most direct on-ramp for new capital entering Bitcoin without going through fiat. When their supply is large relative to BTC’s market cap, the latent demand pool is deep. When that ratio deteriorates — as the declining oscillator suggests — the marginal buyer has proportionally less dry powder available. That does not preclude Bitcoin from rallying. It does mean a rally driven predominantly by leverage or existing BTC holders rotating would lack the stablecoin liquidity foundation that characterizes the most durable advances.
What a Confirmed Positive Signal Would Require
Alphractal’s analysis does not set a specific oscillator level as a trigger, but the framework is clear from the chart structure. A positive confirmation would require the SSR Oscillator to stop declining and produce a meaningful reversal — moving back upward toward the mid-band and beyond. On the second chart’s scale (ranging from -4 to +4), this means the blue line would need to visibly inflect upward from its current declining path, ideally with the EMA heatmap dots on the first chart shifting toward cooler coloration in the lower-oscillator zone (below 42) before the reversal occurs.
Alphractal’s language — “a stronger shift in liquidity conditions may still take time” — explicitly acknowledges that this process is not imminent. The word may preserves optionality, but the directional message is one of patience rather than urgency. The signal is not bearish. It is unconfirmed.
The SSR Oscillator at 45.45, declining from elevated territory, with no confirmed reversal — that is the current state of Bitcoin’s stablecoin liquidity picture. It is a framework that argues for watching whether the oscillator finds a floor and reverses before concluding that the next sustained liquidity-driven move has begun. Watch the SSR Oscillator’s inflection point as the confirmation level that separates a continued consolidation from a structurally supported advance.
Source: x.comFrequently Asked Questions
What is the Bitcoin Stablecoin Supply Ratio Oscillator and what does it measure?
Does a declining SSR Oscillator mean Bitcoin is about to drop?
What specific level or condition would confirm a bullish SSR signal for Bitcoin?
How does stablecoin supply affect Bitcoin’s price trajectory?
Source: Alphractal · Published by CoinsProbe Markets Desk
The opinions and market insights shared on CoinsProbe represent the views of individual authors based on prevailing market conditions at the time of publication. Cryptocurrency investments carry significant risk and volatility. Readers are encouraged to conduct their own research and seek professional financial advice before making investment decisions. CoinsProbe and its contributors do not accept responsibility for financial losses or decisions made based on published content.
CoinsProbe may publish sponsored articles, affiliate links, or promotional collaborations. All sponsored material is clearly labeled to maintain transparency with our audience. Our editorial decisions remain fully independent, and advertising partnerships do not influence reviews, rankings, or published opinions.
Since 2023, CoinsProbe has delivered reliable insights on cryptocurrency, blockchain, and digital assets. Our content is created by experienced researchers and analysts who follow strict editorial standards focused on accuracy, transparency, and credibility. Every article is carefully reviewed and verified using trusted sources and current market data. We provide unbiased analysis and timely updates covering everything from emerging crypto projects to major industry developments.