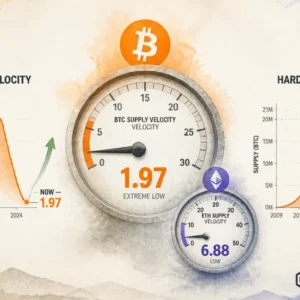


- BTC supply velocity hits 1.97 — lowest reading in over 10 years per Alphractal on-chain data
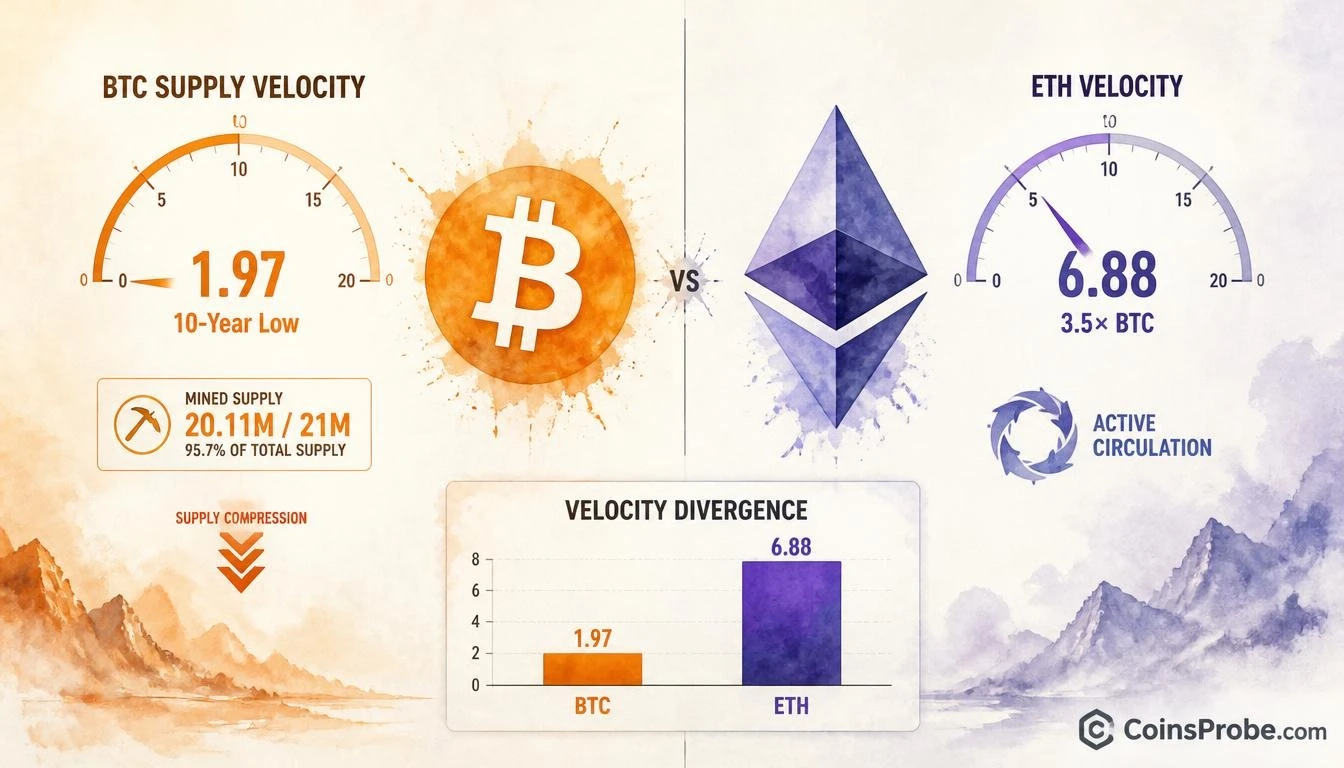
- Bitcoin has 20.11M of 21M coins mined (95.8% issued), with ETH total supply at 122.19M with no hard cap
- ETH velocity of 6.88 is 3.5× Bitcoin's, reflecting utility-driven circulation vs BTC's store-of-value compression
- Supply velocity is non-directional — a velocity acceleration above 2.5 on BTC is the signal to watch
Bitcoin’s supply is becoming progressively less mobile. With 20.11 million BTC already mined out of a hard-capped 21 million, on-chain data from Alphractal shows the asset’s supply velocity has dropped to 1.97 — the lowest reading in more than ten years. That is not a price signal. It is a structural observation about how Bitcoin behaves as it approaches full issuance: fewer coins circulating relative to total supply, programmed scarcity compressing in real time.
Analysts at Alphractal published a four-chart breakdown on November 7, 2026 contrasting Bitcoin and Ethereum across supply velocity, mined supply, and circulation metrics. The comparison surfaces a divergence that rarely gets quantified this precisely: BTC velocity at 1.97, ETH velocity at 6.88 — meaning Ethereum’s circulating supply turns over at roughly 3.5 times the rate of Bitcoin’s.
What Supply Velocity Actually Measures
Supply velocity is not a price indicator and it is not a demand indicator. It measures how frequently a network’s coin supply changes hands relative to total supply over a given period. A lower number means coins are moving less — held longer, transacted less, or locked in custody. A higher number means coins are circulating more actively across wallets and exchanges.
The distinction matters because supply velocity is frequently misread as a bullish or bearish signal in isolation. It is neither. A low velocity reading on Bitcoin means the existing supply is increasingly stationary — consistent with long-term holder behavior and reduced sell pressure, but not a direct signal of incoming demand. Alphractal’s data makes this explicit: supply velocity alone does not signal demand or price direction.
Signal 1 — Bitcoin: 1.97 Velocity, 20.11M Mined
At 1.97, Bitcoin’s supply velocity has not been this low in over a decade. The structural reason is straightforward: with 20.11 million BTC already issued, the network is 95.8% through its total issuance schedule. New supply entering circulation from mining is now a trickle — post-halving block rewards stand at 3.125 BTC per block — while long-term holders continue to absorb and hold coins off active circulation.
The combination of near-complete issuance and historically low velocity describes a supply side that is increasingly inelastic. When a fixed-supply asset approaches its hard cap and existing holders reduce turnover simultaneously, the available liquid supply contracts. This is the mechanical reality behind Bitcoin’s programmed scarcity argument — not a narrative, but a measurable on-chain condition now registering at decade-extreme levels.
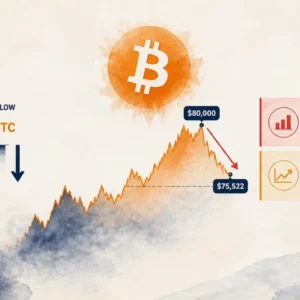
At the time of writing, Bitcoin is trading at approximately $96,200. For broader context on key levels across BTC, ETH, and XRP, see How Low Can BTC, ETH, and XRP Go? Key Levels to Watch Now.
Signal 2 — Ethereum: 6.88 Velocity, 122.19M Total Supply
Ethereum’s picture is structurally different. With a total supply of 122.19 million ETH and a velocity reading of 6.88, the network’s coins are turning over at 3.5 times the rate of Bitcoin’s. Unlike Bitcoin, Ethereum has no hard supply cap — total supply has shown gradual growth, with EIP-1559 burns partially offsetting new issuance but not eliminating net supply expansion in periods of lower network activity.
The higher velocity reading reflects Ethereum’s role as the settlement layer for DeFi, NFTs, and smart contract execution — activity that by definition requires coins to move. A network processing billions in daily DEX volume, lending, and derivative settlement will naturally register higher supply turnover than a network where coins sit in cold storage as a store of value. This is not a negative for Ethereum. It is a description of two assets performing structurally different economic functions.
The Divergence Table
| Metric | Bitcoin (BTC) | Ethereum (ETH) |
|---|---|---|
| Supply Velocity | 1.97 (10-year low) | 6.88 (~3.5× BTC) |
| Issued / Max Supply | 20.11M / 21M (95.8%) | 122.19M / No cap |
| Supply Trajectory | Approaching hard ceiling | Gradual growth |
| Primary Use Case Reflected | Store of value / Low turnover | Utility / High turnover |
Source: Alphractal on-chain data, November 7, 2026
What the Data Confirms — and What It Doesn’t
What it confirms: Bitcoin’s supply side is at a historically extreme compression point. With 20.11 million coins issued and velocity at a decade low, the structural argument for supply scarcity is now measurable, not theoretical. Ethereum operates a fundamentally different supply model, with higher circulation consistent with its role as a programmable settlement layer.
What it does not confirm: Neither reading is a price trigger. A velocity of 1.97 does not predict when demand will arrive or at what price level. A velocity of 6.88 for ETH does not indicate oversupply or bearish pressure — it indicates network utilization. These are supply-side observations. Demand-side confirmation requires separate on-chain signals entirely.
What to watch for supply-side shifts: Any acceleration in Bitcoin’s velocity from current levels — particularly a sustained move above 2.5 — would indicate long-term holders are moving coins that have been stationary for years. That would be the supply-side signal worth monitoring. For Ethereum, watch net issuance: if EIP-1559 burns consistently exceed new block rewards during high-activity periods, the supply trajectory changes materially.
Readers tracking altcoin momentum signals alongside these supply metrics may also find this analysis relevant: SUI SuperTrend Buy Signal Flashes — Last Time It Appeared, SUI Rallied 77.53%.
Why This Structural Divergence Matters in 2026
The BTC/ETH supply divergence is not new, but its magnitude at this point in Bitcoin’s issuance cycle is. When Bitcoin was at 18 million coins issued, the gap between the two assets’ velocity readings was narrower. At 20.11 million — with less than 900,000 BTC left to be mined over the next century — the inelasticity argument for Bitcoin’s supply side reaches its most defensible empirical footing.
Market participants often debate BTC versus ETH on the basis of narrative. The Alphractal data shifts that conversation to measurable on-chain structure. Bitcoin is not becoming scarce because analysts say so — it is registering the lowest supply velocity in ten years because 95.8% of its supply is already issued and existing holders are not moving it. That is the data. What the market does with that data is a separate question entirely.
For readers tracking cross-asset technical setups, Four Altcoins Flash TD Sequential Buy Signals — ENA, TAO, ATOM, VVV offers a complementary look at momentum signals across the broader altcoin market.
The supply velocity reading of 1.97 is the data point. The 20.11 million mined supply is the structural context. Watch for any sustained acceleration above 2.5 on BTC velocity as the supply-side signal that changes this picture.
Frequently Asked Questions
What does a Bitcoin supply velocity of 1.97 actually mean in practice?
Why is Ethereum’s supply velocity 3.5 times higher than Bitcoin’s if ETH also had deflationary burns via EIP-1559?
Does Bitcoin’s record-low supply velocity confirm a price rally is coming?
What specific on-chain change would signal that Bitcoin’s supply compression is ending?
Source: Alphractal · Published by CoinsProbe Markets Desk
The opinions and market insights shared on CoinsProbe represent the views of individual authors based on prevailing market conditions at the time of publication. Cryptocurrency investments carry significant risk and volatility. Readers are encouraged to conduct their own research and seek professional financial advice before making investment decisions. CoinsProbe and its contributors do not accept responsibility for financial losses or decisions made based on published content.
CoinsProbe may publish sponsored articles, affiliate links, or promotional collaborations. All sponsored material is clearly labeled to maintain transparency with our audience. Our editorial decisions remain fully independent, and advertising partnerships do not influence reviews, rankings, or published opinions.
Since 2023, CoinsProbe has delivered reliable insights on cryptocurrency, blockchain, and digital assets. Our content is created by experienced researchers and analysts who follow strict editorial standards focused on accuracy, transparency, and credibility. Every article is carefully reviewed and verified using trusted sources and current market data. We provide unbiased analysis and timely updates covering everything from emerging crypto projects to major industry developments.