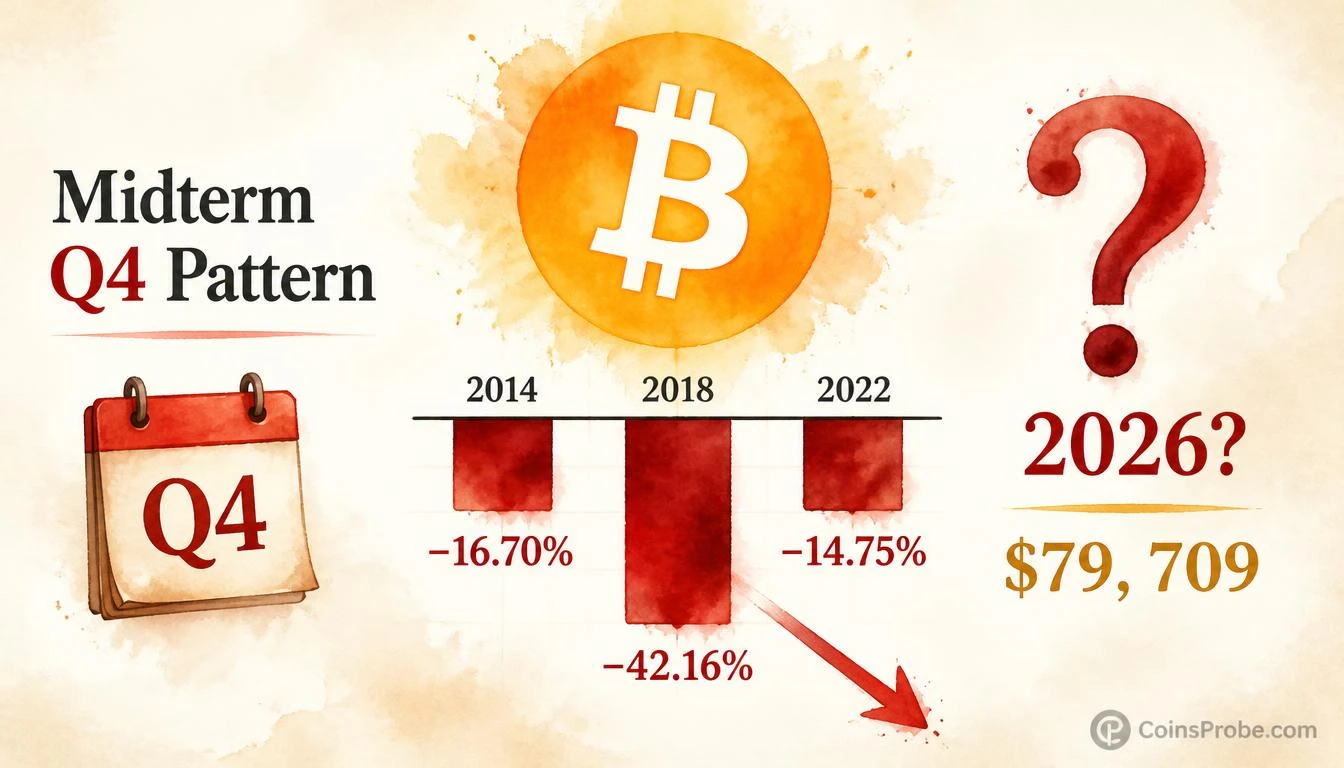
- Bitcoin is trading at $79,709 (−0.46% 24h) as analyst @alicharts flags a three-for-three negative Q4 pattern in U.S. midterm election years
- Historical Q4 returns in midterm years: 2014 (−16.70%), 2018 (−42.16%), 2022 (−14.75%) — all negative, per @alicharts
- Spot BTC ETFs recorded +$110.3M net inflow on Oct 26 (all from IBIT), but the 5-day trailing net remains −$111.5M per SoSoValue
- December 31 closing price will confirm or break the midterm Q4 pattern for the first time in three cycles
Bitcoin is trading at approximately $79,709 — down 0.46% in the past 24 hours and sitting below the $80,000 psychological threshold — as a historically significant seasonal pattern draws renewed attention. The asset has now declined in Q4 during each of the last three U.S. midterm election years without exception, and Q4 2026 is currently in progress.
Crypto analyst Ali Martinez (@alicharts), posting on October 26, 2026, flagged the pattern directly: “Q4 2026 COULD BE PAINFUL FOR BITCOIN. Bitcoin’s Q4 performance during recent U.S. midterm election years has been particularly interesting.” The post, which drew 12,500 views, lays out a three-instance track record that is difficult to dismiss as coincidence.
The Midterm Q4 Track Record — Three-for-Three Negative
The historical data Martinez presents is precise. In each U.S. midterm election year, Bitcoin has closed Q4 in the red:
| Year | Event | Q4 Return |
|---|---|---|
| 2014 | U.S. Midterm Elections | −16.70% |
| 2018 | U.S. Midterm Elections | −42.16% |
| 2022 | U.S. Midterm Elections | −14.75% |
Source: @alicharts (X), October 26, 2026
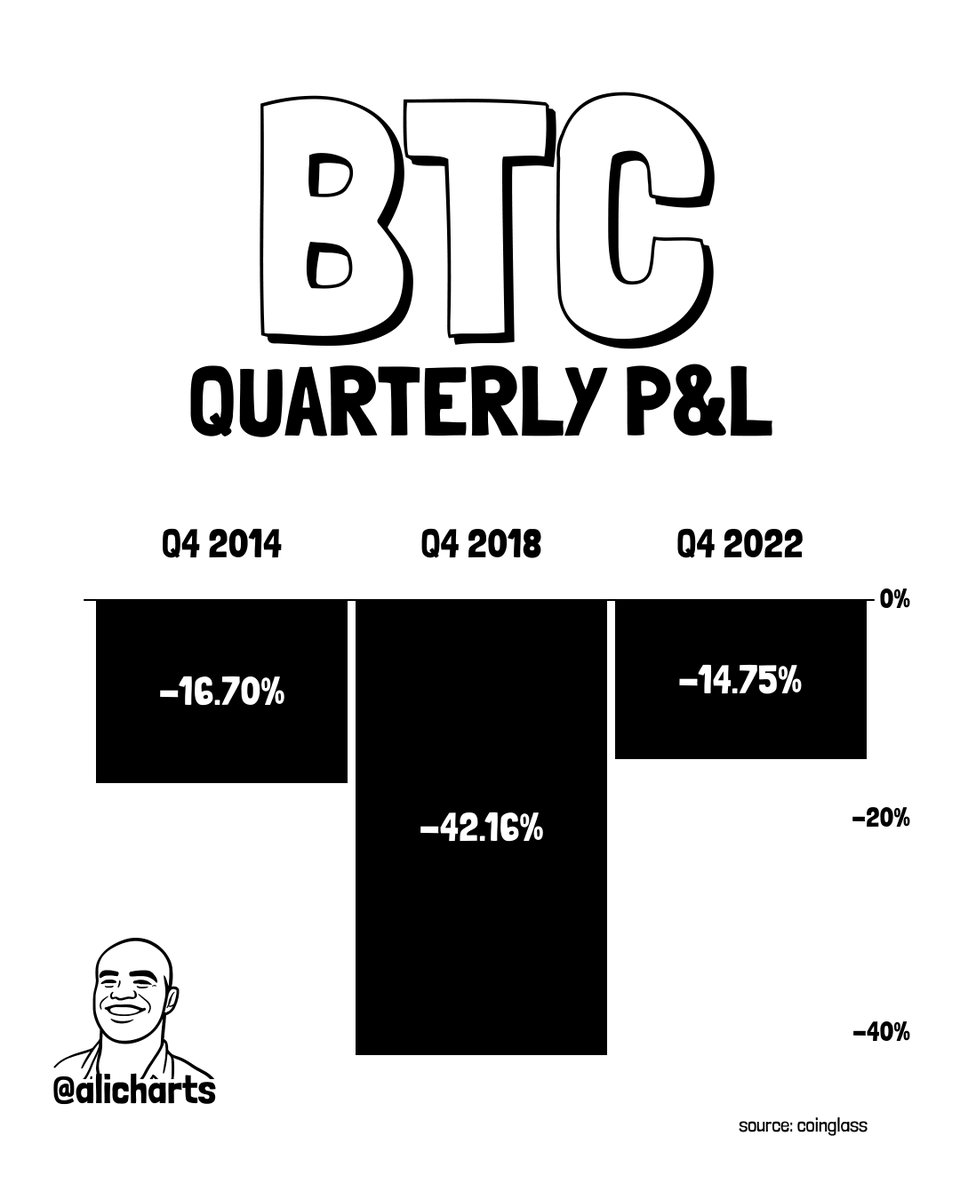
The severity has varied — 2018’s drawdown was nearly three times deeper than the other two instances — but the direction has been consistent. Q4 2014 and Q4 2022 produced comparable declines in the −14% to −17% range, while 2018 delivered a collapse of −42.16% that marked the bottom of that bear market cycle. The sample is small at three instances, but the pattern is unbroken.
Why Midterm Years Specifically?
Martinez does not offer a mechanistic explanation for why midterm election years produce negative Bitcoin Q4s, and the facts do not support inventing one. What the data does show is that in each instance, broader macro uncertainty — fiscal policy, Congressional composition, regulatory outlook — coincided with risk-asset weakness in the October-to-December window. Whether that correlation is causal or structural requires more instances than three to confirm. What Martinez is presenting is a pattern flag, not a rule.
The 2026 macro backdrop adds weight to the concern. The Federal Reserve’s next meeting on October 28 carries an 89.5% probability of holding rates in the 3.75%–4.00% range, per data via SoSoValue. For December’s FOMC meeting, markets now price a 73.9% probability of rates moving to the 4.00%–4.25% band — implying a potential rate hike is back on the table. That is not a benign environment for risk assets heading into Q4’s final two months. Core PCE and GDP data releases on October 28 will add further clarity.
Spot ETF Flows — Institutional Activity Amid the Pattern
Despite the historical caution Martinez flags, spot Bitcoin ETF flows on October 26 showed a single-day net inflow of +$110.3 million, driven entirely by BlackRock’s IBIT, which absorbed the full $110.3 million in new capital. FBTC and GBTC recorded zero net flows on the same day, per SoSoValue data. The five-day trailing net figure remains negative at −$111.5 million across three inflow days and two outflow days, suggesting institutional positioning is mixed rather than decisively directional. Total ETF net assets stand at $102.84 billion, with cumulative inflows since launch at $57.29 billion. For more context on recent ETF flow dynamics, see Bitcoin ETFs Bleed $169M in a Day but Post $267M Weekly Gain.
On the corporate treasury side, Strategy (formerly MicroStrategy) holds 848,517 BTC as of October 19, having added 267 BTC for $22.1 million in its most recent purchase. Over the past three weeks, the firm acquired 851 BTC for $72.8 million — a pace that reflects continued conviction from the largest corporate Bitcoin holder, even as the seasonal pattern raises a near-term caution flag.
What the Pattern Says — and What It Doesn’t
The midterm Q4 signal is a directional pattern flag, not a price target. Martinez does not state a downside level, an invalidation price, or a recovery timeline. Applying the historical average decline — which would mean something between −14% and −42% from wherever Q4 opened — to generate a forward projection is not supported by the source, and the range is too wide to be actionable on its own.
What the pattern does establish with precision: Bitcoin has never posted a positive Q4 return in a U.S. midterm election year across the three instances on record. That is the stated fact. Bitcoin is currently trading at $79,709, already down from higher levels, meaning some Q4 weakness may already be priced in. Whether the pattern completes — or whether 2026 breaks it — will be visible in the December 31 closing price.
With BTC having recently broken a key technical level, traders are watching the 200-day EMA near $76,000 as the next structural reference. For that specific technical setup, see Bitcoin Breaks Key Support — EMA200 Near $76K Now in Focus.
Bullish Scenario
Bitcoin reclaims and holds above $82,000 through November, breaking the midterm Q4 negative pattern for the first time. A monthly close above current levels with sustained ETF inflows — particularly IBIT flows exceeding $200M per day — would be the clearest evidence that 2026 diverges from the 2014/2018/2022 template.
Bearish Scenario
The midterm pattern holds. A continued drift toward the $76,000 EMA200 zone, combined with net ETF outflows over the next four to six weeks, would align with the −14% to −16% range seen in 2014 and 2022. The 2018 analog — a −42.16% Q4 — would imply a significantly deeper drawdown from Q4’s open.
Martinez’s three-instance track record is the most specific seasonal warning currently on the table for Bitcoin. Q4 2026 is in progress. The December 31 close will determine whether the pattern holds at four-for-four or breaks for the first time — and right now, nothing in the ETF flow data, corporate treasury activity, or macro rate environment conclusively argues the pattern is already broken. Watch the monthly close in December as the definitive answer.
Source: x.comFrequently Asked Questions
Has Bitcoin ever posted a positive Q4 return in a U.S. midterm election year?
What is the average Q4 decline in Bitcoin during midterm years?
Is the Bitcoin spot ETF flow data consistent with the midterm bearish pattern?
What macro events could accelerate or interrupt the Q4 2026 pattern?
Source: Ali Charts · Published by CoinsProbe Markets Desk
The opinions and market insights shared on CoinsProbe represent the views of individual authors based on prevailing market conditions at the time of publication. Cryptocurrency investments carry significant risk and volatility. Readers are encouraged to conduct their own research and seek professional financial advice before making investment decisions. CoinsProbe and its contributors do not accept responsibility for financial losses or decisions made based on published content.
CoinsProbe may publish sponsored articles, affiliate links, or promotional collaborations. All sponsored material is clearly labeled to maintain transparency with our audience. Our editorial decisions remain fully independent, and advertising partnerships do not influence reviews, rankings, or published opinions.
Since 2023, CoinsProbe has delivered reliable insights on cryptocurrency, blockchain, and digital assets. Our content is created by experienced researchers and analysts who follow strict editorial standards focused on accuracy, transparency, and credibility. Every article is carefully reviewed and verified using trusted sources and current market data. We provide unbiased analysis and timely updates covering everything from emerging crypto projects to major industry developments.