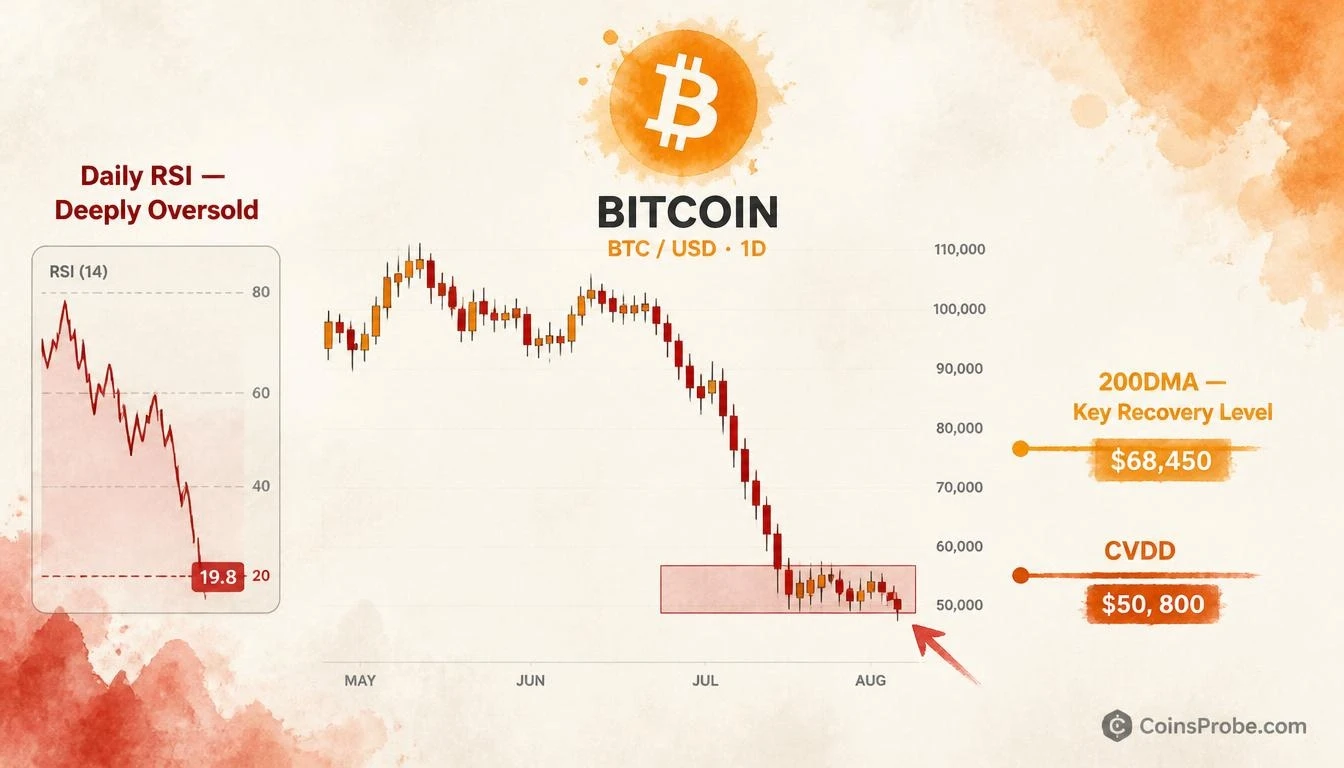
- Bitcoin trades at $64,052 (-1.71% 24h) after daily RSI hits deeply oversold — analyst flags 1–2 month consolidation ahead
- BTC has lost both the 200-Day and 200-Week Moving Averages; CVDD model level at $50,800 is back on the table as a downside reference
- Spot BTC ETFs logged 5 consecutive outflow days totaling $1.07B, led by IBIT's $143.5M single-day redemption
- Analyst condition for bulls: wait for a sustained close back above the 200-Day MA before positioning with conviction
Bitcoin is trading at $64,052 — down 1.71% in the past 24 hours — with its market capitalization sitting at approximately $1.29 trillion. The decline is not ordinary noise. Selling pressure has been severe enough to drive the daily RSI into deeply oversold territory, a condition that has historically preceded one to two months of consolidation before Bitcoin’s next major directional move.
An analyst who goes by the handle @CryptoBullet1 on X flags this setup directly: “Selling pressure was so heavy that RSI went deeply oversold on the daily. After such sell-offs $BTC usually consolidates for a month or two before the next major move. 200DMA is key.” The analyst also confirms that Bitcoin has now lost the 200-Week Moving Average — and with that breach, the Cumulative Value Days Destroyed (CVDD) model level at $50,800 is back in play as a structural reference point for bulls watching a worst-case floor.
Signal 1 — Daily RSI Deeply Oversold After Heavy Selling
The Relative Strength Index (RSI) measures the speed and magnitude of price changes on a 0–100 scale. Readings below 30 are conventionally considered oversold — meaning selling momentum has reached an extreme that has historically been difficult to sustain. Bitcoin’s daily RSI has not merely touched oversold territory; the analyst characterizes the depth as extreme, consistent with the kind of capitulation-style selling seen at prior major cycle lows.
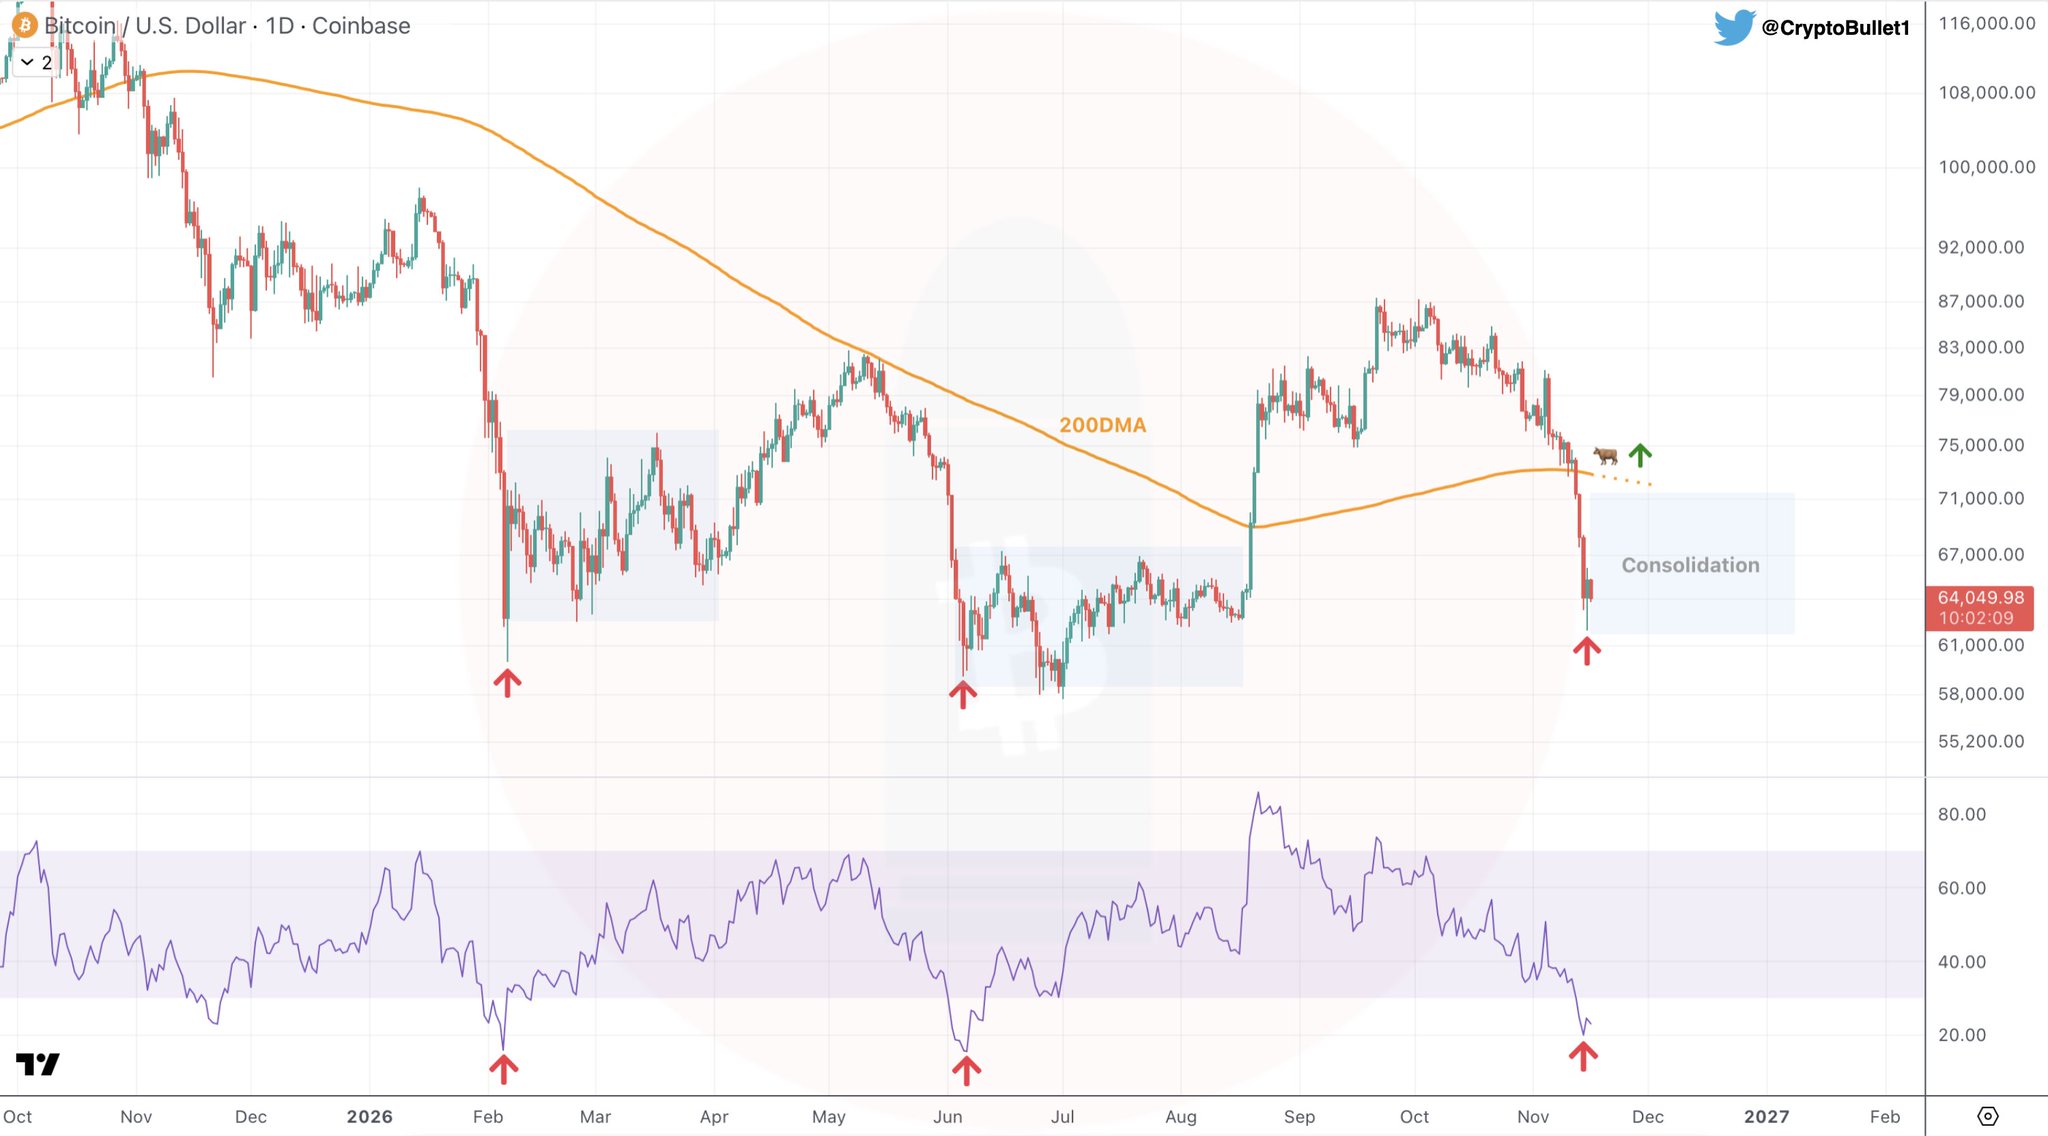
The chart shared by the analyst maps three prior episodes on the daily timeframe — February, June, and December — where BTC experienced sharp drawdowns that pushed RSI to comparable oversold depths. In each instance, the pattern that followed was identical: a rectangular consolidation phase lasting one to two months, followed by a recovery attempt toward the 200-Day Moving Average. The current price at $64,052 sits at the lower boundary of what the chart identifies as the current consolidation zone — below the 200DMA, mirroring the structure of each prior setup before a directional resolution.
The RSI is a non-directional signal in isolation. It measures momentum exhaustion, not the direction of the next move. What the analyst is highlighting is behavioral — that Bitcoin markets have historically needed a reset period after selling this intense before committing to a new trend, up or down.
Signal 2 — 200-Week MA Lost, CVDD at $50,800 Back on the Table
The second chart reinforces the structural severity of the current breakdown. Bitcoin has now lost both the 200-Day Moving Average and the 200-Week Moving Average — a double breakdown the analyst marks explicitly on the daily Binance chart. Price at the time of analysis sits at $64,464.95 per the chart label, near the 0.618 Fibonacci retracement level, with the 200-Week MA trendline directly below.
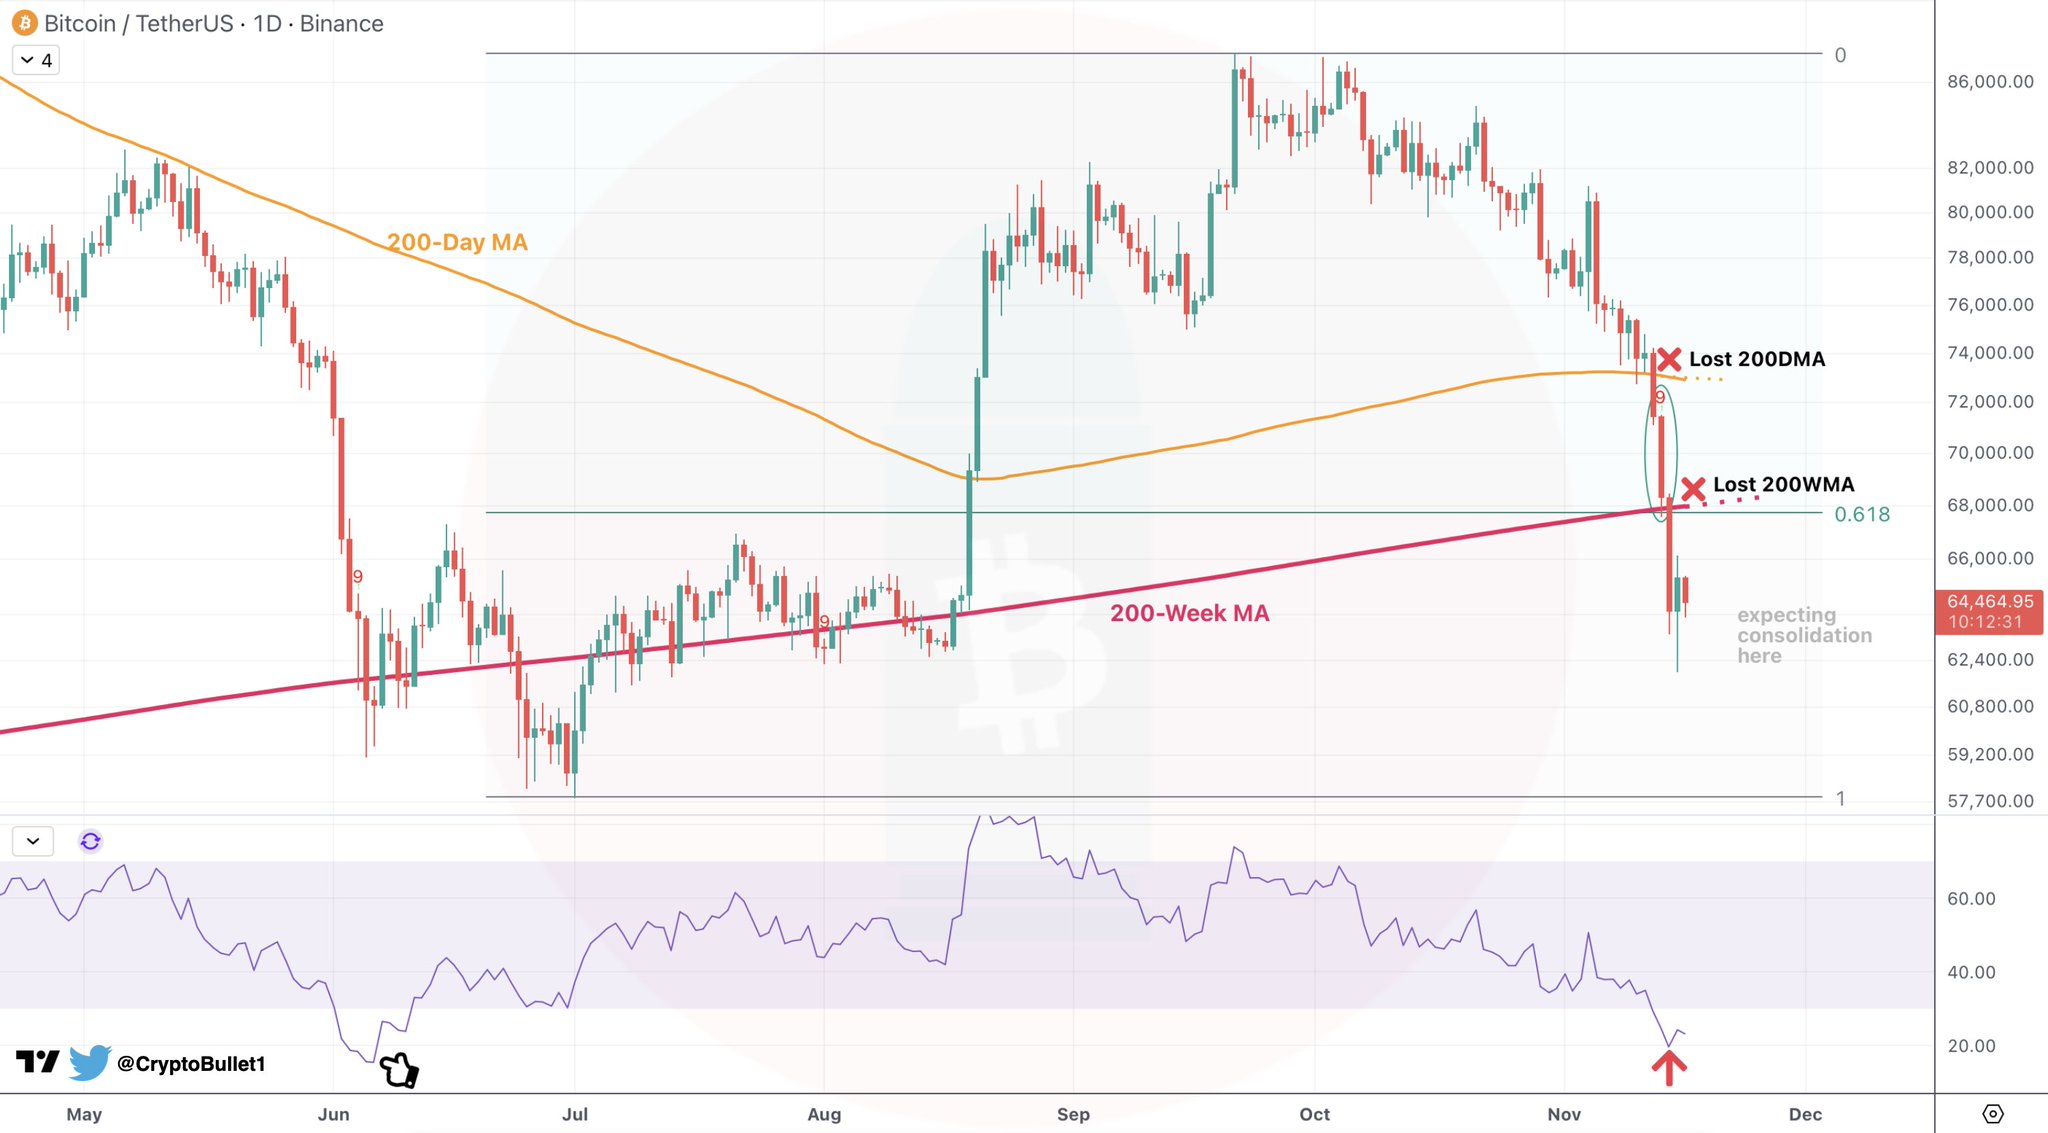
Losing the 200-Week MA is not a routine technical event. This moving average has acted as the ultimate bear market floor in every prior Bitcoin cycle. Its breach now shifts the analytical framework meaningfully. The analyst brings back the CVDD — Cumulative Value Days Destroyed — as a structural model reference at $50,800. CVDD is an on-chain valuation model that measures the cumulative destruction of coin-days, historically identifying regions where long-term holders have capitulated and where Bitcoin has found macro bottoms. The $50,800 level is not a price target from this analysis — it is a model coordinate the analyst places back on the table as a scenario for bulls who want to understand the downside risk envelope.
The analyst’s precise framing matters here: “If you’re a bull but wanna stay on the safe side, wait for the price to get back above the 200-Day MA.” That is a condition, not a prediction. The 200DMA reclaim is the confirmation level the analyst identifies as separating a defensive positioning from a confident re-entry signal. This context connects directly to Bitcoin falling below the STH cost basis, where bears structurally hold the edge until key moving averages are reclaimed.
ETF Flows Confirm Institutional Selling Pressure
The technical picture is not isolated. Bitcoin spot ETF data via SoSoValue shows five consecutive days of net outflows totaling $1.07 billion. The most recent trading day logged a net outflow of $185.5 million, led by IBIT with $143.5 million in redemptions and FBTC with $41.9 million — zero inflow days in the past five sessions. Total ETF net assets have pulled back to $86.20 billion. This aligns with separate on-chain reporting that U.S. institutions are selling BTC faster than Binance traders, per CryptoQuant data.
Against that backdrop, Strategy (formerly MicroStrategy) continues to accumulate. The firm added 485 BTC for $33.4 million in its latest purchase, bringing total holdings to 850,849 BTC. Over the past three weeks, Strategy acquired 2,332 BTC for $180.8 million — a counter-trend buy that underscores divergence between institutional sellers in ETF wrappers and corporate treasury holders with longer time horizons.
On the macro side, markets are pricing a 91.4% probability of a rate hold at the December 9 FOMC meeting, with the federal funds rate expected to remain at 4.00%–4.25% per SoSoValue data. The January 2027 FOMC is where rate-hike expectations begin to materialize, with a 65.6% probability of a hike to 4.25%–4.50%. This forward-looking rate pressure is relevant context for Bitcoin’s near-term demand environment. Key macro data releases this week include Retail Sales (November 16), Initial Jobless Claims (November 18), and Core PCE alongside GDP on November 24 — each of which could move risk appetite materially.
What the RSI Oversold Reading Says — and What It Doesn’t
The deeply oversold RSI confirms that selling has been extreme and historically unusual in its intensity. It does not confirm that a bottom has been set. It does not specify whether the consolidation period ahead resolves to the upside or downside. What it identifies — consistent with prior instances the analyst marks on the chart — is that a one-to-two month digestion phase is the statistically common outcome after episodes this severe. Momentum exhaustion precedes pause, not necessarily reversal.
The 200DMA is the line the analyst names as key. Bitcoin is currently below it. A sustained close back above the 200-Day Moving Average would, in the analyst’s framing, provide bulls with the structural confirmation needed to position with conviction. Until that reclaim occurs, the CVDD level at $50,800 represents the outer boundary of the bear scenario — the on-chain model level where prior cycle macro floors have formed.
Bitcoin’s current position — below both the 200DMA and 200-Week MA, RSI deeply oversold, ETF outflows running at five consecutive days — presents a two-sided setup. The consolidation thesis says patience; the CVDD scenario says the downside has not been fully priced out. The 200DMA is the level that separates those two readings. Watch it.
Source: x.comFrequently Asked Questions
What does a deeply oversold RSI mean for Bitcoin right now?
What is the CVDD level and why is $50,800 significant?
Why does losing the 200-Week MA matter more than losing the 200-Day MA?
What specific condition must Bitcoin meet for bulls to re-enter with confidence?
Source: Cryptobullet1 · Published by CoinsProbe Markets Desk
The opinions and market insights shared on CoinsProbe represent the views of individual authors based on prevailing market conditions at the time of publication. Cryptocurrency investments carry significant risk and volatility. Readers are encouraged to conduct their own research and seek professional financial advice before making investment decisions. CoinsProbe and its contributors do not accept responsibility for financial losses or decisions made based on published content.
CoinsProbe may publish sponsored articles, affiliate links, or promotional collaborations. All sponsored material is clearly labeled to maintain transparency with our audience. Our editorial decisions remain fully independent, and advertising partnerships do not influence reviews, rankings, or published opinions.
Since 2023, CoinsProbe has delivered reliable insights on cryptocurrency, blockchain, and digital assets. Our content is created by experienced researchers and analysts who follow strict editorial standards focused on accuracy, transparency, and credibility. Every article is carefully reviewed and verified using trusted sources and current market data. We provide unbiased analysis and timely updates covering everything from emerging crypto projects to major industry developments.