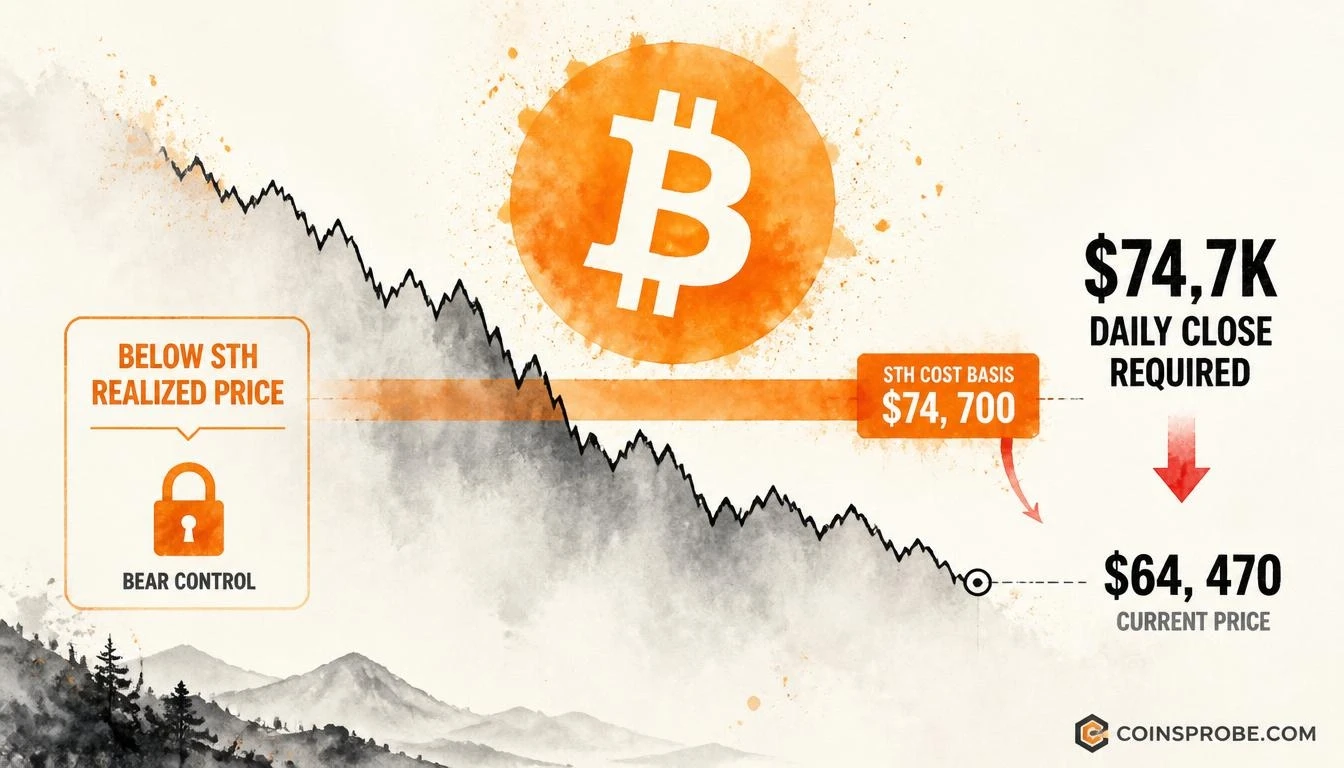

- Bitcoin trades at $64,470 — down 1.56% — sitting $10,230 below the Short-Term Holder Cost Basis at $74,700
- CryptoQuant analyst @IT_Tech_PL states bulls need a daily close above $74.7K; last time below, BTC stayed under for months and the May retest failed
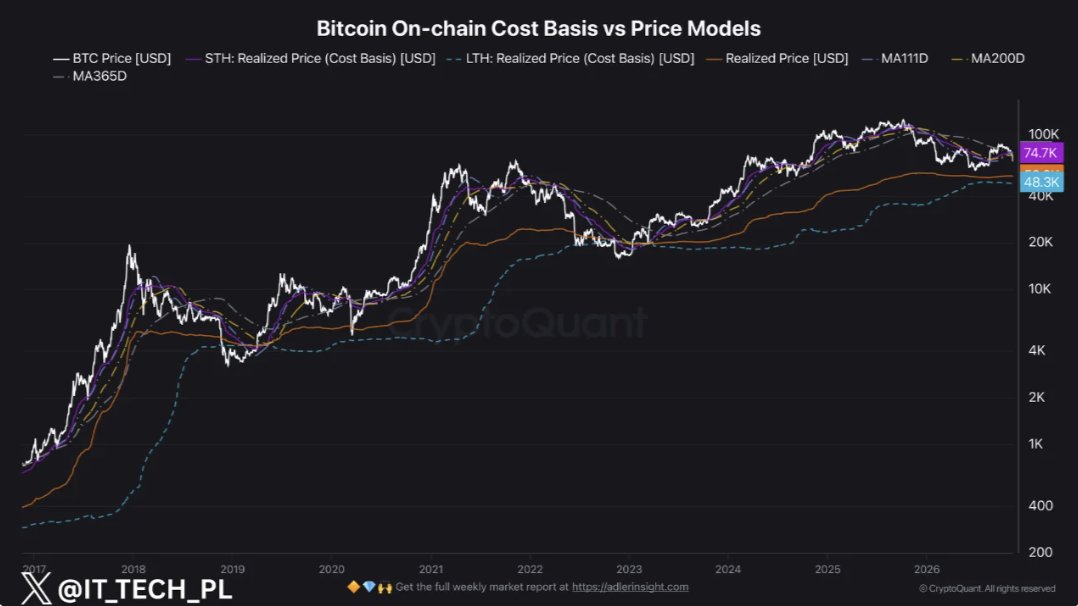
- $74,700 (STH Cost Basis) is the sole on-chain reclaim level; $48,300 (Realized Price) is the deeper structural floor visible on the chart
Bitcoin is trading at $64,470 — down 1.56% in the past 24 hours and sitting firmly below a critical on-chain threshold that has historically determined which side of the market holds structural control. At $64,470, BTC is approximately $10,230 below the Short-Term Holder (STH) Cost Basis at $74,700 — and according to CryptoQuant, that gap is what separates a bear-controlled market from a bull reclaim.
The signal comes directly from a CryptoQuant analyst publishing under the handle @IT_Tech_PL, whose note reads: “Bulls need a daily close above $74.7K to reclaim it. Until then, bears have the upper hand.” The analysis was published November 14, 2026, via CryptoQuant’s Quicktake platform and amplified by the official @cryptoquant_com account. The conclusion is unambiguous — this is not a support level to watch. It is a threshold that has already been broken.
What the STH Cost Basis Actually Measures
The Short-Term Holder Realized Price is not a technical indicator derived from price action. It is an on-chain metric — the average acquisition cost of all Bitcoin held by wallets that have held their coins for 155 days or fewer. When Bitcoin trades below this level, it means the median recent buyer is sitting at an unrealized loss. This is structurally significant for two reasons: first, it creates selling pressure as holders capitulate; second, it historically marks phases where the market’s marginal sellers are underwater and motivated to exit.
At the time of writing, the STH Realized Price stands at approximately $74,700. Bitcoin at $64,470 means recent buyers are roughly 13.7% in the red on average — a condition that the CryptoQuant analyst notes has historically extended for months before resolving.
The Historical Precedent: What Happened Last Time
The CryptoQuant analysis is explicit on historical context. According to the published note, the last time Bitcoin traded below its STH Cost Basis under comparable conditions, it stayed below for months. The analyst specifically flags the May retest: price briefly approached the STH level but failed to reclaim it on a daily closing basis, confirming bears retained structural control. That failed retest was the defining moment — not the initial breakdown.
This precedent matters because it frames what a “reclaim” actually requires. It is not enough for Bitcoin to touch $74,700 intraday. The CryptoQuant analyst is explicit: a daily close above $74,700 is the condition. An intraday wick above that level without a confirmed close does not satisfy the structural requirement. Those evaluating this setup should track daily candle closes, not spot prints.
For further context on Bitcoin’s current on-chain valuation structure, Bitcoin’s MVRV dropping below 1.2 has historically marked cycle bottoms — a related signal that places the current STH breakdown within the broader cost-basis picture.
Where Price Sits in the STH–Realized Price Range
The chart from CryptoQuant’s analysis maps Bitcoin’s price against two key cost-basis levels: the STH Realized Price at $74,700 and the broader Realized Price (all holders, not just short-term) at $48,300. At $64,470, Bitcoin is positioned in the middle of this band — below the STH cost basis that defined recent buyer pain, but still above the deeper on-chain floor that has historically represented the most extreme accumulation zones in prior bear cycles.
This two-level structure tells a specific story. The $74,700 level is the immediate battle line — where short-term capitulation pressure is concentrated. The $48,300 level represents the aggregate cost basis of the entire supply and has historically acted as a macro cycle floor. Bitcoin currently sits between these two levels, meaning the breakdown from STH support is confirmed, but the deepest structural support remains intact.
It is worth noting that Bitcoin recently experienced a significant deleveraging event — the mechanics of that move are detailed in this analysis of Bitcoin’s $2B liquidation cascade, which provides context for how price arrived at current levels.
The Single Level That Determines the Outcome
The CryptoQuant analysis does not offer a price target to the downside. It does not project a bottom. What it states — with precision — is a single conditional: a daily close above $74,700 is required for bulls to reclaim structural control. Everything below that level is bear territory by this metric’s definition.
At $64,470, that reclaim requires a 15.9% move from current price. That is not a trivial distance. The analyst’s note implicitly acknowledges this by referencing the prior cycle’s pattern of extended below-STH periods — not a quick snapback, but a prolonged resolution process.
Macro context is also relevant here. The DXY recently hitting a one-year high at 103.41 adds a dollar-strength headwind to any near-term reclaim attempt — a factor that historically compresses BTC’s recovery timeline when both signals align negatively.
What This Signal Says — and What It Doesn’t
What this signal confirms: Bitcoin’s short-term holders are underwater on average, bears hold structural momentum on a daily timeframe, and the burden of proof is on bulls to produce a confirmed daily close above $74,700.
What this signal does not say: it does not set a downside target. The CryptoQuant analyst names no support level below current price. The $48,300 Realized Price appears on the chart as a visual reference — a broader cost-basis anchor — but neither the analyst nor the published note characterizes it as a price target or support level to watch. It should not be treated as one.
What to watch for a structural change: a single daily candle closing above $74,700 on Bitstamp or Coinbase spot price, confirmed at the UTC 00:00 candle close. Until that close occurs, the CryptoQuant framework designates this as a bear-controlled market by definition of the STH metric.
The on-chain picture is straightforward. Bitcoin at $64,470 is $10,230 below the threshold where bulls reclaim structural control. The prior episode below this level lasted months. The May retest failed. Whether this instance resolves faster or slower will be answered by daily closes — specifically, whether any of them print above $74,700. Watch that level on the daily chart as the sole on-chain trigger the CryptoQuant analysis requires for a structural shift.
Source: x.comFrequently Asked Questions
What is the STH Cost Basis and why does $74,700 matter for Bitcoin right now?
Does Bitcoin being below the STH Cost Basis mean a new all-time low is coming?
What exactly qualifies as a reclaim of the $74,700 level?
How long did Bitcoin stay below the STH Cost Basis the last time this happened?
Source: CryptoQuant · Published by CoinsProbe Markets Desk
The opinions and market insights shared on CoinsProbe represent the views of individual authors based on prevailing market conditions at the time of publication. Cryptocurrency investments carry significant risk and volatility. Readers are encouraged to conduct their own research and seek professional financial advice before making investment decisions. CoinsProbe and its contributors do not accept responsibility for financial losses or decisions made based on published content.
CoinsProbe may publish sponsored articles, affiliate links, or promotional collaborations. All sponsored material is clearly labeled to maintain transparency with our audience. Our editorial decisions remain fully independent, and advertising partnerships do not influence reviews, rankings, or published opinions.
Since 2023, CoinsProbe has delivered reliable insights on cryptocurrency, blockchain, and digital assets. Our content is created by experienced researchers and analysts who follow strict editorial standards focused on accuracy, transparency, and credibility. Every article is carefully reviewed and verified using trusted sources and current market data. We provide unbiased analysis and timely updates covering everything from emerging crypto projects to major industry developments.