- Bitcoin is trading at $65,273 (+0.55% 24h) after losing both the 200-Day and 200-Week Moving Averages
- Analyst flags CVDD floor model at $50.8K as back on the table — a potential 22% further decline from current levels
- Bulls must reclaim the 200-Day MA (~$75,000) before any re-entry is considered structurally valid
- Spot Bitcoin ETFs recorded $1.07B in net outflows over 5 consecutive outflow days per SoSoValue
Bitcoin is trading at approximately $65,273 — up just 0.55% in the past 24 hours — but the chart structure underneath that calm surface has fractured. One analyst’s warning, issued on November 16, 2026, is now circulating widely: Bitcoin has lost the 200-Week Moving Average, a threshold that historically separated cyclical corrections from full bear market conditions. The loss of this level reopens a scenario most bulls had shelved — a potential drawdown toward the Coin Value Days Destroyed ($50.8K) floor model.
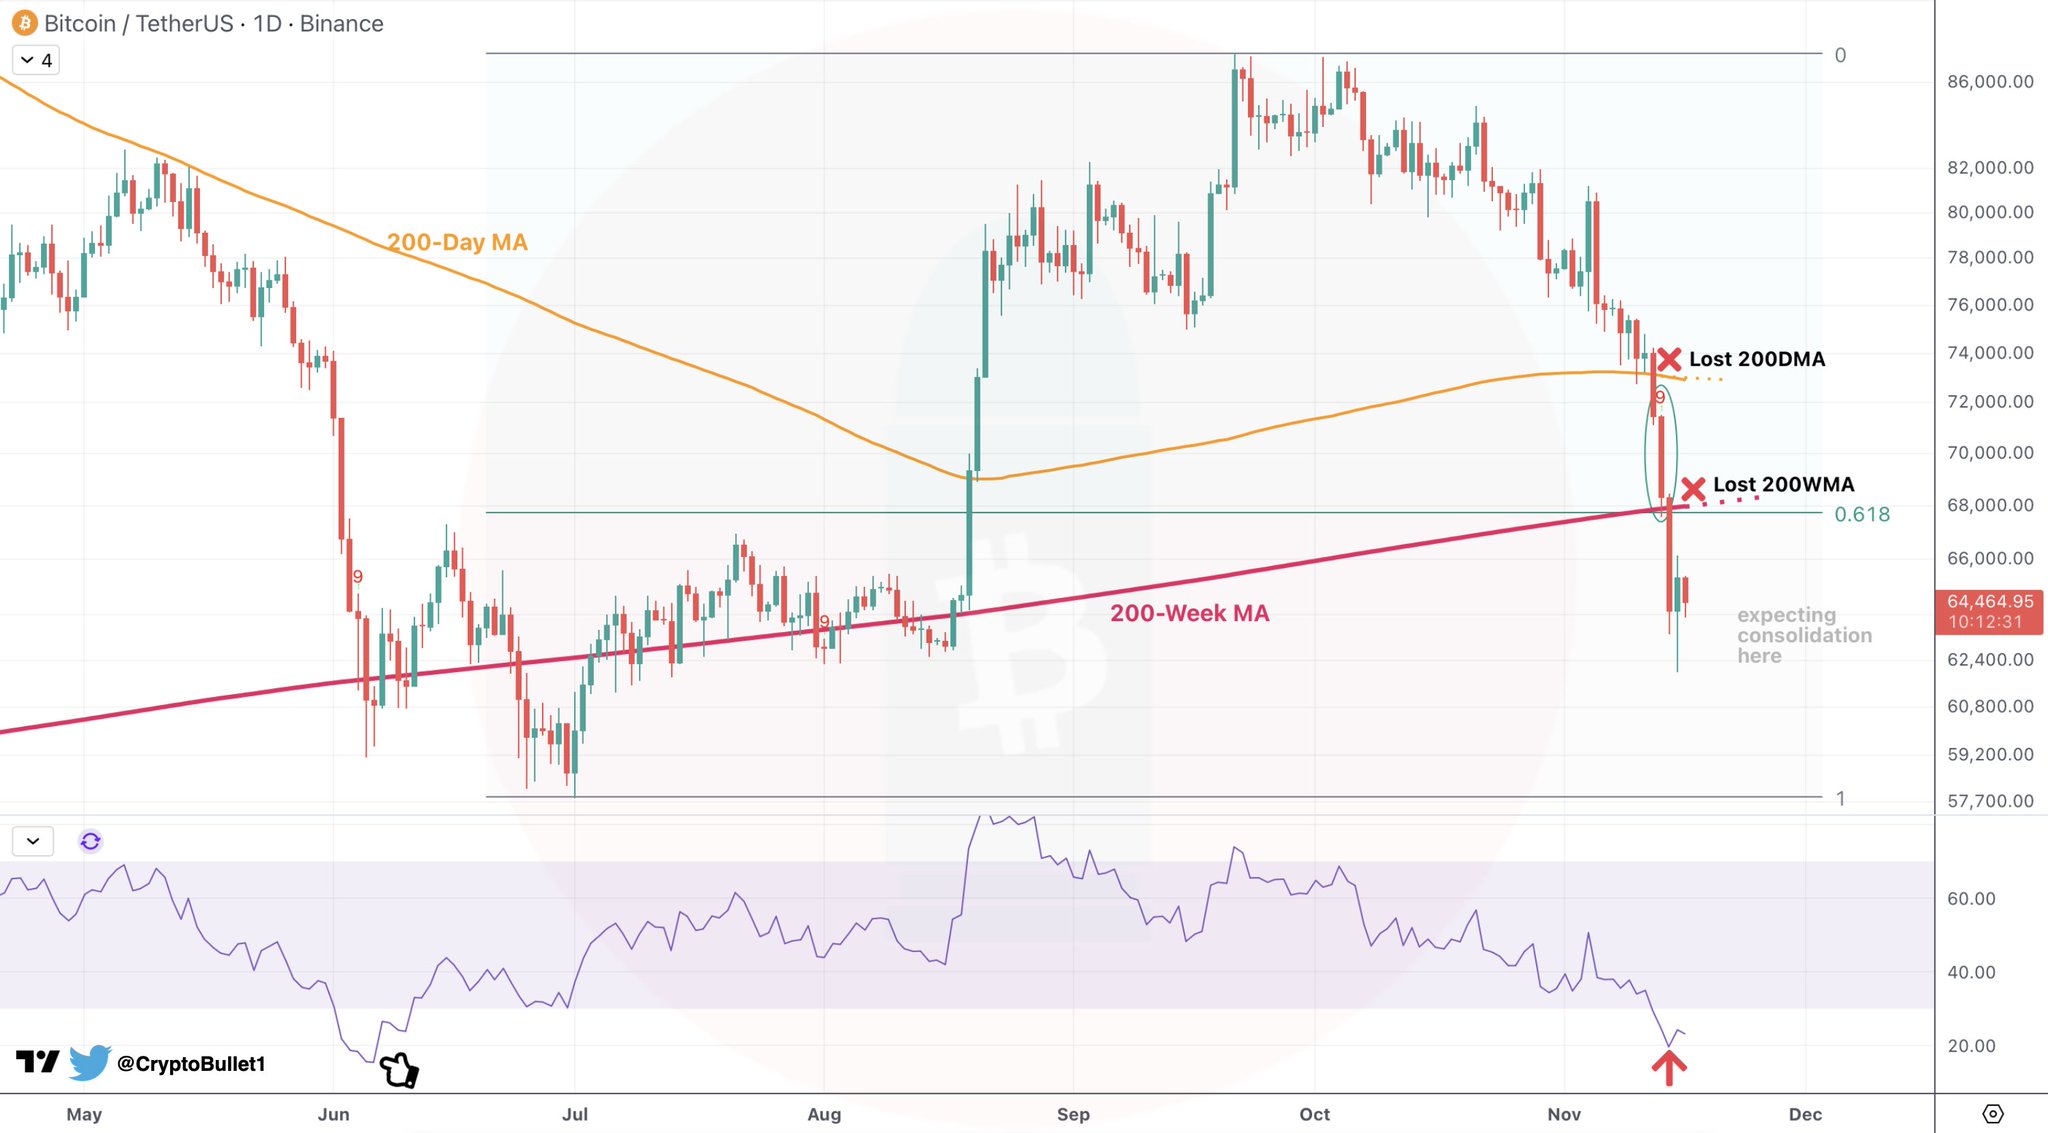
The analysis comes from a crypto analyst posting under the handle @CryptoBullet1, who delivered the assessment in unambiguous terms: “So, $BTC lost the 200WMA ❌ — The CVDD is back on the table ($50.8k). If you’re a bull but wanna stay on the safe side, wait for the price to get back above the 200-Day MA.” The post referenced a prior note from November 14 — where the same analyst had flagged that the breakdown was imminent — summarized bluntly as: “yeah, so we’re f*cked.” Two data points, two days apart, telling the same story.
The 200-Week MA — What It Measures and Why Its Loss Matters
The 200-Week Moving Average is the single most-watched long-term trend indicator in Bitcoin’s analytical toolkit. It represents the average closing price over the prior 200 weekly candles — roughly four years of market history condensed into one line. Historically, Bitcoin has only traded below this level during the deepest phases of its bear markets: late 2018 and briefly in 2022. Each prior instance resolved with a recovery above it, which is precisely why a confirmed breach — not an intraday wick, but a sustained loss — carries the weight it does.
The daily chart flagged by the analyst shows a sharp two-step breakdown from recent highs, with price cascading below both the 200-Day MA and the 200-Week MA in rapid succession. At the time of the analysis, Bitcoin was sitting below both moving averages and below the 0.618 Fibonacci retracement level — a confluence zone that often acts as the last line of defense before deeper structural damage. The chart also shows a steep vertical drop toward a rising long-term support line, with the analyst noting consolidation near current levels before any directional resolution. For related context on where these moving averages are positioned and what they historically signal, see our prior analysis: Bitcoin RSI Hits Deeply Oversold — 200DMA and CVDD at $50.8K Now in Focus.
CVDD at $50.8K — The On-Chain Floor Model Now In Play
The CVDD — Coin Value Days Destroyed — is an on-chain valuation model that estimates the minimum credible price floor for Bitcoin by measuring the economic weight of coins that have remained dormant and are then moved. When long-dormant coins are transferred, those coin-days are “destroyed,” and the CVDD tracks the cumulative value of those destruction events over time. It is not a price target. It is a bottom-of-range estimate — a level below which Bitcoin has historically not sustained trading for meaningful durations.
The analyst places the current CVDD reading at $50.8K. At Bitcoin’s current price of $65,273, that represents a potential additional drawdown of approximately 22% from here. This is not a forecast — the analyst explicitly presents it as a scenario that is “back on the table,” not a base case. The phrasing is deliberate: the CVDD floor was previously dismissed during Bitcoin’s strength above its key moving averages. With those averages now lost, the model re-enters the conversation. For a deeper breakdown of how the CVDD is calculated and its historical hit rate, see: Bitcoin CVDD Sits at $50.7K — What This On-Chain Floor Model Says Now.
The 200-Day MA — The One Level Bulls Need to Reclaim
The analyst’s conditional for bulls is specific and binary: wait for Bitcoin to reclaim the 200-Day Moving Average before treating any rally as structurally valid. The 200-Day MA is currently referenced in the analyst’s replied context at approximately $75,000. That is not a minor gap from $65,273 — it represents roughly a 15% recovery requirement before the analyst considers a bull re-entry defensible.
This framing matters. The analyst is not calling for a bear market bottom, nor is the analyst calling for further capitulation. The recommendation is conditional: if you are constructively positioned on Bitcoin, the structural signal from both the 200-Day and 200-Week MA loss means the burden of proof has shifted to the bulls. Price must recover above the 200-Day MA to re-establish the technical conditions that previously justified a bullish bias.
Institutional Context — ETF Outflows Confirm the Pressure
The technical picture is not operating in isolation. Spot Bitcoin ETF data via SoSoValue confirms institutional selling pressure running concurrent with the chart breakdown. As of the latest trading date of November 13, 2026, spot Bitcoin ETFs recorded a daily net outflow of $185.5M, with the past five trading days producing a cumulative net outflow of $1.07B — five consecutive outflow days, zero inflow days. IBIT alone shed $143.5M in a single session, while FBTC recorded $41.9M in outflows.
Total ETF net assets stand at $86.20B, against a cumulative net inflow since launch of $54.63B — meaning the cushion remains substantial, but the directional trend of the past week has been unambiguous outflow. When ETF institutional flows align with a breakdown of the 200-Week MA on the chart, neither signal can be dismissed as noise in isolation. Strategy (formerly MicroStrategy) did add 485 BTC for $33.4M recently — bringing total holdings to 850,849 BTC — but that incremental purchase does not offset the broader institutional exit momentum visible in the ETF data.
Macro Backdrop — FOMC and Key Data This Week
The timing of the breakdown coincides with a dense macro calendar. This week brings Retail Sales data (November 16), Initial Jobless Claims (November 18), and S&P Global PMI readings on November 22. The most significant release arrives November 24: Core PCE Price Index (both MoM and YoY) alongside GDP (QoQ) — the Federal Reserve’s preferred inflation gauge. Markets are currently pricing a 91.7% probability of a rate hold at the December 9 FOMC meeting, per SoSoValue data. However, the January 27 FOMC meeting presents a more uncertain picture, with 67.7% odds priced for a hike to 4.25%–4.50%. If Core PCE comes in hot this week, that January hike probability rises — a macro headwind that would compound Bitcoin’s already-stressed technical structure. For a broader view on where this bear cycle could extend if the 200-Week MA loss holds, see: Bitcoin’s December 1st Deadline — Shortest Bear to Potentially Longest in History.
Bullish Scenario — Reclaim of the 200-Day MA (~$75,000)
A sustained close back above the 200-Day Moving Average at approximately $75,000 would represent the minimum structural condition for bulls to re-engage with confidence. The analyst explicitly identifies this as the safe re-entry threshold. Recovery above this level would need to hold on a weekly closing basis to signal that the 200-Week MA loss was a false breakdown rather than a confirmed structural shift.
Bearish Scenario — CVDD at $50.8K Becomes the Target
If Bitcoin fails to reclaim the 200-Day MA and continues to trade below both major moving averages with ETF outflows persisting, the CVDD model at $50.8K re-enters as the next credible structural support. That would represent a 22% decline from current levels of $65,273. The analyst presents this not as a prediction, but as the scenario that is now structurally plausible given the 200-Week MA loss.
Bitcoin has broken below both the 200-Day and 200-Week Moving Averages simultaneously — a configuration that has historically only appeared during confirmed bear market phases. The on-chain CVDD floor model at $50.8K, previously sidelined during Bitcoin’s strength, is now a live reference point. The only condition that re-establishes a structurally bullish case, per the analyst’s framework, is a recovery and sustained hold above the 200-Day MA at approximately $75,000. Until that reclaim occurs, the analyst’s guidance is unambiguous: wait. Watch $75,000 as the line that separates bear market positioning from a defensible bull re-entry.
Frequently Asked Questions
What does losing the 200-Week MA mean for Bitcoin’s price?
What is the CVDD and why is $50.8K significant?
At what price should Bitcoin bulls consider re-entering positions?
Are Bitcoin ETF flows confirming the bearish breakdown?
Source: Cryptobullet1 · Published by CoinsProbe Markets Desk
The opinions and market insights shared on CoinsProbe represent the views of individual authors based on prevailing market conditions at the time of publication. Cryptocurrency investments carry significant risk and volatility. Readers are encouraged to conduct their own research and seek professional financial advice before making investment decisions. CoinsProbe and its contributors do not accept responsibility for financial losses or decisions made based on published content.
CoinsProbe may publish sponsored articles, affiliate links, or promotional collaborations. All sponsored material is clearly labeled to maintain transparency with our audience. Our editorial decisions remain fully independent, and advertising partnerships do not influence reviews, rankings, or published opinions.
Since 2023, CoinsProbe has delivered reliable insights on cryptocurrency, blockchain, and digital assets. Our content is created by experienced researchers and analysts who follow strict editorial standards focused on accuracy, transparency, and credibility. Every article is carefully reviewed and verified using trusted sources and current market data. We provide unbiased analysis and timely updates covering everything from emerging crypto projects to major industry developments.