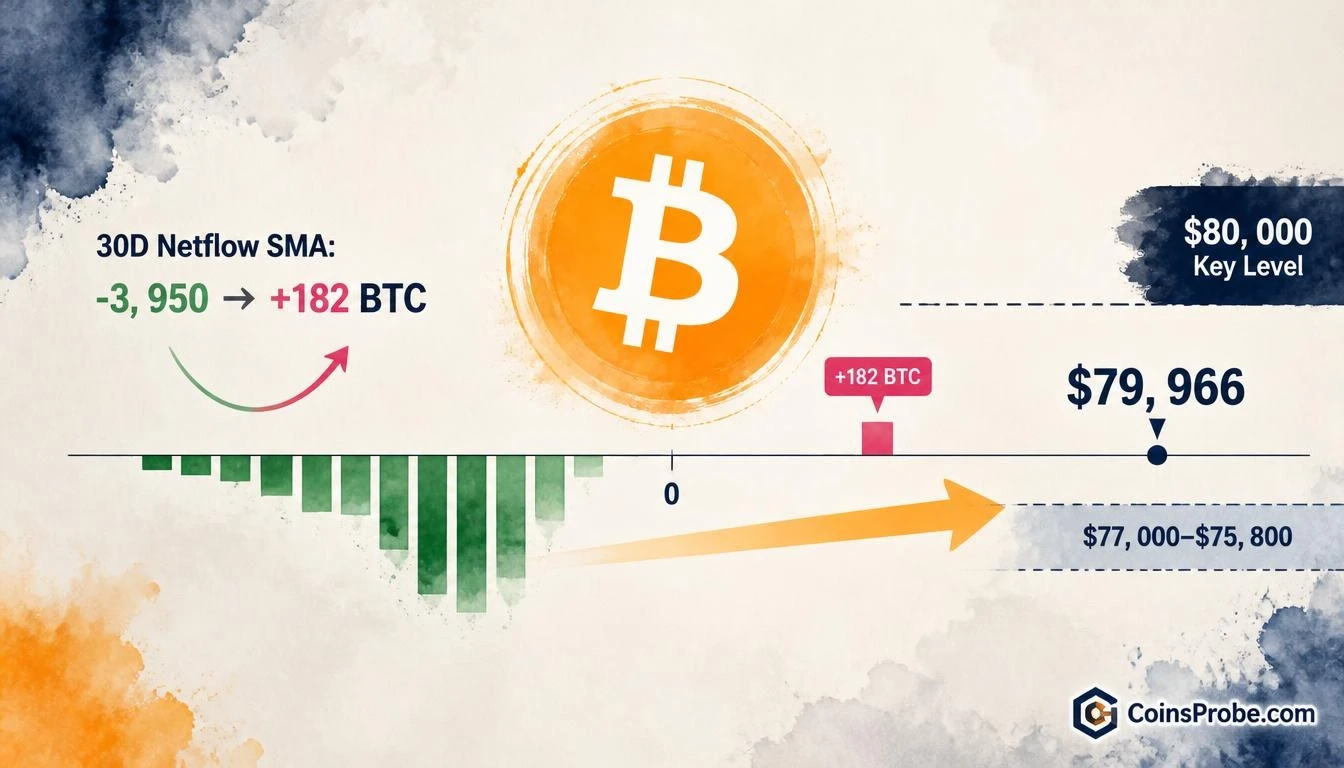

- Bitcoin trades at $79,966 (-2.03% 24h) as exchange netflow SMA turns positive for first time since September 21
- 30D netflow SMA swung from -3,950 BTC (Oct 18) to +182 BTC (Oct 28) — a 4,130 BTC shift in 10 days per CryptoQuant/IT_Tech_PL
- Feb and June sell-offs ran at +4,000 to +5,000 BTC netflow — current +182 BTC is less than 5% of those levels
- Watch levels: netflow SMA above +2,000 BTC and $80K break would open $77,000–$75,800 zone per IT_Tech_PL
Bitcoin is trading at approximately $79,966 — down 2.03% in the past 24 hours — as a quiet but significant shift in exchange flow data draws attention from on-chain analysts. The signal is not a breakout. It is a structural pivot in how coins are moving relative to centralized exchanges, and its implications are more nuanced than a simple bullish or bearish read.
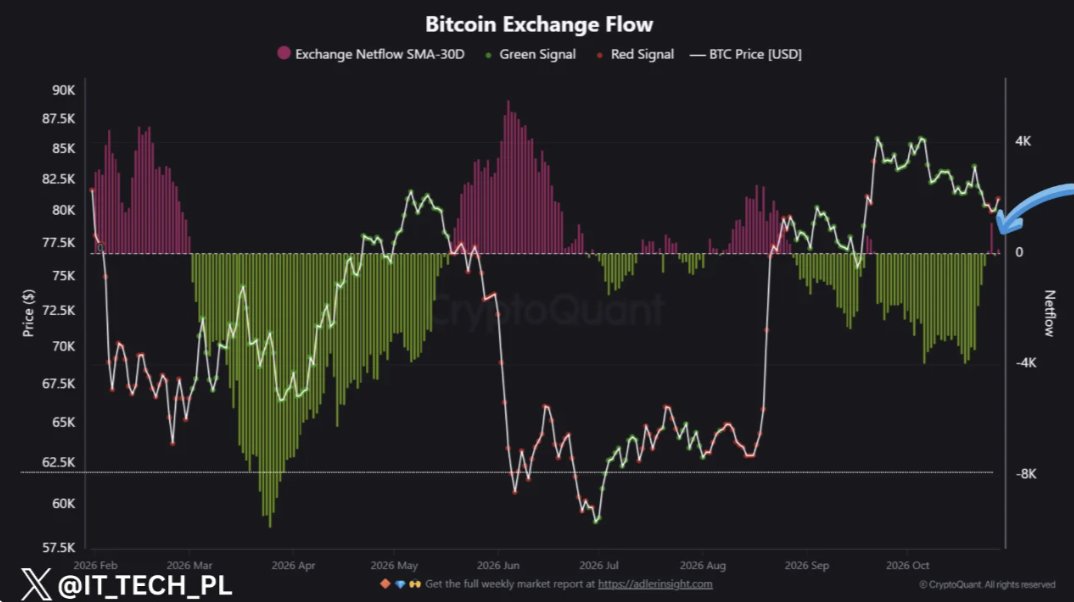
CryptoQuant analyst IT_Tech_PL flagged the development in a published Quicktake note: Bitcoin’s 30-day exchange netflow SMA turned positive for the first time since September 21 — ending a six-week streak of net withdrawals from exchanges. “Holders stopped withdrawing, but sellers aren’t here in size yet,” the analyst writes. The reading as of October 28 stands at +182 BTC, swinging from -3,950 BTC on October 18 — a shift of over 4,100 BTC in the 30-day rolling average over just ten days.
What Exchange Netflow Actually Measures
Exchange netflow is not a price indicator. It measures the net difference between Bitcoin entering and leaving centralized exchanges. When the 30-day SMA is deeply negative, it means coins are consistently moving off exchanges — typically a sign of accumulation, as holders move BTC to self-custody. When the SMA turns positive, it signals that coins are returning to exchanges at a net rate — which historically precedes selling activity, though not automatically at any scale.
The current reading of +182 BTC is technically positive but barely so. For context, IT_Tech_PL notes that the February and June sell-offs of this year both ran at +4,000 to +5,000 BTC in netflow for sustained periods — those episodes drove price from 88K to 63K, and from 81K to 60K respectively. At +182 BTC, today’s reading is less than 5% of those sell-off-level flows.
Six Weeks of Withdrawals — Now Paused
From mid-September through October 18, Bitcoin was leaving exchanges at an average rate reflected in a -3,950 BTC 30-day SMA. That six-week withdrawal streak kept net exchange supply contracting — a structural condition that helped Bitcoin hold the $80,000 level through the shift, per IT_Tech_PL’s note. Price held $80K through the transition, which the analyst specifically flags as meaningful context.
Now that netflow has crossed zero, the withdrawal trend has ended. But the analyst is explicit about what this does and does not mean: sellers are not yet present in size. This is a transitional moment — not a confirmed distribution event. As the $780M single-day inflow episode earlier this year demonstrated, the scale of exchange inflows matters enormously before they translate into price pressure.
The Levels That Define the Next Move
IT_Tech_PL provides two explicit conditions to watch from here. The first: if the 30-day netflow SMA climbs past +2,000 BTC, it would begin approaching the flow rates seen during February and June sell-offs — the threshold where historical data shows supply returning to exchanges becomes meaningful selling pressure. The second: if the $80,000 price level breaks to the downside, the analyst identifies the $77,000–$75,800 zone as the next area of interest.
Neither condition has been met as of October 29. The netflow is at +182 BTC — well below the +2,000 BTC warning threshold. Price is at $79,966, holding just under $80,000. The signal is forming, not confirmed.
For broader context on how whale behavior around key FOMC levels has intersected with exchange flows, see the prior analysis on Bitcoin whale activity after FOMC and the $84,500 line.
Historical Precedents — What +4K to +5K BTC Netflow Did
| Period | Peak Netflow SMA | Price Move |
|---|---|---|
| February 2026 sell-off | +4,000 to +5,000 BTC | 88K → 63K (−28%) |
| June 2026 sell-off | +4,000 to +5,000 BTC | 81K → 60K (−26%) |
| Current (Oct 28, 2026) | +182 BTC | Holding ~$80K |
Source: CryptoQuant / IT_Tech_PL Quicktake, October 28 2026
The data is unambiguous on one point: the two major drawdowns of 2026 both ran with netflow SMAs more than 20 times higher than the current reading. A +182 BTC SMA, on its own, does not replicate those conditions.
Bullish Scenario
If the 30-day netflow SMA retreats back below zero — meaning holders resume net withdrawals — and price holds above $80,000, the six-week accumulation thesis reasserts itself. That would suggest the brief positive blip was noise rather than a structural shift, keeping the supply squeeze intact and supporting price recovery above $82,000 and toward prior ranges.
Bearish Scenario
If the 30-day SMA continues climbing toward +2,000 BTC and $80,000 breaks on a daily close, IT_Tech_PL’s stated next zone is $77,000–$75,800. That range represents the primary downside area the analyst identifies as relevant if selling pressure materializes in size. Bitcoin’s macro cycle context would also come into focus at those levels.
The on-chain regime has shifted from six weeks of net withdrawal to a neutral, slightly positive netflow — but the magnitude remains far below historical sell-off levels. Watch the 30-day netflow SMA: +2,000 BTC is the analyst’s stated threshold where supply pressure becomes historically meaningful, and $80,000 is the price line that determines whether the $77,000–$75,800 zone comes into play.
Source: x.comFrequently Asked Questions
What does a positive Bitcoin exchange netflow mean?
What netflow level would signal real selling pressure based on 2026 precedent?
What price levels does the analyst flag if $80,000 breaks?
Why did Bitcoin hold $80,000 during the six-week withdrawal streak?
Source: CryptoQuant · Published by CoinsProbe Markets Desk
The opinions and market insights shared on CoinsProbe represent the views of individual authors based on prevailing market conditions at the time of publication. Cryptocurrency investments carry significant risk and volatility. Readers are encouraged to conduct their own research and seek professional financial advice before making investment decisions. CoinsProbe and its contributors do not accept responsibility for financial losses or decisions made based on published content.
CoinsProbe may publish sponsored articles, affiliate links, or promotional collaborations. All sponsored material is clearly labeled to maintain transparency with our audience. Our editorial decisions remain fully independent, and advertising partnerships do not influence reviews, rankings, or published opinions.
Since 2023, CoinsProbe has delivered reliable insights on cryptocurrency, blockchain, and digital assets. Our content is created by experienced researchers and analysts who follow strict editorial standards focused on accuracy, transparency, and credibility. Every article is carefully reviewed and verified using trusted sources and current market data. We provide unbiased analysis and timely updates covering everything from emerging crypto projects to major industry developments.