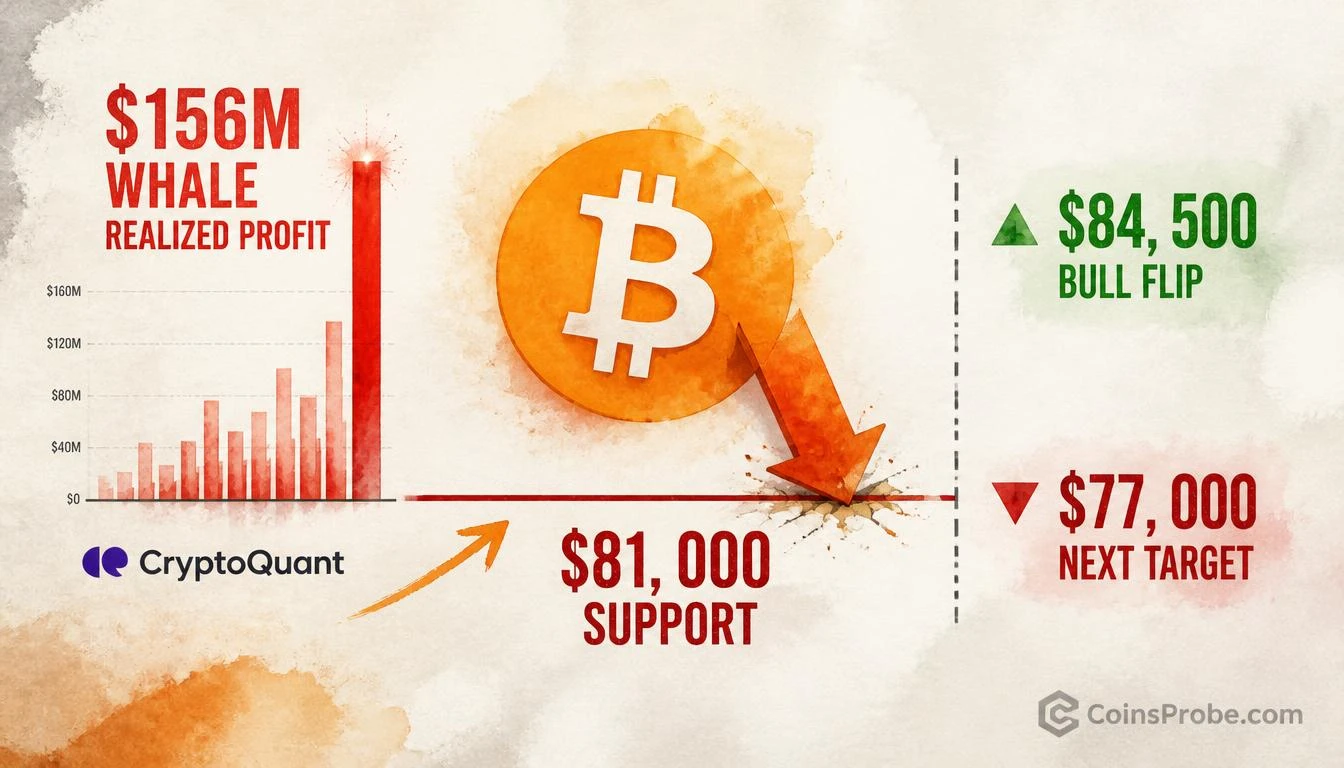

- Bitcoin trades at $81,297 (+1.88%) as @alicharts flags three post-FOMC on-chain caution signals
- Whales realized ~$156M in profits; whale BTC holdings dropped 8,162 BTC (~$664M) in 24 hours per Santiment
- Coinbase Premium hit -0.17 — lowest since September — signaling weak US institutional demand
- URPD key levels: hold $81K + reclaim $84.5K for bull case; lose $81K opens $77K then $67K
Bitcoin is trading at $81,297 — up 1.88% in the past 24 hours, with a market cap of approximately $1.63 trillion. The price recovery follows an FOMC decision that triggered the initial reflex bounce most traders expected. But the critical question, according to one closely-watched on-chain analyst, is not what happened in the first hour — it is what the data shows beneath the surface.
Crypto analyst Ali Martinez (@alicharts) posted a detailed seven-part thread on October 28, 2026, flagging a convergence of cautionary on-chain signals that he argues make post-FOMC price action more meaningful than the immediate knee-jerk reaction. His conclusion: negative Coinbase Premium, whale profit realization, and accelerating whale supply reduction combine to tilt the risk skew toward the downside — unless Bitcoin can reclaim a specific level.
Signal 1 — Whale Realized Profit: $156 Million in Recent Sessions
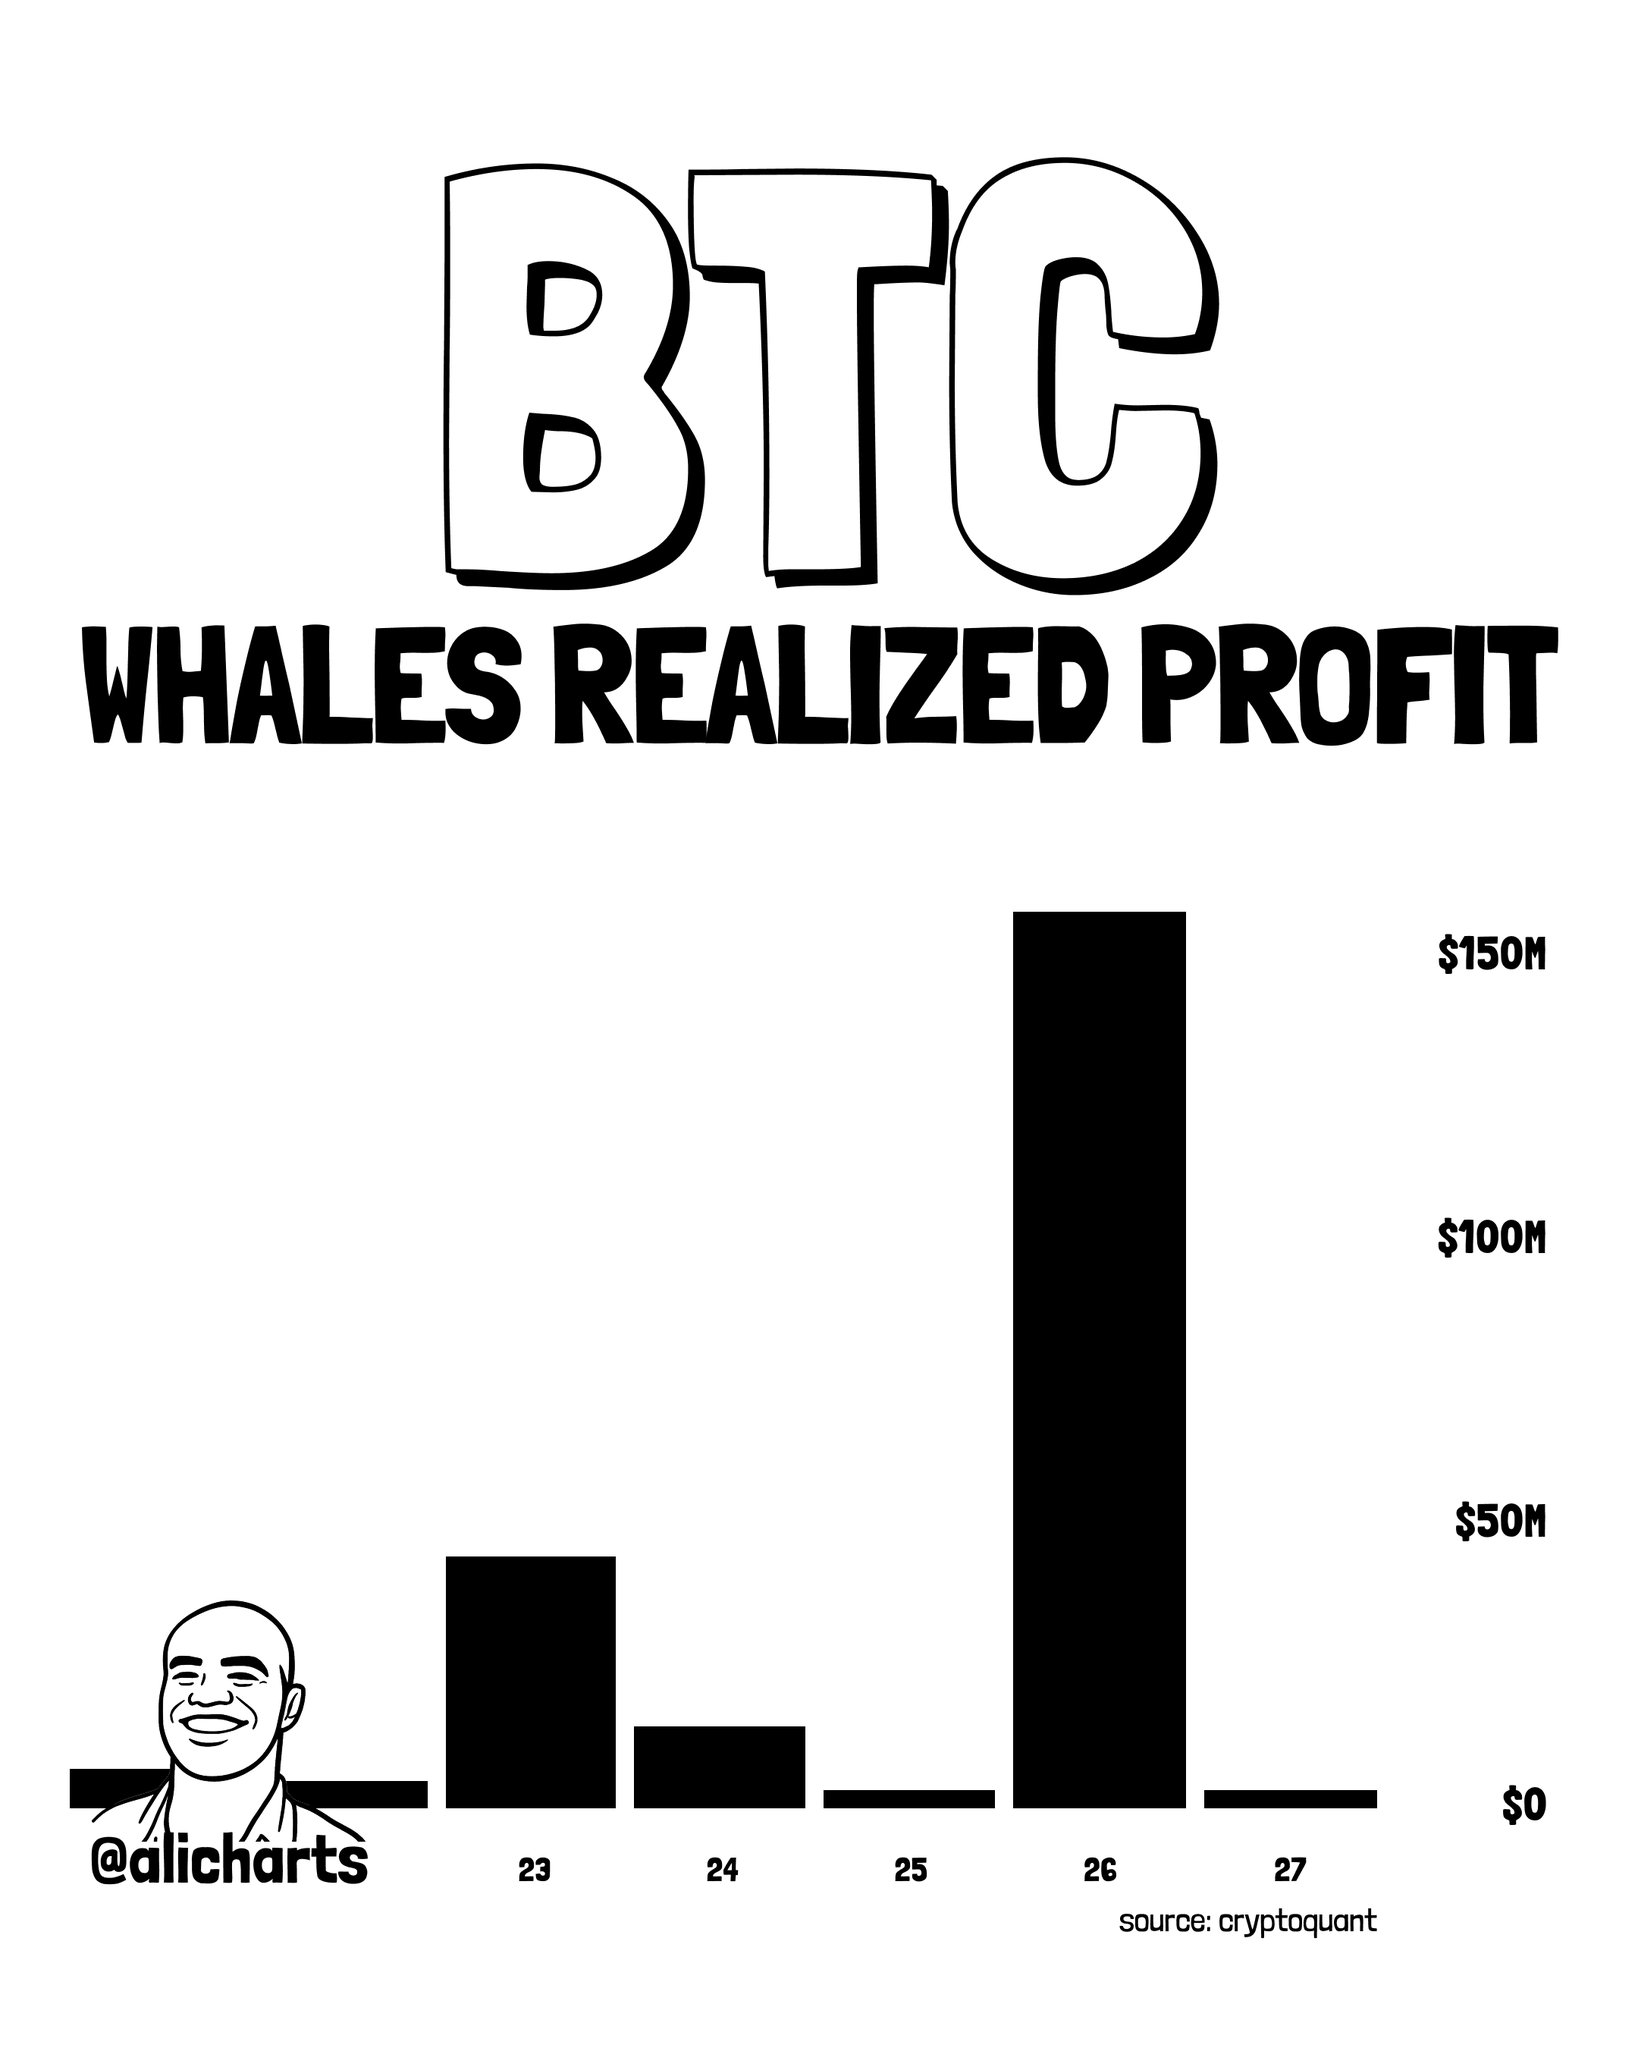
The first signal Martinez flags is whale realized profit. According to data sourced from CryptoQuant and shared in the thread, Bitcoin whales have recently realized approximately $156 million in profits. Realized profit measures the aggregate USD gain locked in when coins move on-chain at a price higher than their acquisition cost — it is direct evidence of large holders selling into strength, not a derivative signal.
The whale realized profit bar chart shared by Martinez shows near-zero readings for most of the measured window, with a dominant spike concentrated at position 26 of the series — the sharpest single-session profit realization event in the visible dataset, reaching into the $100M–$150M range on the chart’s y-axis. The most recent bar (position 27) returns to near-zero, suggesting the acute selling event has subsided — but the cumulative pressure remains in market structure.
Signal 2 — Whale Holdings Decline: 8,162 BTC Shed in 24 Hours
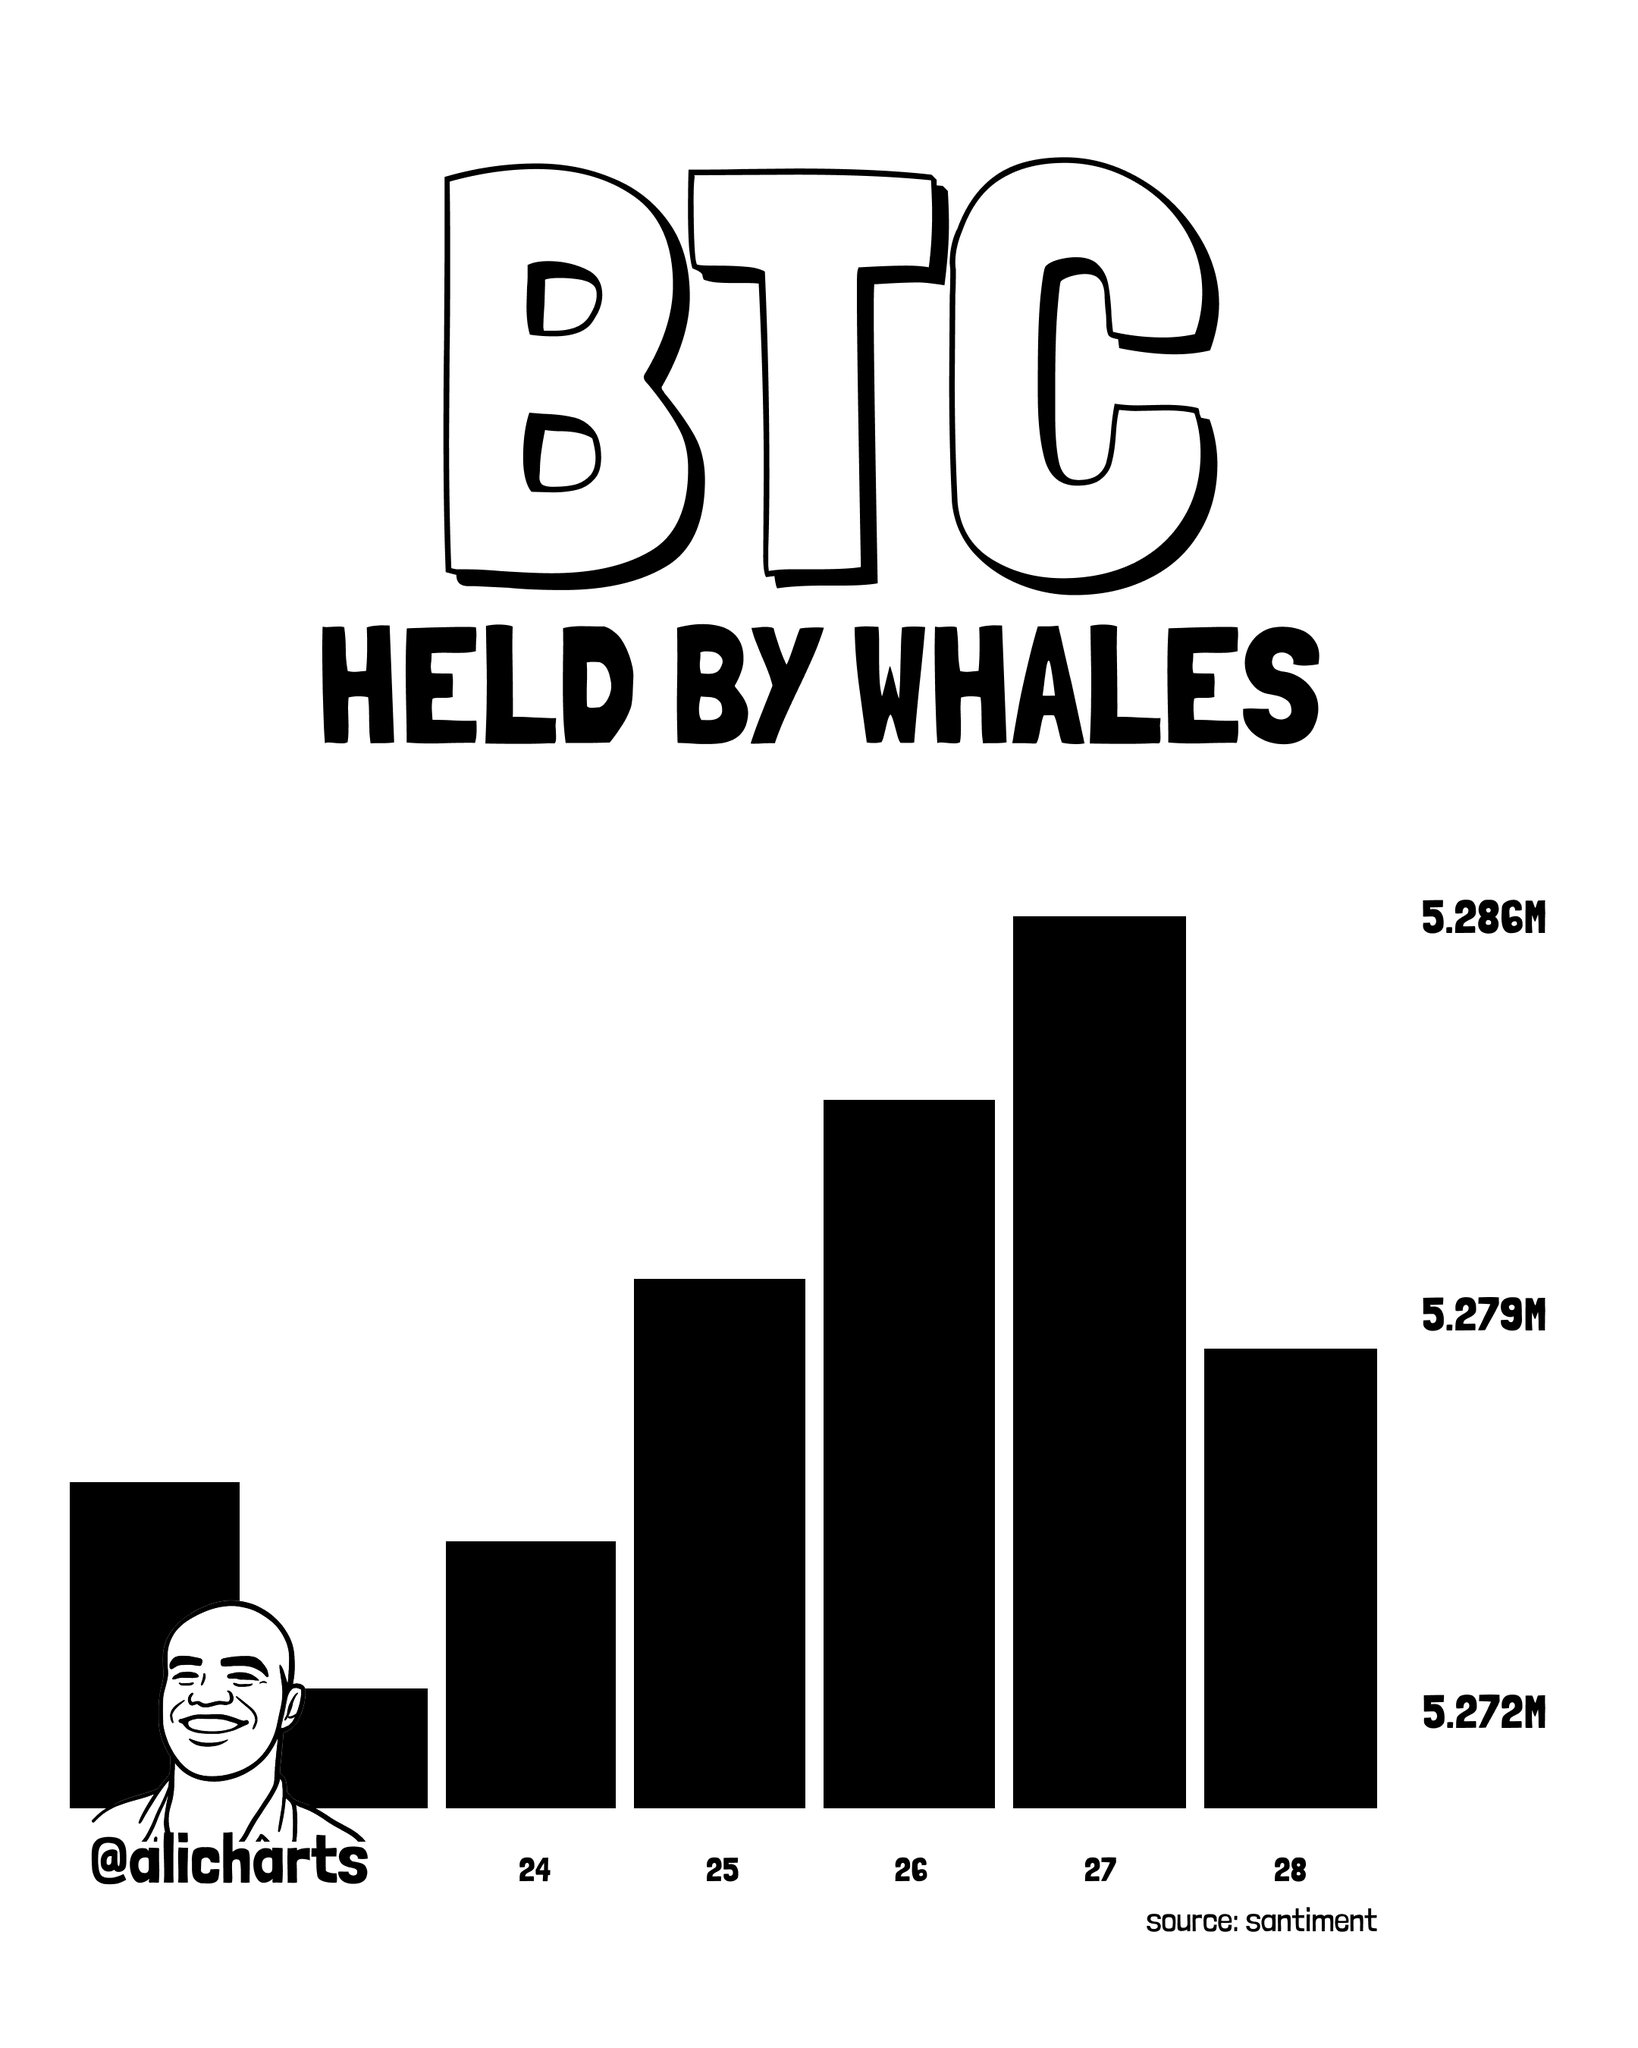
The second signal compounds the first. Martinez notes that whale BTC holdings fell by approximately 8,162 BTC — worth roughly $664 million — in a single 24-hour window. This data, sourced from Santiment, measures the aggregate BTC balance of large-wallet addresses and directly tracks whether whales are accumulating or distributing.
The whale holdings chart published by Martinez shows a progressive accumulation staircase from day 24 through day 27, with the y-axis ranging between 5.272M and 5.286M BTC. The final bar (day 28) drops sharply from the day-27 peak — an inverted-V formation that confirms the supply reduction is not noise. As Martinez frames it, large holders are reducing exposure specifically ahead of the FOMC decision’s delayed market reaction, not after it has resolved.
Signal 3 — Coinbase Premium at -0.17: Lowest Since September
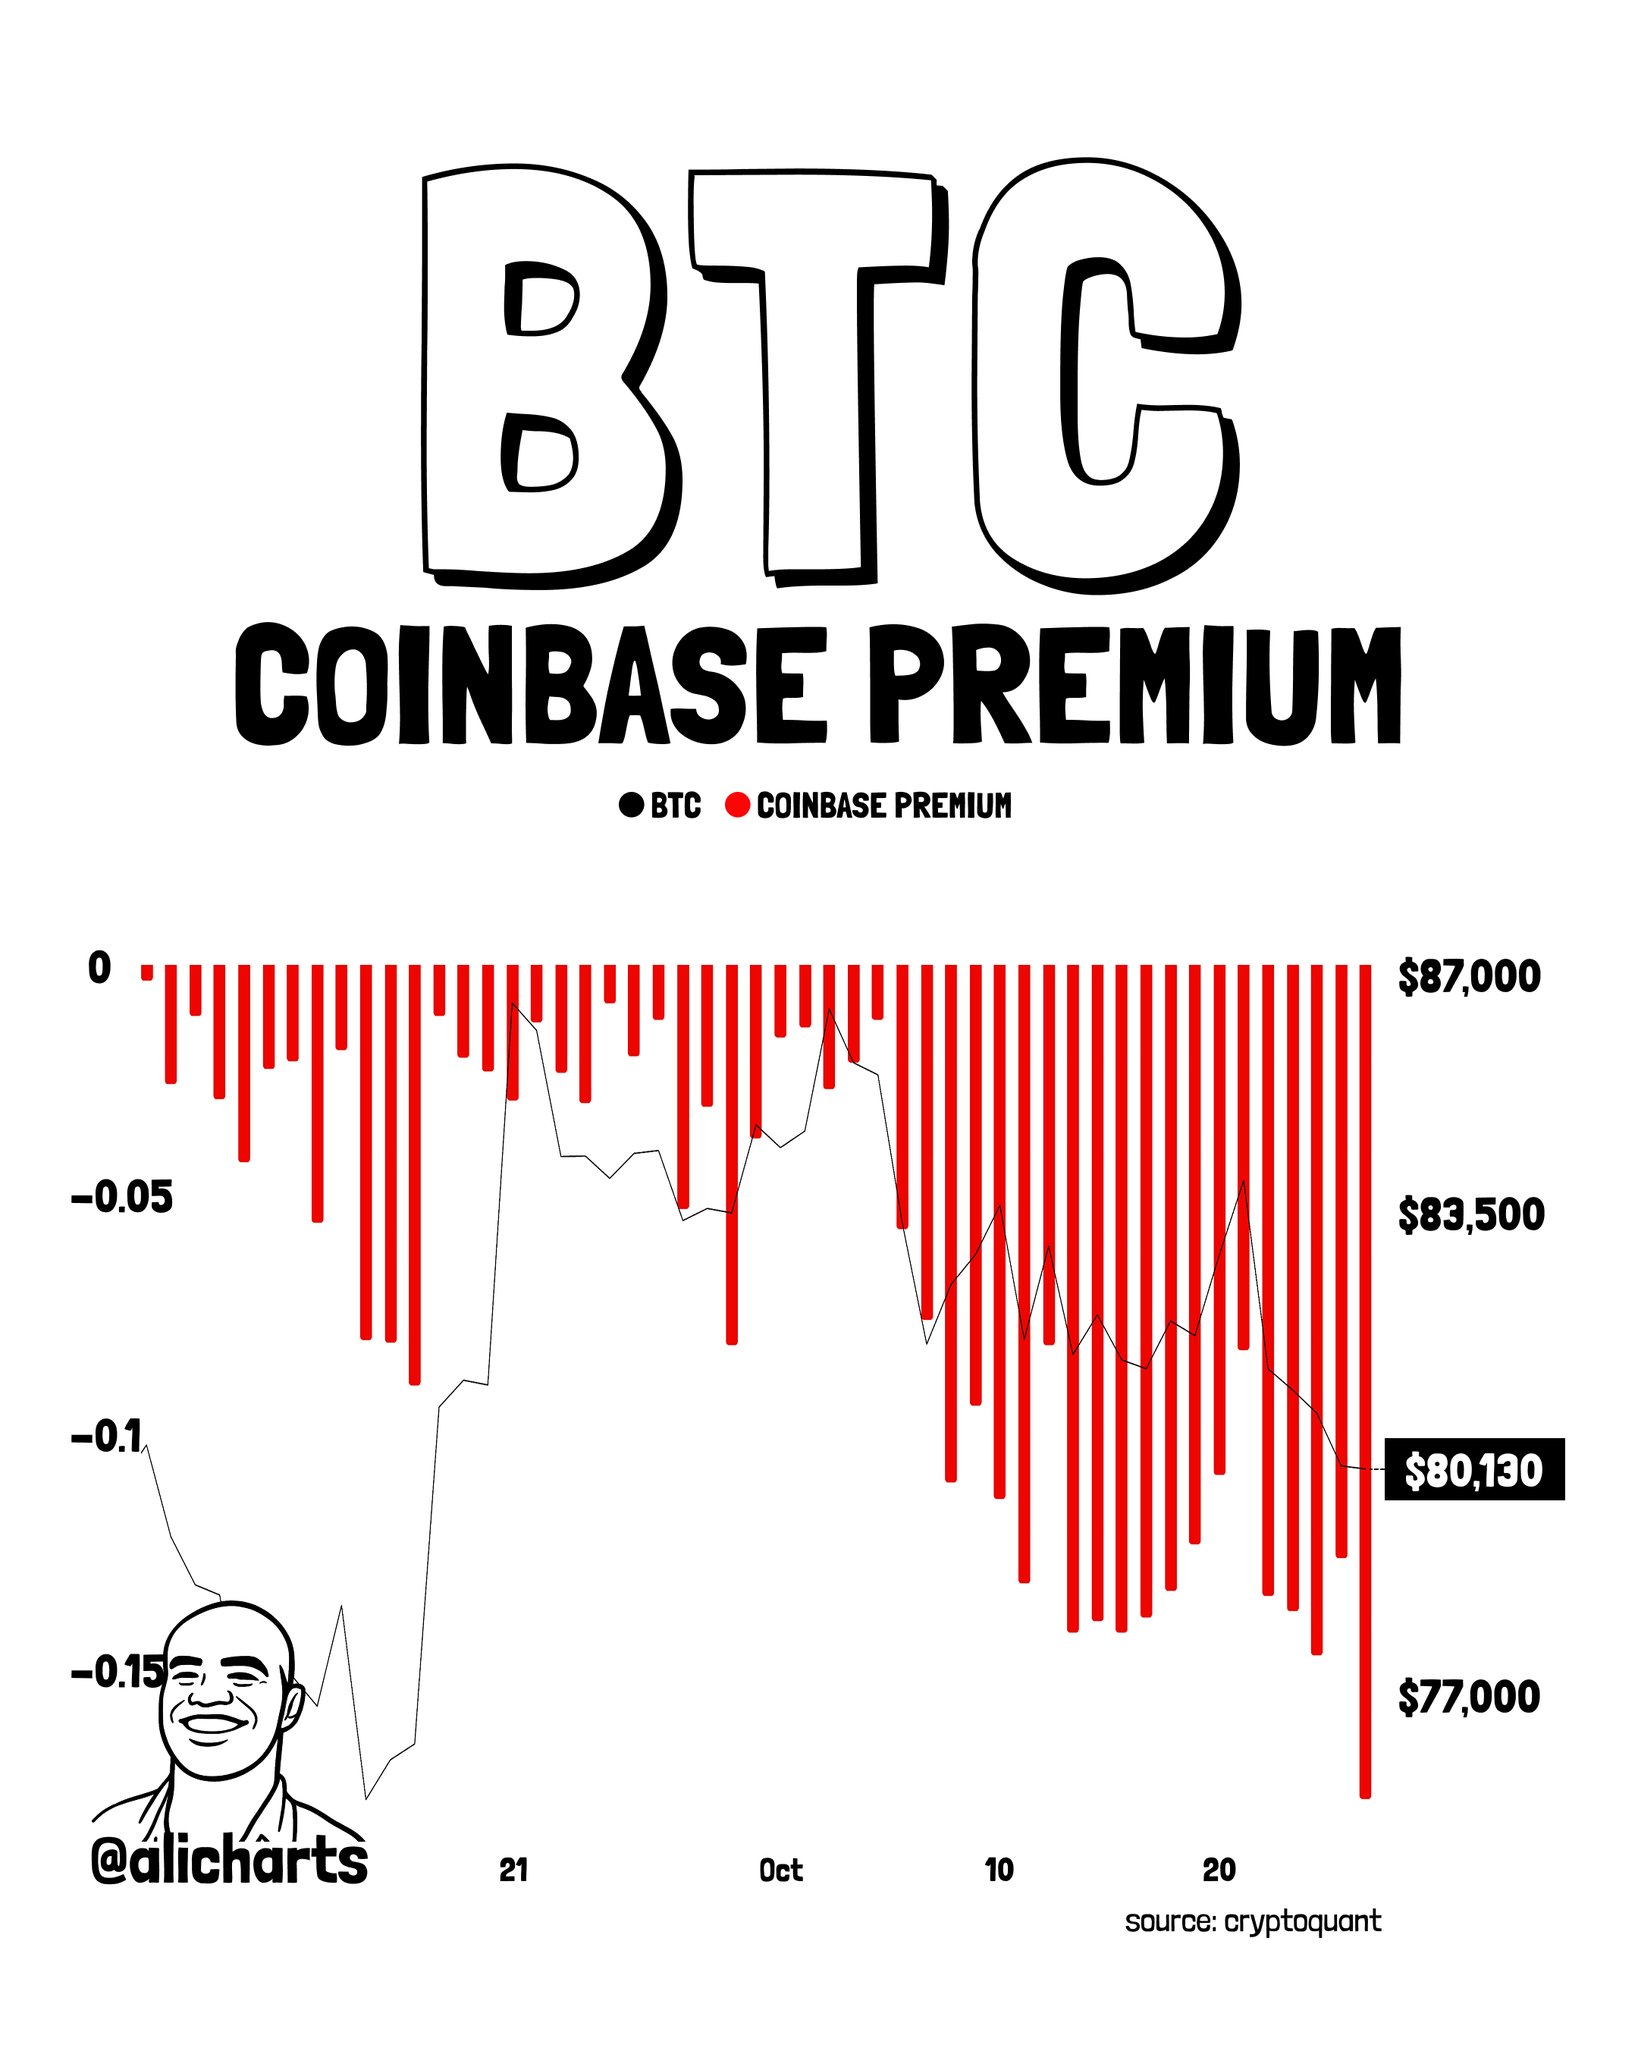
The third and arguably most structurally significant signal is the Coinbase Premium Index. Martinez flags a reading of -0.17 — the lowest level recorded since September — as evidence that US-based buyers on Coinbase are consistently less aggressive than buyers on Binance. A negative Coinbase Premium means BTC is trading cheaper on Coinbase than on global reference exchanges, signaling weak demand from US institutional and retail participants at the precise moment the market needs them to absorb selling pressure.
The Coinbase Premium chart in Martinez’s thread shows uniformly negative (red, downward) bars across the entire measured window spanning approximately September 21 through late October. The BTC price line overlaid on the chart shows a sharp early decline, a partial recovery around early October, and then a renewed downward slope toward the right — with the current price marked at $80,130 on the chart annotation, sitting below both the $83,500 and $87,000 reference levels labeled on the right axis. This is a confirmed breakdown in price relative to those chart levels, with the Coinbase Premium near its most negative reading in the visible dataset.
The URPD Map — Where Supply Clusters and What Breaks Next
Martinez anchors his price level framework to Bitcoin’s UTXO Realized Price Distribution (URPD) — a snapshot of where BTC supply last changed hands, identifying zones of concentrated cost basis that tend to function as gravity for price. The URPD chart in his thread labels seven key price levels: $104,765 | $100,978 | $92,143 | $84,569 | $80,782 | $76,996 | $66,898.
The most significant concentration visible on the chart is clustered in the $80,782–$84,569 range, with the longest bars in the distribution occupying this zone. The hollow/outlined bar at $80,782 marks the current price area — approximately 1 million BTC of supply last moved near the $81,000 level according to Martinez’s thread text, making this the structural pivot.
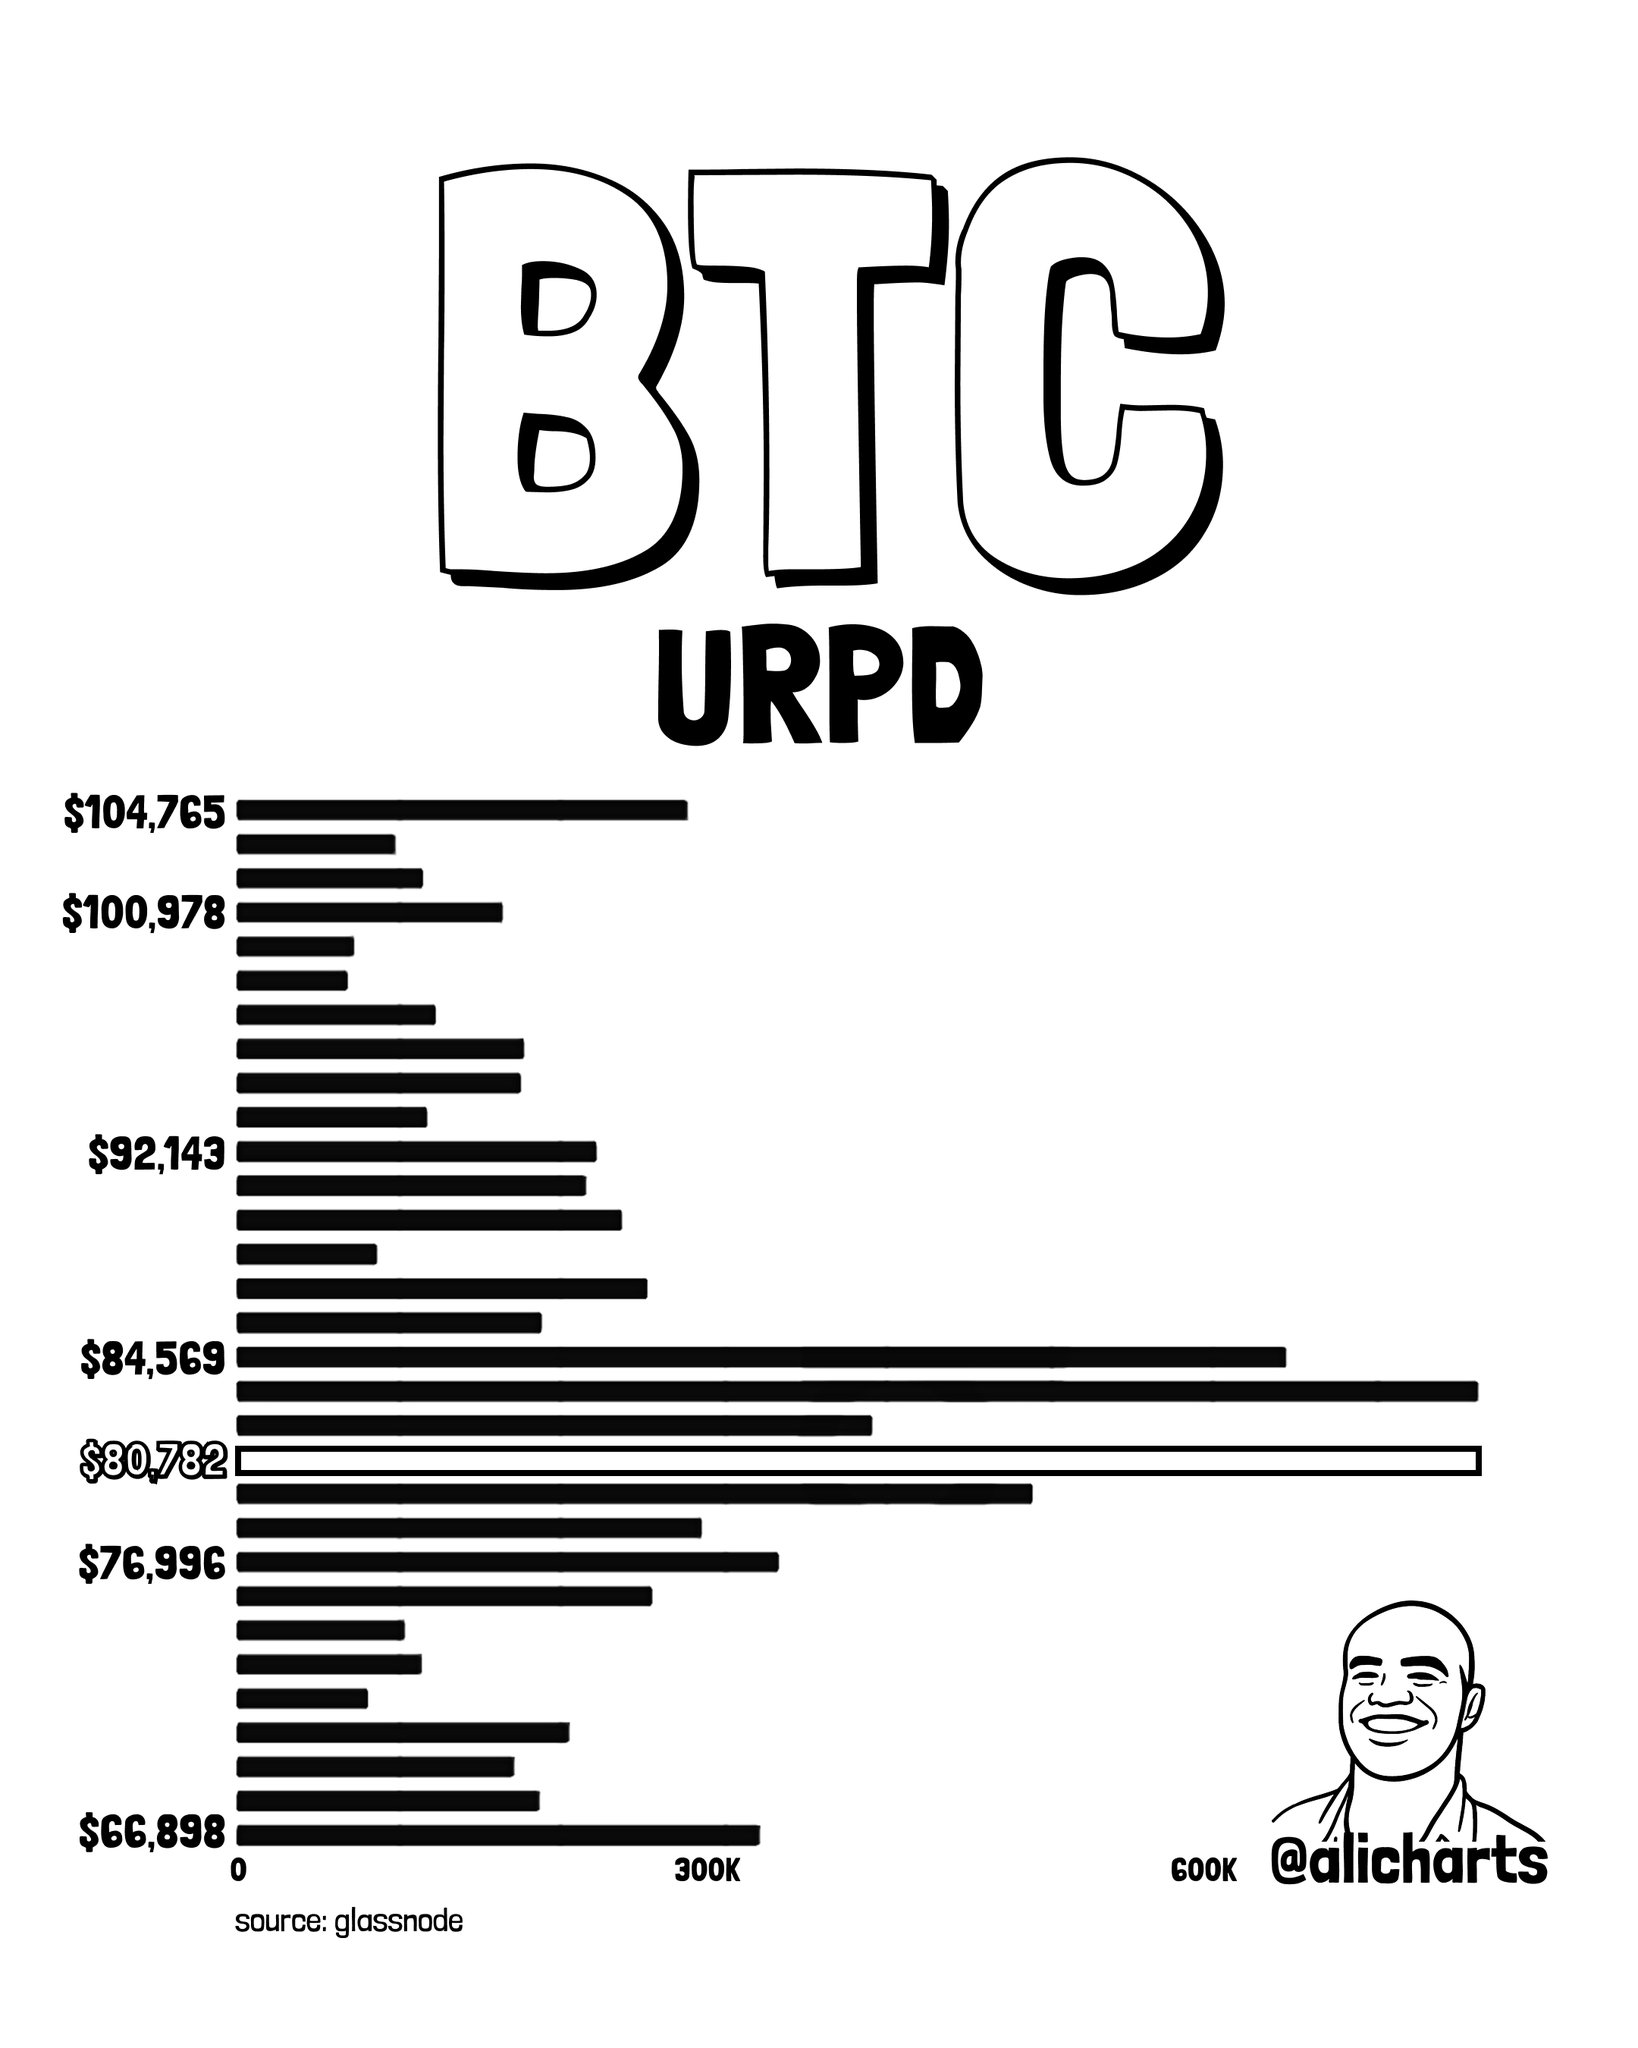
From this URPD map, Martinez derives the full level framework:
- $81,000 — key support (approximately 1M BTC traded here; must hold for the bull case)
- $84,500 — the bull flip level (~620K BTC traded; a clear reclaim opens the path to $92K and $104K)
- $77,000 — first downside target if $81K breaks
- $67,000 — secondary downside target, corresponding to a thinner supply zone below $76,996
- $92,000 and $104,000 — upside targets if $84,500 is reclaimed with conviction
The FOMC Context — Why the First Hour Is Not the Signal
Martinez is explicit about the FOMC timing dynamic: the first-hour reaction to a Fed decision is typically less than 1% in either direction, and the true directional signal emerges over a 24-hour to one-week window. That framing is what makes the on-chain pre-positioning data relevant — whale selling and Coinbase Premium deterioration happened before the decision resolved, suggesting large holders were not waiting for the announcement to reduce risk. They were already acting.
This pattern — where large Bitcoin holders move supply ahead of macro events — has appeared in prior high-stakes windows and tends to front-run the direction of the delayed reaction. It does not guarantee outcome, but it shifts the probability distribution.
The negative Coinbase Premium is particularly relevant in this context. US institutional participants — the marginal buyers who drove the ETF-era rally — are not stepping in at current prices. If the FOMC outcome triggers renewed risk appetite, that Premium should flip positive quickly. If it stays negative or deepens, it confirms that US demand is not absorbing the whale supply being released on-chain. Traders watching developments like leveraged positioning extremes across the market will recognize this dynamic.
Bullish Scenario
Bitcoin holds $81,000 as support and reclaims $84,500 — the level where approximately 620,000 BTC changed hands — on a sustained close. That reclaim would shift the URPD gravity to the upside and open intermediate targets at $92,000 and ultimately $104,000, where the next supply cluster sits per Martinez’s URPD analysis. The Coinbase Premium turning positive would serve as on-chain confirmation that US demand has re-engaged.
Bearish Scenario
A sustained loss of $81,000 — the ~1M BTC URPD cluster — removes the dominant support zone and opens a direct path to $77,000 as the next structural level. Below that, the URPD shows a thin supply zone, with $67,000 as the subsequent target. The Coinbase Premium remaining at or below -0.17 would confirm that institutional demand has not materialized to support the price.
Three independent on-chain signals — $156M in whale realized profits, an 8,162 BTC reduction in whale holdings worth $664M in 24 hours, and a Coinbase Premium of -0.17 (the lowest since September) — are converging in the same direction after the FOMC. Bitcoin at $81,297 sits directly on the URPD’s most concentrated supply cluster at $80,782–$81,000, making this zone the structural decision point for the post-FOMC window. Martinez’s framework is binary: hold $81K and reclaim $84,500 for the bull case, or lose $81K and face $77,000 then $67,000. Watch $84,500 — a sustained close above it is the single level that flips Martinez’s cautious framework to constructive.
Frequently Asked Questions
What does the -0.17 Coinbase Premium mean for Bitcoin right now?
What are the key Bitcoin price levels to watch after the FOMC?
Why did Bitcoin whales sell $664M worth of BTC in 24 hours before the FOMC?
How long does it take for Bitcoin to show its true post-FOMC direction?
Source: Ali Charts · Published by CoinsProbe Markets Desk
The opinions and market insights shared on CoinsProbe represent the views of individual authors based on prevailing market conditions at the time of publication. Cryptocurrency investments carry significant risk and volatility. Readers are encouraged to conduct their own research and seek professional financial advice before making investment decisions. CoinsProbe and its contributors do not accept responsibility for financial losses or decisions made based on published content.
CoinsProbe may publish sponsored articles, affiliate links, or promotional collaborations. All sponsored material is clearly labeled to maintain transparency with our audience. Our editorial decisions remain fully independent, and advertising partnerships do not influence reviews, rankings, or published opinions.
Since 2023, CoinsProbe has delivered reliable insights on cryptocurrency, blockchain, and digital assets. Our content is created by experienced researchers and analysts who follow strict editorial standards focused on accuracy, transparency, and credibility. Every article is carefully reviewed and verified using trusted sources and current market data. We provide unbiased analysis and timely updates covering everything from emerging crypto projects to major industry developments.