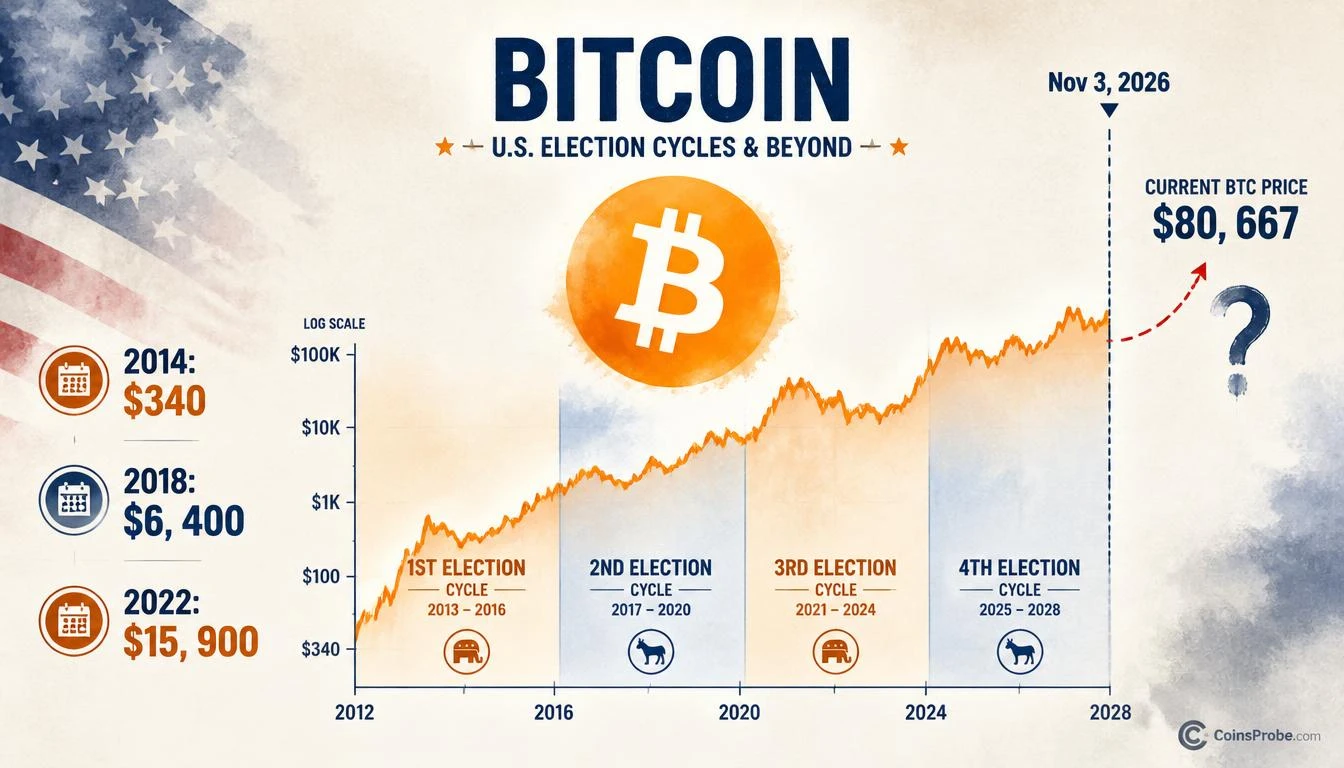

- Bitcoin trades at $80,667 — below $100K — as the Nov 3, 2026 US midterm election date approaches
- In each of the last three midterms, BTC was in a bear market: $340 (2014), $6,400 (2018), $15,900 (2022)
- 2018 precedent: BTC fell an additional 50% from $6,400 to $3,200 in the weeks after midterm day
- Pattern still forming per Alphractal's charts — no confirmed breakout or breakdown as of publication
Bitcoin is trading at $80,667 — up 0.45% in the past 24 hours — with a market cap of $1.62 trillion, as a recurring historical pattern tied to US midterm elections draws renewed scrutiny from analysts and investors alike. The question being asked: is November 3, 2026 another inflection point in this cycle, or is the pattern finally set to break?
Crypto analytics account Alphractal (@Alphractal) published a detailed chart thread on October 28, 2026, flagging what they describe as “a fascinating historical pattern surrounding the United States midterm elections that deserves investors’ attention.” The thread maps Bitcoin’s price behavior across four presidential election cycles, noting that during the last three midterm cycles, Bitcoin entered extended bear markets — a pattern that now points directly at November 3, 2026.
The Pattern — Three Midterms, Three Bear Markets
The historical record Alphractal presents is specific. In each of the last three US midterm election years, Bitcoin was already deep in a bear market by election day:
- November 4, 2014: BTC was trading at approximately $340 — well off its 2013 peak of $1,100, a drawdown exceeding 69%.
- November 6, 2018: BTC was at approximately $6,400 — and declined further to $3,200 by December, a post-election drop of an additional 50%.
- November 8, 2022: BTC was at approximately $15,900 — down from the 2021 cycle high of $69,000, a drawdown of approximately 77% from peak.
Price data for all three instances is corroborated by CoinMarketCap historical records and Blockchain.com charts. The pattern is not subtle — in each midterm year, Bitcoin arrived at election day already under significant pressure, and in at least one case (2018), selling continued aggressively into year-end after the vote.
Reading the Charts — What Alphractal’s Data Shows
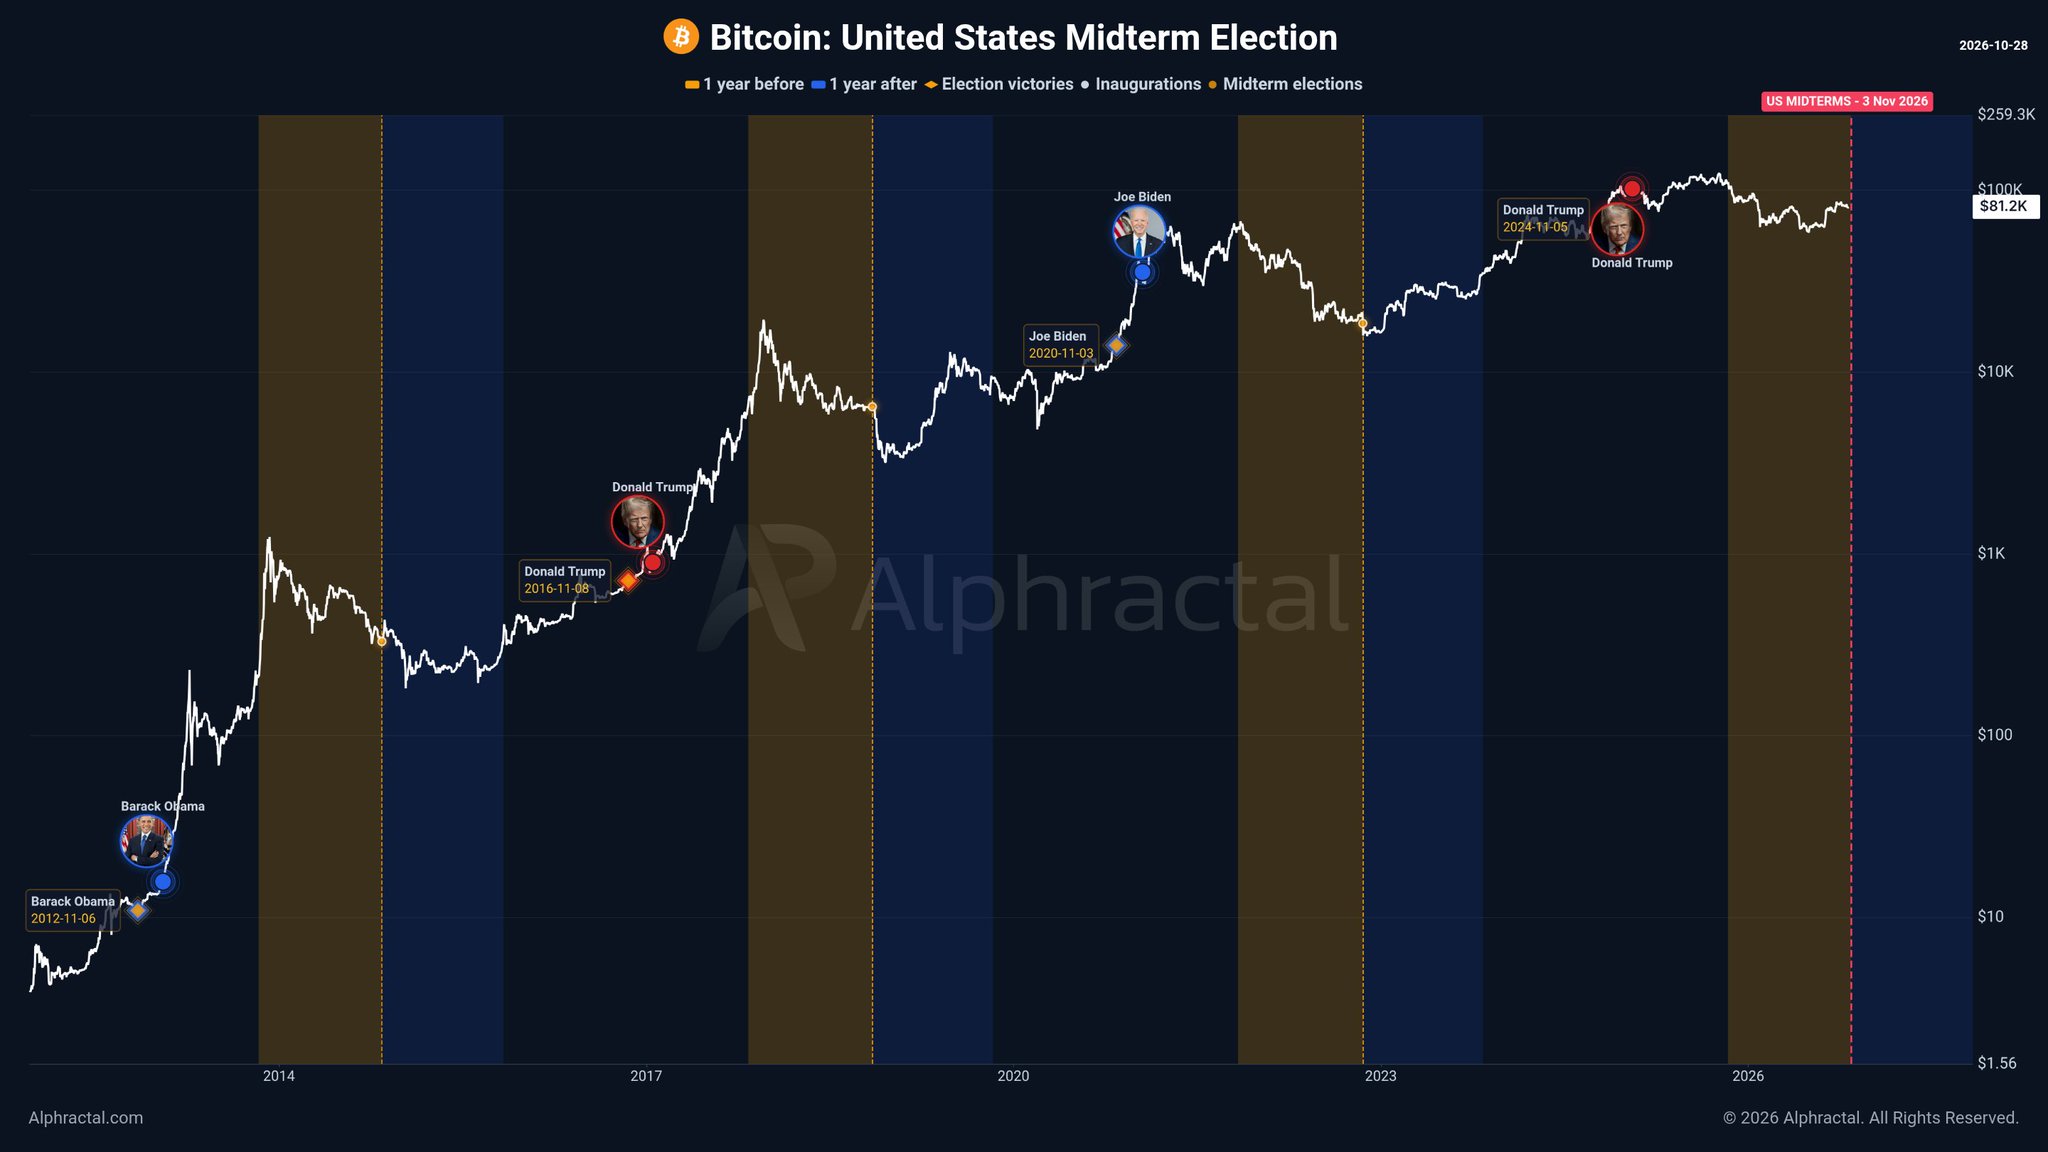
Alphractal’s first chart overlays Bitcoin’s logarithmic price history from approximately 2012 to 2026, with brown shading marking the 12 months before each election and blue shading marking the 12 months after. A dashed vertical line marks November 3, 2026 — the next US midterm date — with Bitcoin currently sitting at $81,200 according to the chart’s price annotation, below the $100K axis level. The current price, per the live ticker at time of writing, is $80,667.
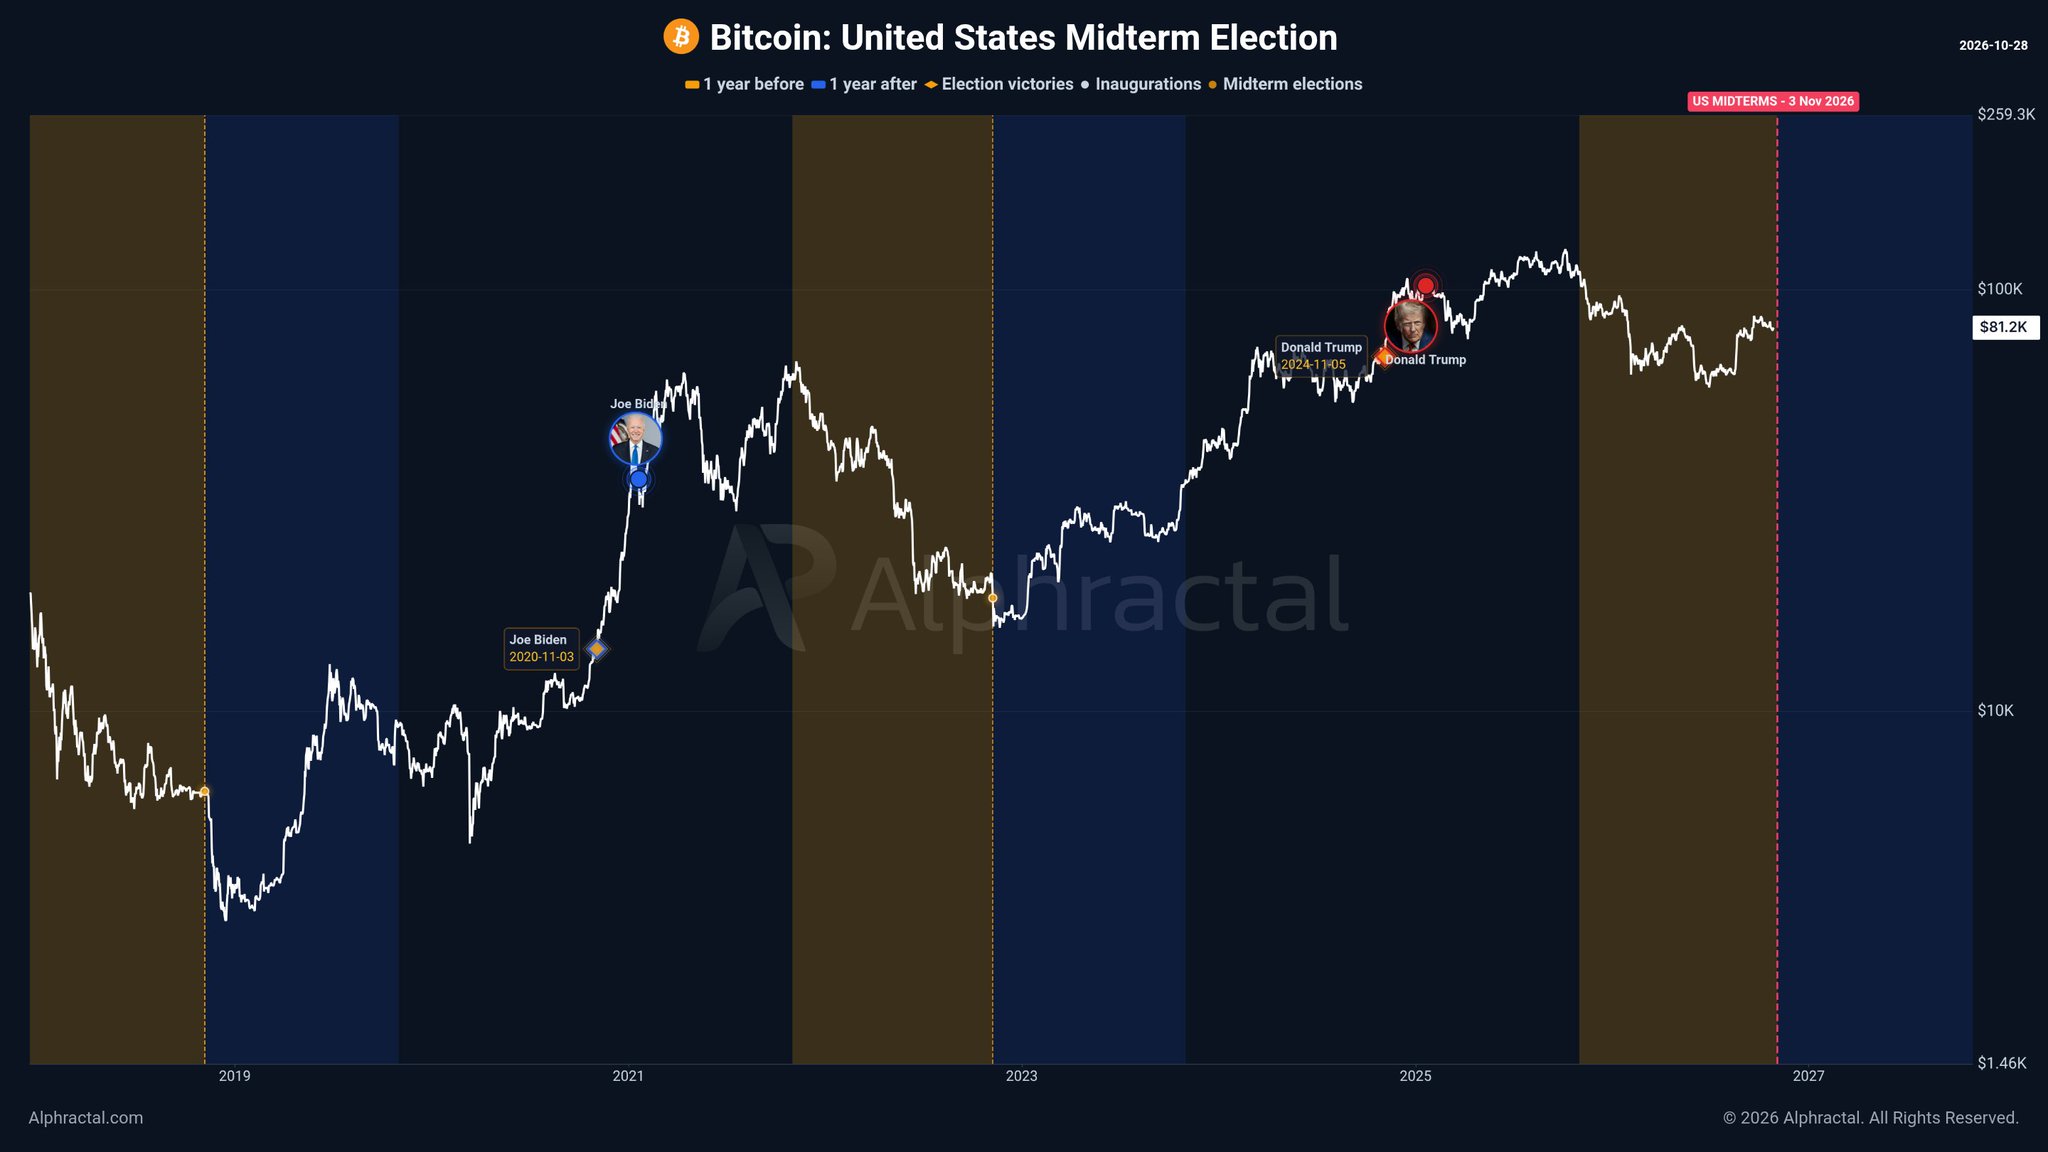
The second chart narrows the view to approximately 2018–2027, showing two complete election cycles under the Biden and Trump administrations. The structure is consistent: price declines or consolidates in the brown pre-election zone, then recovers and rallies during the post-election blue zone. A third cycle is now forming, with Bitcoin approaching the November 3, 2026 midterm window from below the $100K threshold. Both charts carry the status PATTERN STILL FORMING — the midterm date has not yet arrived on the chart’s timeline, and no breakout or breakdown has been confirmed.
Correlation vs. Causation — What the Data Actually Says
The pattern is visually compelling. The analytical case for it, however, requires careful framing. Bitcoin has only existed through four US midterm election cycles — 2014, 2018, 2022, and now 2026. A sample size of three prior instances is not a statistical law. It is a correlation that warrants monitoring, not a confirmed causal mechanism.
Each of the three prior midterm bear markets also coincided with independent, named catalysts: the collapse of Mt. Gox dominated 2014 sentiment; the 2018 crypto winter followed an ICO bubble and regulatory crackdown; the November 2022 bear market arrived in the wake of the FTX collapse — one of the most significant exchange failures in crypto history. No statement from the Federal Reserve, the SEC, or any major exchange has established a direct link between midterm election cycles and Bitcoin price performance. The political calendar did not cause those crashes — it happened to overlap with them.
That said, election-year macro volatility is real and documented. Uncertainty around fiscal policy, regulatory posture, and Congressional composition does historically compress risk appetite across asset classes. Bitcoin, as the highest-beta liquid asset available, tends to amplify whatever macro risk environment surrounds it.
Where Bitcoin Stands Now — The Setup Into November 3
At $80,667, Bitcoin is approximately 19.3% below the $100K psychological threshold marked on Alphractal’s chart. The current cycle peak reached above $100K in prior months, meaning the drawdown pattern from cycle high to midterm date is already underway — consistent with the prior three instances. Whether the post-midterm blue-zone recovery materializes as it has in 2015, 2019, and 2023 is the operative question for the remainder of the cycle.
Bitcoin’s open interest dynamics remain elevated — Bitcoin OI has already exceeded the 6-year median in 2026 — which means any sharp move into or through November 3 will be amplified by derivatives positioning. Meanwhile, institutional flows via spot ETFs and corporate treasury activity continue to provide a structural demand floor that did not exist in any of the three prior midterm cycles. Strategy and other BTC treasury companies represent a class of price-insensitive buyers with no historical precedent in 2014, 2018, or 2022 data.
That structural difference is material. The pattern Alphractal identifies is built on three data points, all from an era before spot Bitcoin ETFs existed, before corporate treasury adoption was normalized, and before Bitcoin had achieved a $1.6 trillion market cap. Whether those structural changes alter the pattern’s behavior in 2026 remains, for now, an open empirical question.
Bullish Scenario
If November 3, 2026 marks the cyclical low consistent with prior midterm bottoms — as occurred in late 2014, early 2019, and early 2023 — the post-midterm blue zone historically initiated multi-month recoveries. Reclaiming $100K after the midterm date would structurally confirm the pattern’s bullish second half is active.
Bearish Scenario
If Bitcoin continues declining into and through November 3 without stabilizing, the 2018 precedent is the relevant analog — where election day at $6,400 preceded a further 50% drop to $3,200 by December. In that scenario, the pattern would not be invalidated; it would be repeating its most severe instance.
The three-cycle pattern Alphractal documents is real in the historical record — Bitcoin at $340, $6,400, and $15,900 on successive midterm election days. Whether that correlation reflects anything causal, or whether the structural transformation of Bitcoin’s market since 2022 renders the prior sample obsolete, will be answered by price action between now and November 3, 2026, and in the months that follow. Watch $100K as the line that separates pattern repetition from pattern evolution.
Frequently Asked Questions
Has Bitcoin always crashed during US midterm elections?
What happens to Bitcoin after US midterm elections historically?
Is the 2026 midterm situation different from 2014, 2018, or 2022?
What price level must Bitcoin reclaim to break the bearish midterm pattern?
Source: Alphractal · Published by CoinsProbe Markets Desk
The opinions and market insights shared on CoinsProbe represent the views of individual authors based on prevailing market conditions at the time of publication. Cryptocurrency investments carry significant risk and volatility. Readers are encouraged to conduct their own research and seek professional financial advice before making investment decisions. CoinsProbe and its contributors do not accept responsibility for financial losses or decisions made based on published content.
CoinsProbe may publish sponsored articles, affiliate links, or promotional collaborations. All sponsored material is clearly labeled to maintain transparency with our audience. Our editorial decisions remain fully independent, and advertising partnerships do not influence reviews, rankings, or published opinions.
Since 2023, CoinsProbe has delivered reliable insights on cryptocurrency, blockchain, and digital assets. Our content is created by experienced researchers and analysts who follow strict editorial standards focused on accuracy, transparency, and credibility. Every article is carefully reviewed and verified using trusted sources and current market data. We provide unbiased analysis and timely updates covering everything from emerging crypto projects to major industry developments.