- AAVE is trading at $111.13 — down 10.51% in 24h and 28.99% over 30 days, entering a pre-defined buy zone
- One analyst confirmed entry into the $91–$120 buying zone, backed by $18B TVL and $1M+ daily fees
- Key invalidation level: a daily close below $91 would breach the analyst's defined support zone
AAVE is trading at $111.13 — down 10.51% in the past 24 hours, 14.05% over seven days, and 28.99% over the past 30 days — and has now landed precisely inside a buying zone one analyst flagged weeks in advance. The pullback, which looked alarming in price terms, was the anticipated entry window all along.
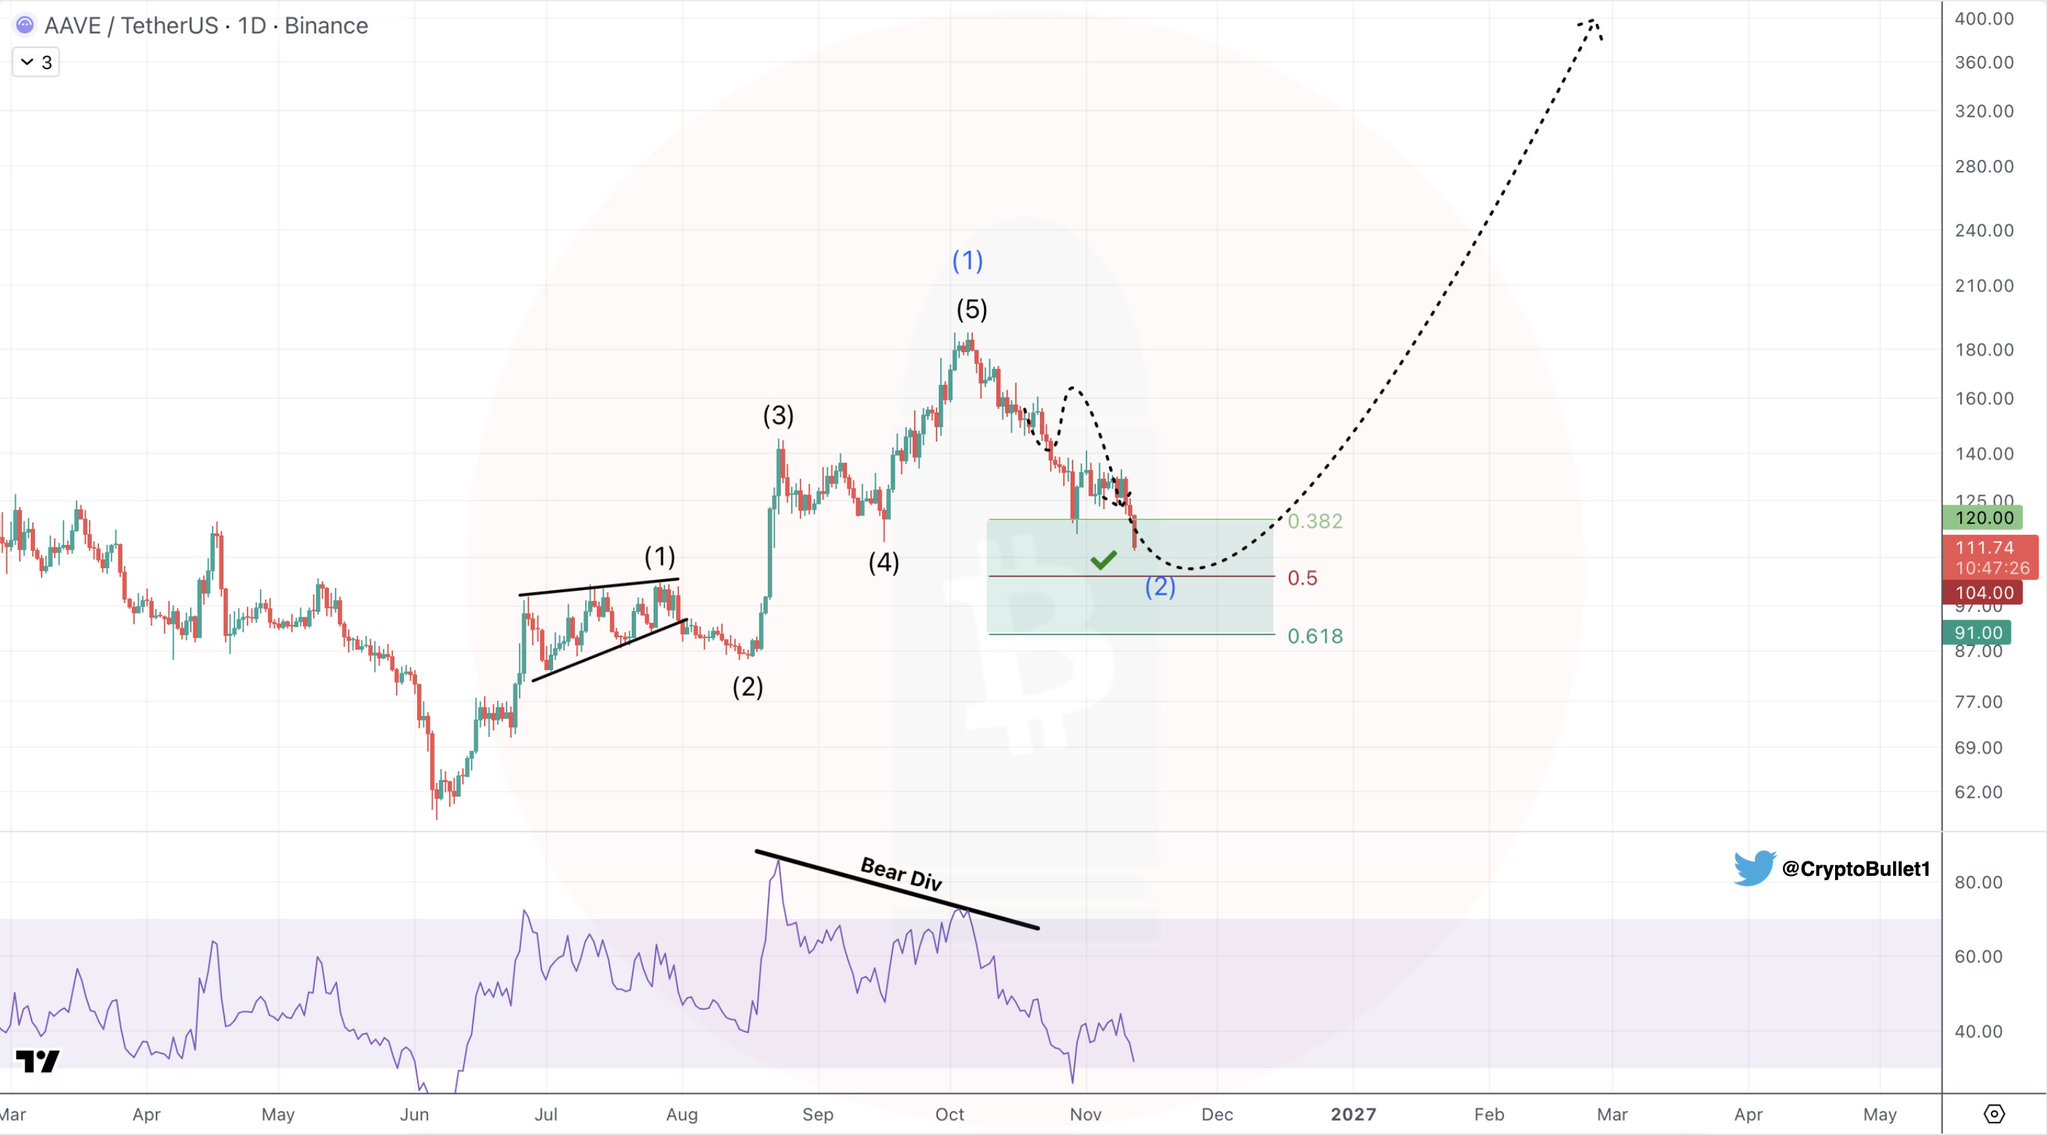
An analyst who goes by the handle CryptoBullet1 on X posted a 1-day AAVE update confirming the move: “Going down as expected — Entered my Buying Zone” The buy zone, which the analyst had defined in an earlier post dated October 16, 2026, spans $91 to $120 and was justified on two fundamental pillars: $18 billion in total value locked and over $1 million in daily protocol fees.
What the Chart Shows
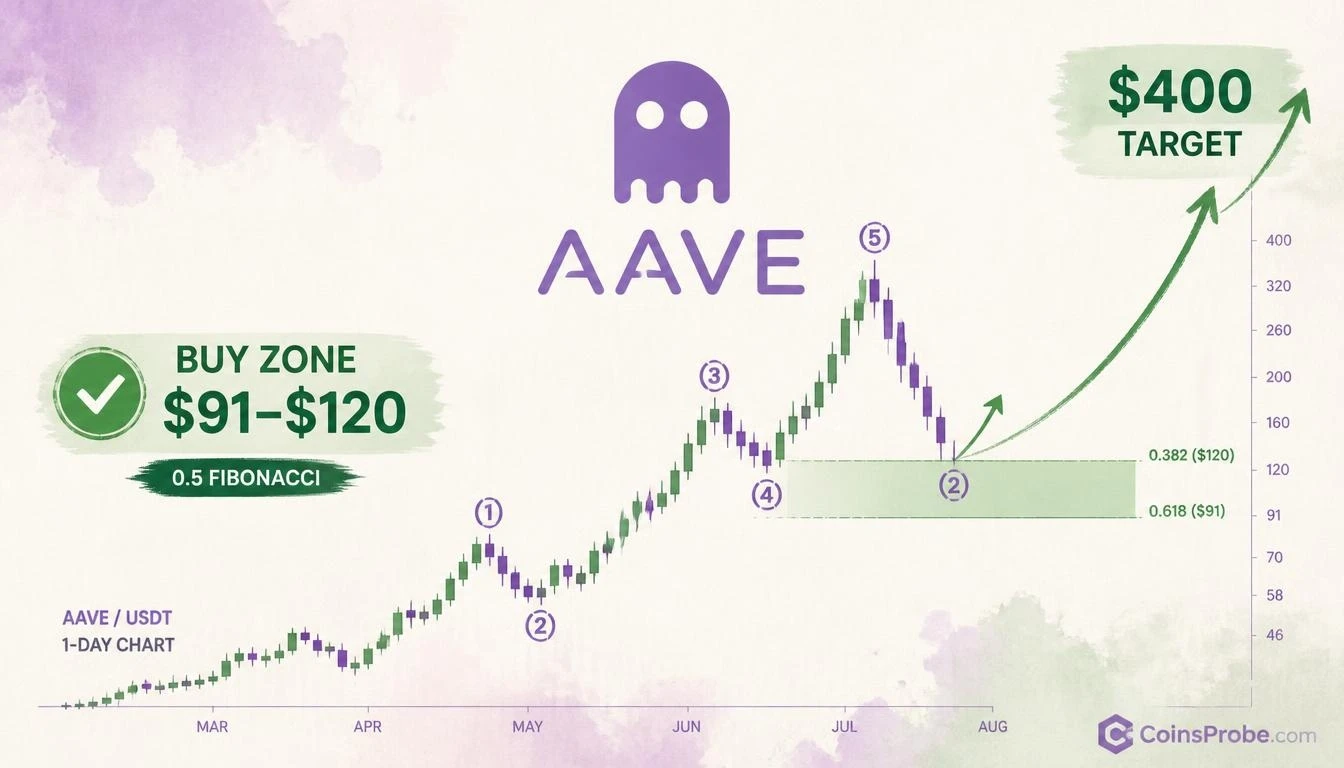
The 1-day AAVE/USDT chart shared by the analyst reveals an Elliott Wave structure — a five-wave impulse sequence labeled (1) through (5) upward, now followed by a corrective phase. Price has retraced into a Fibonacci-defined support zone, with the analyst marking a green buying rectangle between the 0.382 and 0.618 retracement levels. A green checkmark sits at the 0.5 Fibonacci level, labeled as wave (2) of the corrective sequence — the analyst’s designated support zone. At time of writing, AAVE is sitting within that shaded zone, below the 0.382 retracement level, with the chart projecting a bullish recovery arc toward the prior cycle highs near $400. The oscillator below the price bars shows bear divergence, which is consistent with momentum exhaustion during a corrective wave — not necessarily continued breakdown. Key price axis values on the chart include $120, $111.74, $104, and $91 — all within the defined buy zone.
Why the $91–$120 Zone — The Fundamental Case
The buying zone is not arbitrary. When the analyst first defined $91–$120 on October 16, 2026, two on-chain metrics underpinned it. First, AAVE’s protocol TVL stood at $18 billion — placing it among the largest DeFi lending protocols by locked capital. Second, the protocol was generating over $1 million in daily fees, confirming active utilization rather than idle capital. For a protocol priced at a $1.72 billion market cap at current prices, $1 million in daily fees represents a fee-to-market-cap ratio that is difficult to dismiss as speculative froth. The analyst’s thesis was straightforward: at the right retracement level, fundamentals would absorb the technical selling pressure. AAVE has now reached that level. For broader context on how DeFi fundamentals interact with institutional positioning in this cycle, see Bitcoin Large-Holder Concentration Hits Historic Low — What NDF Is Signaling.
The Mechanics of a Wave (2) Corrective Pullback
Elliott Wave theory labels corrective waves as retracements against the prior impulse. A wave (2) correction, by definition, cannot retrace below the origin of wave (1) without invalidating the broader bullish count. The analyst’s placement of wave (2) at the 0.5 Fibonacci level is a standard corrective target — deep enough to shake out weak holders, shallow enough to preserve the larger structure. If the wave count is correct, the next leg would be wave (3) — historically the strongest and most extended impulse phase in any Elliott sequence. The analyst’s projected recovery arc toward $400 on the chart reflects that expectation. What matters now is whether AAVE holds within the $91–$120 zone and builds a base before the next directional move.
Is the Rally Sustainable — What to Watch
Three metrics will determine whether the buy zone delivers on its premise. First, protocol TVL must hold near $18 billion — a sustained decline would undercut the fundamental rationale. DeFiLlama’s real-time AAVE TVL figures update continuously and are the cleanest measure to track. Second, daily fees need to remain above $1 million — fee compression would signal reduced borrowing demand, which is the core driver of AAVE’s revenue model. Third, price must not close on a daily basis below $91 — that is the lower boundary of the analyst’s defined zone and, on the Elliott Wave count, the level whose loss would call the broader bullish structure into question.
Bullish Scenario — Hold of $91 and Base Formation
If AAVE holds within $91–$120 and constructs a basing pattern at the 0.5 Fibonacci level, the Elliott Wave structure projects a wave (3) advance. The analyst’s recovery arc on the chart targets the prior cycle high zone near $400. That would represent approximately +260% from the current price of $111.13 — consistent with a third-wave extension in a structure where wave (1) covered a comparable distance.
Bearish Scenario — Loss of $91
A sustained daily close below $91 would breach the lower boundary of the analyst’s defined buy zone and invalidate the wave (2) low thesis. Below $91, the next meaningful Fibonacci support sits near the 0.618 retracement of the prior impulse. The analyst has not defined a target below $91 — meaning a close beneath it would be outside the stated parameters of this setup entirely.
AAVE’s 29% monthly decline brought it to exactly where one analyst said he would buy. At $111.13, the asset is inside the $91–$120 zone, sitting at the 0.5 Fibonacci retracement of a five-wave impulse, with $18 billion in TVL and $1 million in daily fees as the fundamental floor beneath the technical setup. Watch $91 as the line that keeps the trade thesis structurally intact.
Frequently Asked Questions
What is AAVE’s current buy zone and who defined it?
What invalidates the bullish Elliott Wave setup on AAVE?
What fundamentals support buying AAVE at current levels?
What is the analyst’s projected upside target from the buying zone?
Source: Cryptobullet1 · Published by CoinsProbe Markets Desk
The opinions and market insights shared on CoinsProbe represent the views of individual authors based on prevailing market conditions at the time of publication. Cryptocurrency investments carry significant risk and volatility. Readers are encouraged to conduct their own research and seek professional financial advice before making investment decisions. CoinsProbe and its contributors do not accept responsibility for financial losses or decisions made based on published content.
CoinsProbe may publish sponsored articles, affiliate links, or promotional collaborations. All sponsored material is clearly labeled to maintain transparency with our audience. Our editorial decisions remain fully independent, and advertising partnerships do not influence reviews, rankings, or published opinions.
Since 2023, CoinsProbe has delivered reliable insights on cryptocurrency, blockchain, and digital assets. Our content is created by experienced researchers and analysts who follow strict editorial standards focused on accuracy, transparency, and credibility. Every article is carefully reviewed and verified using trusted sources and current market data. We provide unbiased analysis and timely updates covering everything from emerging crypto projects to major industry developments.