- XRP trades at $1.018 (-2.23% 24h), completing a full channel reversal from the $1.55 resistance peak
- Analyst flags $0.99 as the channel's lower boundary — the critical support that must hold
- Loss of $0.99 opens the analyst's stated downside target of $0.80, a further 21.4% decline
- XRP spot ETFs logged 5 consecutive outflow days totaling -$18.0M per SoSoValue data
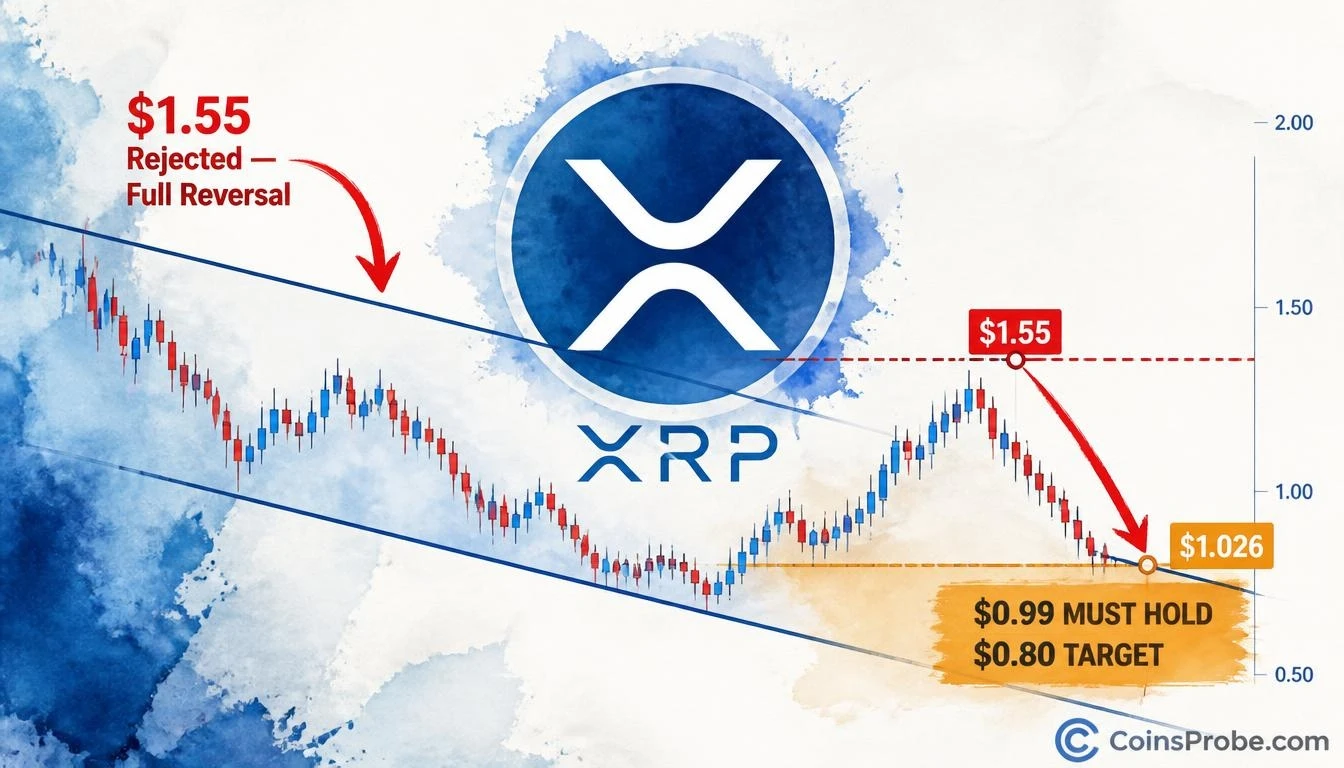
XRP is trading at $1.018 — down 2.23% in the last 24 hours and carrying a market cap of $64.6 billion — after completing what one analyst describes as a full reversal of every gain accumulated during the latest channel rally. The price action is not ambiguous: XRP failed at $1.55, reversed completely, and is now sitting at the channel’s lower boundary. The only question left is whether that boundary holds.
An analyst who goes by the handle behind one of crypto’s most-followed chart accounts flagged the breakdown on November 13, 2026, with a direct assessment: XRP has completed a full reversal from the $1.55 resistance at the top of the channel toward the lower boundary at $0.99. The call was not hedged — “$0.99 must hold. If XRP loses this support, the correction could extend.” The analyst had flagged the same channel structure a week earlier, on November 7, 2026, noting that XRP had already broken below mid-range support and was targeting the lower boundary near $0.99.
The Channel Breakdown — From $1.55 to $1.026
The 3-day chart shared by the analyst reveals the full arc of XRP’s failed breakout attempt. Price rallied from the channel’s lower boundary earlier in the cycle, curved upward through intermediate resistance levels at $1.13, $1.29, and $1.40, and ultimately stalled at $1.55 — the top of the descending channel. The rejection at $1.55 was total. Price has since completed a full roundtrip, breaking back below every intermediate level and arriving at the lower boundary near $1.026 at time of writing. The chart labels this zone with a black box and an upward arrow — marking it as the critical decision point for XRP’s next directional move.
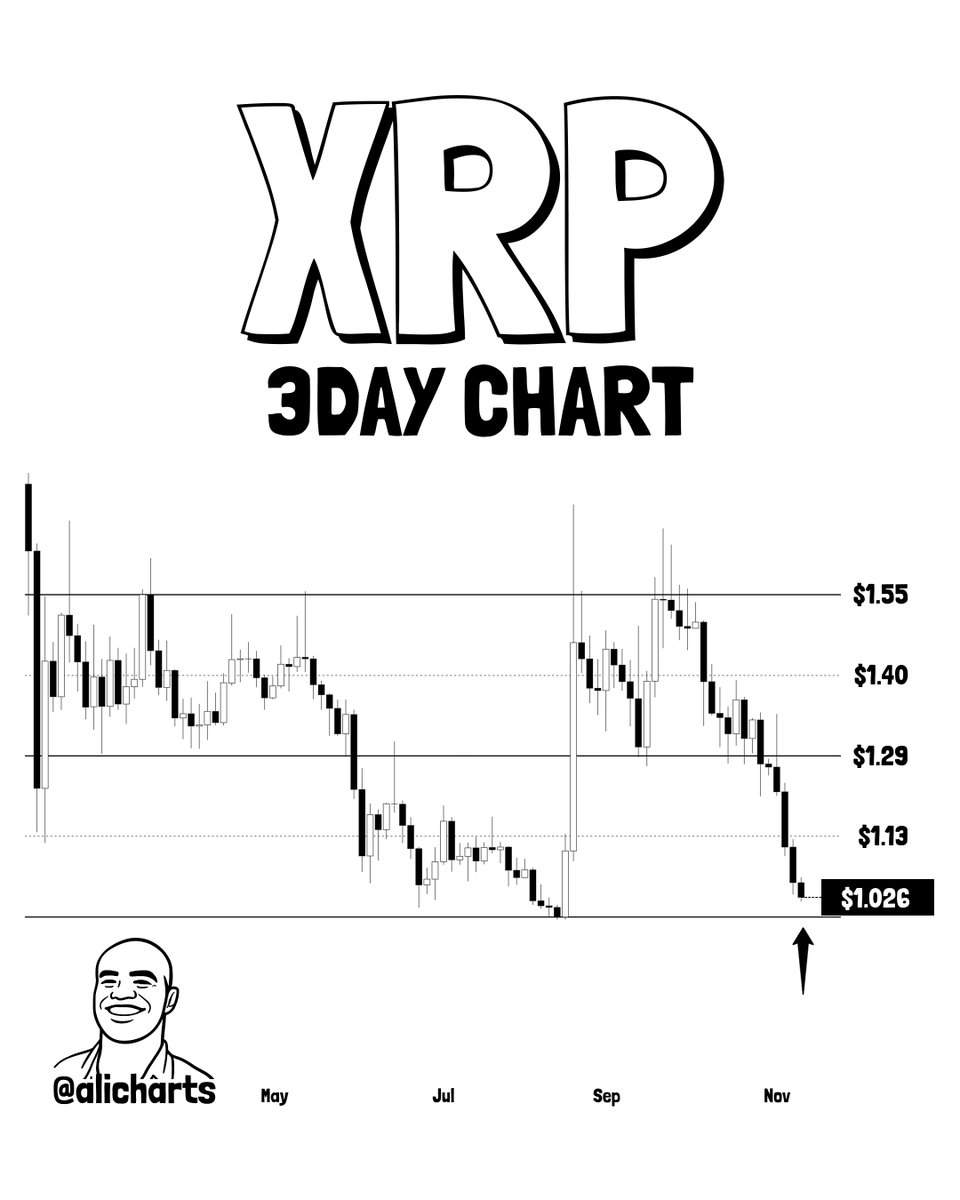
What makes this breakdown structurally significant is the sequence of failures on the way down. XRP did not simply pull back from $1.55 — it broke below $1.40, then $1.29, then $1.13, confirming each level as resistance on the reversal. By the time price reached $1.026, the entire channel rally had been erased. Every buyer who entered during the upswing is now at breakeven or underwater. The lower boundary at $0.99 is the final technical argument that the channel structure remains intact.
$0.99 — The Line Between Channel Support and Open Breakdown
The analyst is explicit: $0.99 is the channel’s lower boundary and the support level that must hold for the broader structure to remain valid. At the time of writing, XRP is at $1.018 — roughly 2.8% above that level. The proximity is tight enough that a single heavy session could resolve the question.
If $0.99 gives way, the analyst’s stated next downside target is $0.80. That would represent an additional 21.4% decline from the $0.99 level and a total drawdown of approximately 48.4% from the $1.55 peak. There are no intermediate levels cited between $0.99 and $0.80 in the analyst’s framework — the implication is that a loss of channel support opens a relatively unobstructed move to the lower target. For context on where XRP has traded within structured channel environments before, see this earlier analysis: XRP Hits Descending Channel Support — Analyst Eyes 13% Bounce to $1.30.
ETF Flows Add a Structural Layer to the Technical Picture
Institutional data via SoSoValue adds context that the chart alone cannot provide. XRP spot ETFs logged zero daily net inflow on the most recent trading date (November 12, 2026), with the past five trading days producing a net outflow of $18.0 million — five consecutive outflow sessions. Total ETF net assets sit at $1.16 billion, with cumulative net inflows since launch at $1.79 billion, but the recent flow trend runs in the same direction as the chart: away from XRP.
Daily ETF trading volume of $33.7 million is not negligible — it reflects active positioning — but the absence of net inflows during a period when XRP is testing channel support is a meaningful overlay. Institutional buyers are not stepping in aggressively at the current level. That changes the dynamic at $0.99: a hold there would need to be driven by organic spot demand, not ETF-driven institutional accumulation.
Macro Events That Could Force the Decision
Several macro data releases in the coming days could act as the external trigger that resolves XRP’s current technical standoff. PPI is due November 13, Retail Sales on November 17, and Core PCE Price Index and GDP (QoQ) on November 25. Any macro shock that pressures risk assets broadly could be the event that tests whether $0.99 is genuine channel support or a temporary resting point before the next leg lower.
Bearish Scenario — Loss of $0.99
A confirmed daily close below $0.99 removes the channel’s lower boundary as support. The analyst’s stated next target is $0.80 — a 21.4% extension from $0.99 and a level not seen in XRP’s recent channel structure. A break here would confirm that the entire descending channel pattern has broken down structurally, not just experienced a pullback within range.
Bullish Scenario — Hold and Reclaim of $1.13
If $0.99 holds as channel support and XRP begins recovering intermediate levels, the first confirmation would require a reclaim of $1.13 — the lowest of the broken intermediate supports. A sustained close back above $1.13 would shift the structure from a breakdown confirmation back to a channel bounce scenario. Until that reclaim occurs, the breakdown remains the operative read.
The technical picture is clear: XRP executed a full reversal from $1.55, broke every intermediate level on the way down, and is now at the channel’s last line of defense at $0.99. The analyst’s framework gives no floor between $0.99 and $0.80 if that boundary fails. With ETF outflows running for five consecutive sessions and macro risk events ahead, the pressure on that level is building from multiple directions. Watch $0.99 as the level that determines whether this is a channel low or the beginning of a deeper correction to $0.80.
Frequently Asked Questions
What is XRP’s key support level after the channel reversal?
What happens to XRP if $0.99 breaks?
Are XRP ETF flows supporting the price at current levels?
What would signal that XRP’s channel breakdown has reversed?
Source: Ali Charts · Published by CoinsProbe Markets Desk
The opinions and market insights shared on CoinsProbe represent the views of individual authors based on prevailing market conditions at the time of publication. Cryptocurrency investments carry significant risk and volatility. Readers are encouraged to conduct their own research and seek professional financial advice before making investment decisions. CoinsProbe and its contributors do not accept responsibility for financial losses or decisions made based on published content.
CoinsProbe may publish sponsored articles, affiliate links, or promotional collaborations. All sponsored material is clearly labeled to maintain transparency with our audience. Our editorial decisions remain fully independent, and advertising partnerships do not influence reviews, rankings, or published opinions.
Since 2023, CoinsProbe has delivered reliable insights on cryptocurrency, blockchain, and digital assets. Our content is created by experienced researchers and analysts who follow strict editorial standards focused on accuracy, transparency, and credibility. Every article is carefully reviewed and verified using trusted sources and current market data. We provide unbiased analysis and timely updates covering everything from emerging crypto projects to major industry developments.