Date: Mon, Jan 13, 2025, 05:16 PM GMT
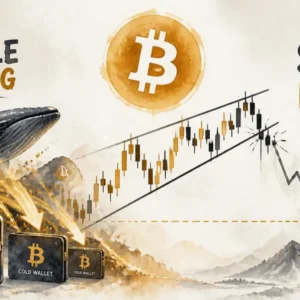
In the cryptocurrency market today, the ongoing correction that began last month has intensified. Bitcoin (BTC) experienced a 3% decline, touching a low of $89,260 before recovering slightly to its current price above of $91,000. This decline has contributed to a sharp rise in BTC dominance, which now sits at 58.60%, exerting bearish pressure on altcoins across the board.
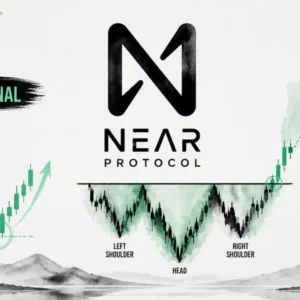
One of the altcoins feeling the weight of this correction is NEAR Protocol (NEAR), a blockchain project with a strong focus on AI and scalability. NEAR has dropped over 10% in the last 24 hours and is now trading at $4.54.

However, the recent price action suggests that this dip could be a pivotal moment for the token.
Retesting a Major Breakout
NEAR Protocol recently marked a significant milestone by breaking out of a descending triangle pattern that had constrained its price action for nearly three years. The breakout, which occurred on November 17, 2024, saw NEAR surge above the key descending trendline, hitting a high of $8.24. This event signaled the end of a prolonged accumulation phase and sparked renewed optimism about the project’s long-term potential.

The current market conditions, however, have brought NEAR back to a critical juncture. The token is now retesting the breakout trendline, a crucial support level that has so far held firm. NEAR showing resilience at its current price of $4.54, indicating that buyers are stepping in to defend this zone.
If NEAR manages to sustain this support and rebound, it could target its immediate resistance zone at $8.24, aligning with the highs it achieved post-breakout. Beyond that, the long-term projection for NEAR remains highly bullish, with a midterm target of $20, representing a potential 350% gain from current levels.
Could This Be the Final Dip?
The repeated successful tests of the breakout trendline suggest that NEAR might be nearing the end of its corrective phase.
On the flip side, a breakdown below the trendline could invalidate the breakout, introducing additional downside risks. However, given the current technical setup, this scenario seems less likely.
Adding to this dynamic, BTC dominance has reached 58.60%, almost on the upper resistance of its falling wedge pattern. Previously, BTC dominance has faced rejections at this level, which often leads to altcoin recoveries.

If BTC dominance once again gets rejected, altcoins like NEAR could experience a relief rally, further solidifying the token’s bullish outlook.
Conclusion
NEAR Protocol’s price action paints a picture of resilience amid market-wide turbulence. The token’s ability to hold above its breakout trendline will be crucial in determining its next move. With BTC dominance nearing a critical resistance and the broader altcoin market looking for relief, NEAR is well-positioned to capitalize on a potential recovery.
Investors should keep an eye on the $4.50 support level and watch for signs of bullish momentum. If the trendline holds, this dip may very well be the last chance to accumulate NEAR before a significant rally.

Disclaimer: This article is for informational purposes only and should not be considered financial advice. Always conduct thorough research before making investment decisions.
The opinions and market insights shared on CoinsProbe represent the views of individual authors based on prevailing market conditions at the time of publication. Cryptocurrency investments carry significant risk and volatility. Readers are encouraged to conduct their own research and seek professional financial advice before making investment decisions. CoinsProbe and its contributors do not accept responsibility for financial losses or decisions made based on published content.
CoinsProbe may publish sponsored articles, affiliate links, or promotional collaborations. All sponsored material is clearly labeled to maintain transparency with our audience. Our editorial decisions remain fully independent, and advertising partnerships do not influence reviews, rankings, or published opinions.
Since 2023, CoinsProbe has delivered reliable insights on cryptocurrency, blockchain, and digital assets. Our content is created by experienced researchers and analysts who follow strict editorial standards focused on accuracy, transparency, and credibility. Every article is carefully reviewed and verified using trusted sources and current market data. We provide unbiased analysis and timely updates covering everything from emerging crypto projects to major industry developments.