
- UNI is up 42.4% over the past 30 days, reflecting renewed investor interest in revenue-generating DeFi protocols.
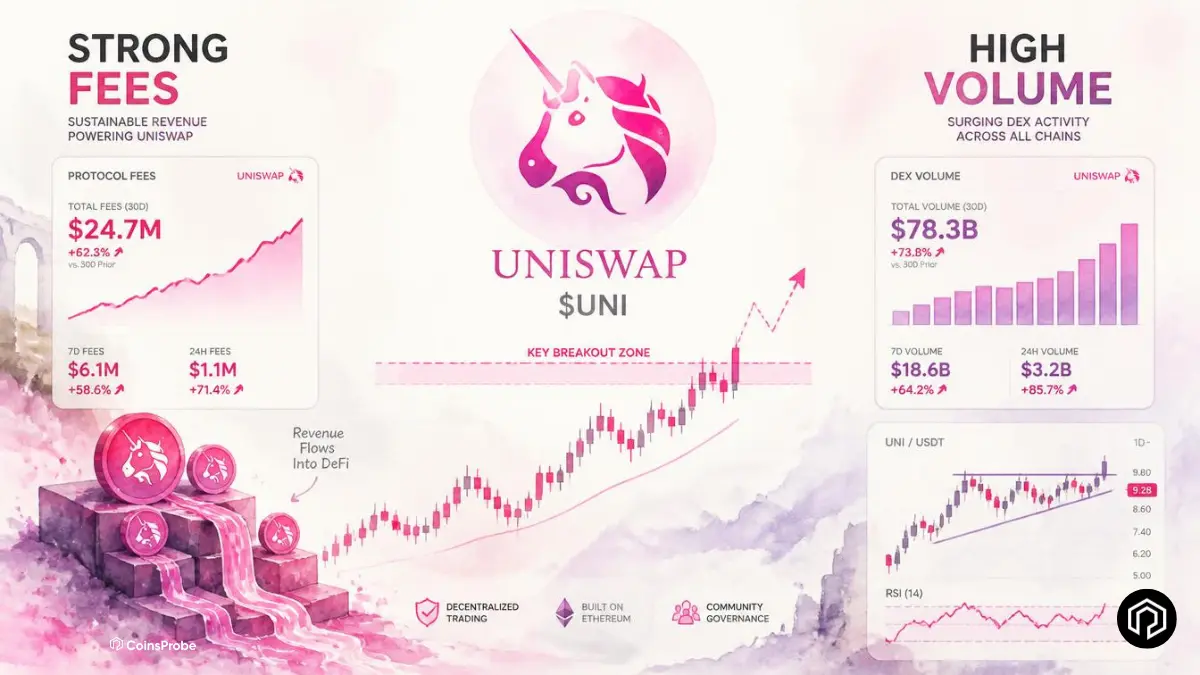
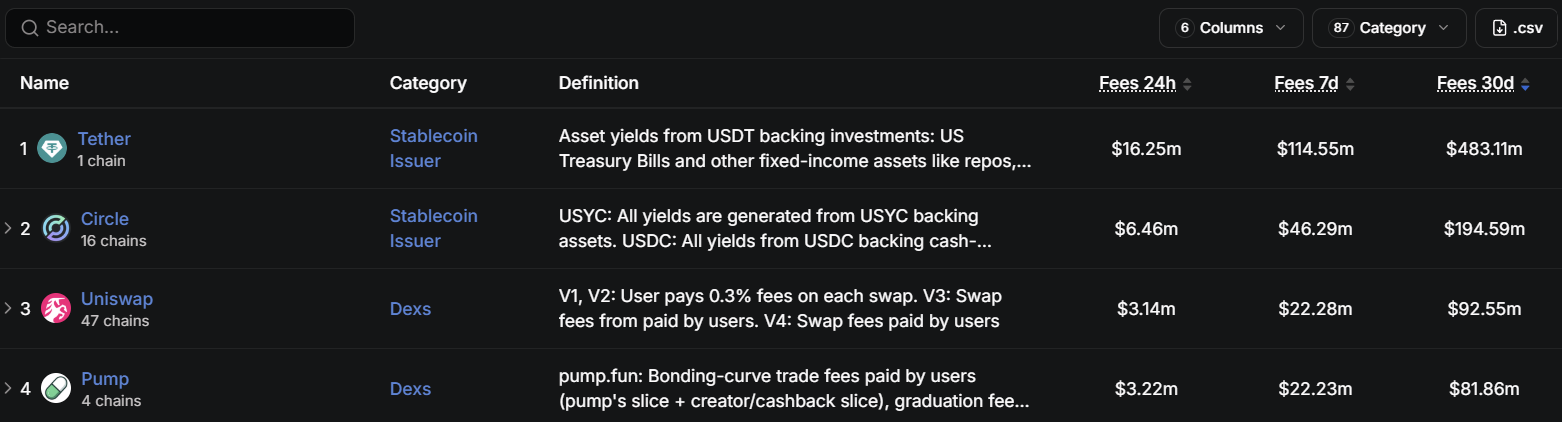
- Uniswap ranks #3 in protocol fees, generating $92.5M over the last 30 days.
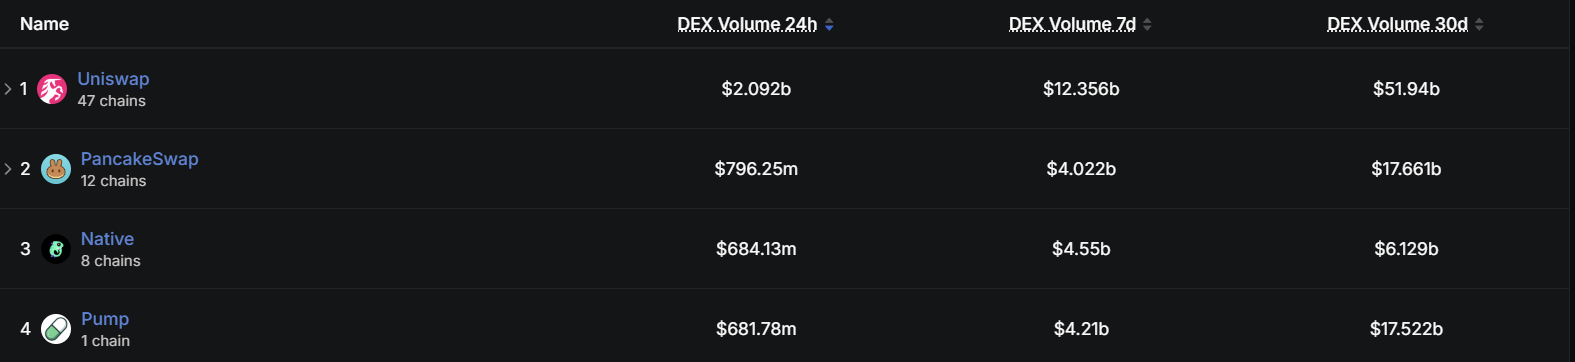
- It also remains the largest DEX by trading volume, processing nearly $52B in monthly volume.
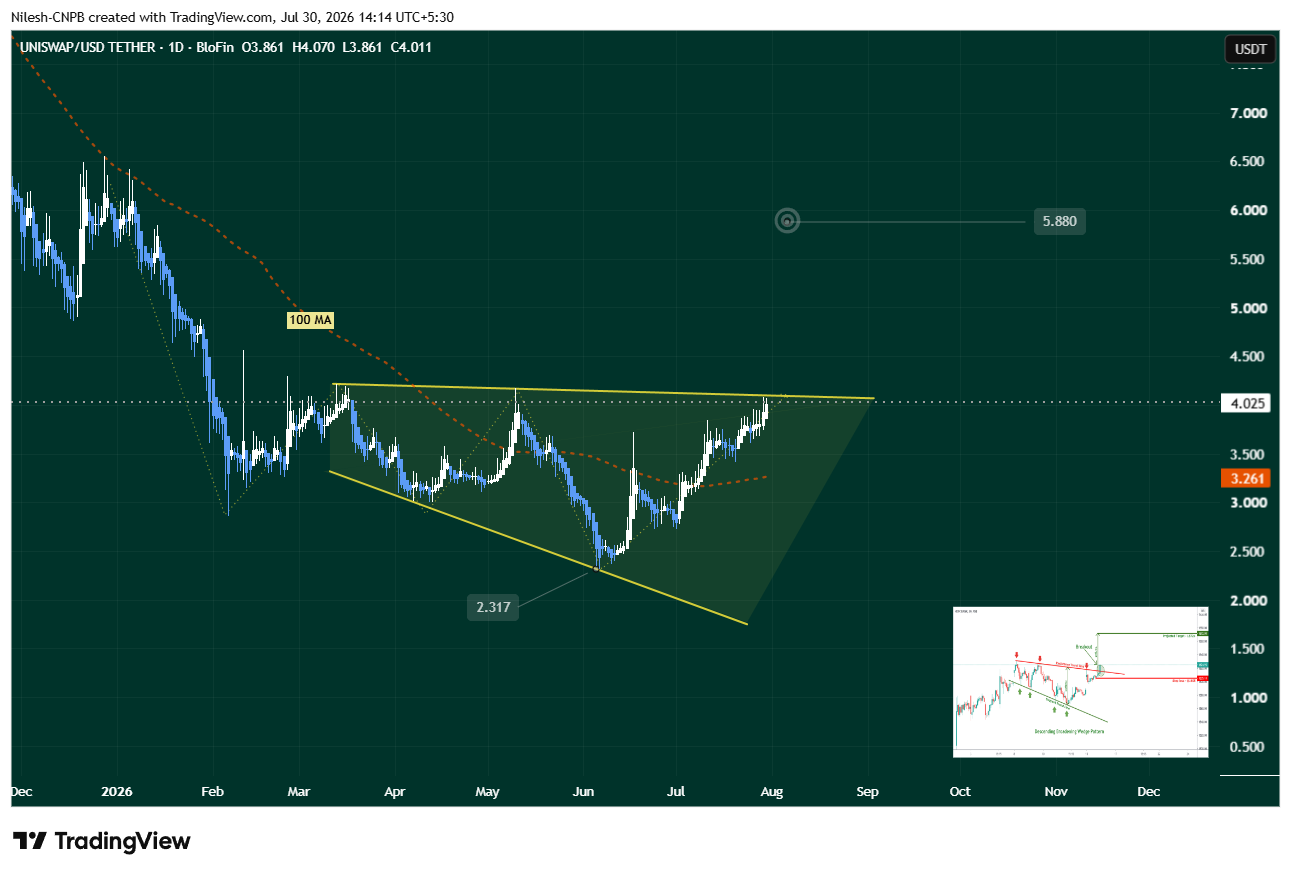
- A bullish breakout from a broadening wedge points to a potential move toward $5.88, with $3.26 acting as key support.
Uniswap is making the case that fundamental protocol performance — measurable, consistent, and publicly verifiable on-chain — eventually finds its way into token price. A 30-day gain of +42.41% while generating $92.55M in protocol fees and $51.94B in DEX volume is not a narrative-driven speculative move. It is a market gradually repricing a protocol that has continued executing while the broader DeFi token market struggled.
UNI is trading at $4.02 — up +3.87% in 24 hours and +4.31% over 7 days — with a market cap of approximately $2.51 billion. The 30-day performance is the standout figure — a +42% move while most altcoins remain deeply negative YTD reflects specific, protocol-driven buying interest rather than broad market beta.

Protocol Fees: Third Globally, Behind Only Tether and Circle
The most fundamental signal driving Uniswap’s renewed investor interest is a fee generation profile that places it in elite company across all crypto protocols — not just DeFi or DEX competitors.
Uniswap’s fee data:
| Period | Fees Generated |
|---|---|
| 24 hours | $3.14 million |
| 7 days | $22.28 million |
| 30 days | $92.55 million |
The competitive context:
In the current protocol fee rankings as per defillama only Tether (earning fees on USDT issuance and redemption) and Circle (earning on USDC operations) generate more fees than Uniswap. Both are stablecoin issuers with fundamentally different business models — infrastructure providers for the entire crypto ecosystem rather than application-layer protocols.
Among all decentralised applications — trading platforms, lending protocols, derivatives exchanges, and infrastructure services — Uniswap’s $92.55M in 30-day fees places it at the top of the DeFi fee generation table. This is not a metric that fluctuates dramatically based on market sentiment — it reflects the actual trading activity flowing through Uniswap’s liquidity pools, which remains consistently high regardless of broader token price trends.
What fee generation means for UNI’s investment thesis:
High, consistent protocol fees create a genuine case for token value accrual — particularly as Uniswap’s governance and fee switch discussions have periodically brought the question of whether those fees should flow to UNI holders to the forefront. Even without an activated fee switch, the fee generation data establishes Uniswap as a protocol with real revenue — a category of DeFi asset that has historically outperformed pure narrative tokens over sustained periods.
Uniswap’s DEX Volume Leadership
Beyond fees, Uniswap’s trading volume profile confirms its position as the dominant decentralised exchange by an increasingly wide margin:
| Period | DEX Volume |
|---|---|
| 24 hours | $2.092 billion |
| 7 days | $12.356 billion |
| 30 days | $51.94 billion |
$51.94 billion in 30-day volume — processed entirely through smart contracts, with no central counterparty, no custodian, and no order book requiring human market makers — is one of the most significant infrastructure performance metrics in DeFi. It means Uniswap’s liquidity pools absorbed and processed over $50 billion in trading value in the last month alone.
For comparison, the competitors Uniswap outpaces include PancakeSwap (BSC’s dominant DEX), Native, and Pump.fun — none of which approach Uniswap’s volume figures at the 30-day aggregate level. Uniswap’s moat in DEX volume is not simply its age or reputation — it is the deep liquidity that its concentrated liquidity model (v3) and multi-chain deployment have built across Ethereum, Arbitrum, Base, Optimism, and other chains.
UNI Technical Analysis
The technical picture on Uniswap’s daily chart provides the specific level-based framework for the current price move and its potential continuation.
The pattern — right-angled descending broadening wedge:
A right-angled descending broadening wedge is characterised by a flat lower horizontal support and a descending upper resistance trendline — creating an expanding range where price makes lower highs while the floor holds at a consistent level. This pattern frequently precedes significant upside moves when price breaks above the descending upper trendline — as the combination of contained downside (flat support) and compressing upper resistance creates a spring-loaded structure.
UNI’s pattern history:
UNI established the lower horizontal support near $2.317 — a level that held through multiple tests during the 2026 corrective phase. The rebound from that support to the current $4.02 — approximately +73% from the pattern floor — represents the initial thrust of the recovery move within the wedge.
Price is now approaching the upper descending resistance trendline — the level that, when broken with conviction, activates the pattern’s measured move.
The breakout scenario:
A clean breakout above the upper resistance trendline — followed by a successful retest near the $4.11 area — would confirm the wedge has resolved to the upside. The pattern’s measured move target is $5.88 — representing approximately +46% additional upside from the current price of $4.02.
The $4.11 retest level is important: a breakout that holds above $4.11 on a retest converts former resistance into support — the technical confirmation that the breakout is genuine rather than a false move that reverses back inside the wedge.
The $3.26 100 MA support:
On the downside, the 100-day moving average at approximately $3.26 is the key structural support that must hold to maintain the current bullish structure. A sustained break below the 100 MA would weaken the recovery narrative and potentially invalidate the immediate upside setup — bringing the $2.317 pattern floor back into focus as the next meaningful support.
Why Uniswap Is Attracting Attention Now
The combination of fundamental performance and technical structure arriving simultaneously is what makes the current UNI setup more compelling than typical altcoin momentum plays.
The fundamental case — $92.55M in monthly fees and $51.94B in monthly volume — establishes Uniswap as a protocol with real, measurable business performance that has remained consistent through the 2026 bear market. Unlike tokens whose value rests entirely on narrative and speculation, UNI’s protocol generates verifiable on-chain revenue regardless of the token price.
This fundamental strength is not a new discovery — as we covered in our Uniswap Standard Chartered $100 by 2030 and key pattern article — Standard Chartered’s long-term $100 price target for UNI by 2030 was grounded specifically in this fee generation model and Uniswap’s durable DEX volume leadership. The current $5.88 technical target is a near-term step within what institutional analysts see as a much larger multi-year repricing thesis.
The technical case — a multi-month broadening wedge rebounding from major horizontal support with a clear measured move target — provides the specific price levels that make the trade quantifiable rather than open-ended.
The broader DeFi context:
As we have covered throughout 2026 — the market has been increasingly differentiating between protocols with real fee generation and those without. Uniswap sits at the top of that first category — alongside Hyperliquid and a small number of other protocols that generate consistent, substantial revenue from actual product usage rather than token incentive mechanisms.
Bottom Line
Uniswap’s +42.41% 30-day performance reflects a market repricing a protocol that has continued to deliver — $92.55M in monthly fees, $51.94B in monthly DEX volume, and a third-place global ranking behind only Tether and Circle — while most DeFi tokens have struggled. The right-angled descending broadening wedge provides the technical map: a confirmed breakout above the upper trendline and successful $4.11 retest would activate the $5.88 measured move target, while the 100 MA at $3.26 remains the key downside level that must hold to maintain the current structure.
Frequently Asked Questions (FAQ)
Why is Uniswap (UNI) rising?
UNI is up +42.41% over 30 days — driven by renewed investor interest in high-revenue protocols, with Uniswap generating $3.14M in daily fees, $92.55M monthly, and maintaining $2.09B in 24-hour DEX volume.
What is Uniswap’s fee ranking globally?
Uniswap ranks #3 globally for protocol fees — behind only Tether and Circle (stablecoin issuers) — and #1 among all decentralised applications, generating $92.55M in 30-day fees.
The opinions and market insights shared on CoinsProbe represent the views of individual authors based on prevailing market conditions at the time of publication. Cryptocurrency investments carry significant risk and volatility. Readers are encouraged to conduct their own research and seek professional financial advice before making investment decisions. CoinsProbe and its contributors do not accept responsibility for financial losses or decisions made based on published content.
CoinsProbe may publish sponsored articles, affiliate links, or promotional collaborations. All sponsored material is clearly labeled to maintain transparency with our audience. Our editorial decisions remain fully independent, and advertising partnerships do not influence reviews, rankings, or published opinions.
Since 2023, CoinsProbe has delivered reliable insights on cryptocurrency, blockchain, and digital assets. Our content is created by experienced researchers and analysts who follow strict editorial standards focused on accuracy, transparency, and credibility. Every article is carefully reviewed and verified using trusted sources and current market data. We provide unbiased analysis and timely updates covering everything from emerging crypto projects to major industry developments.