
- Bitcoin is near $63,452, down 3.08% in 24 hours, with a market cap of about $1.27T.
- Whales accumulated 19,696 BTC over eight days, signaling stronger long-term demand.
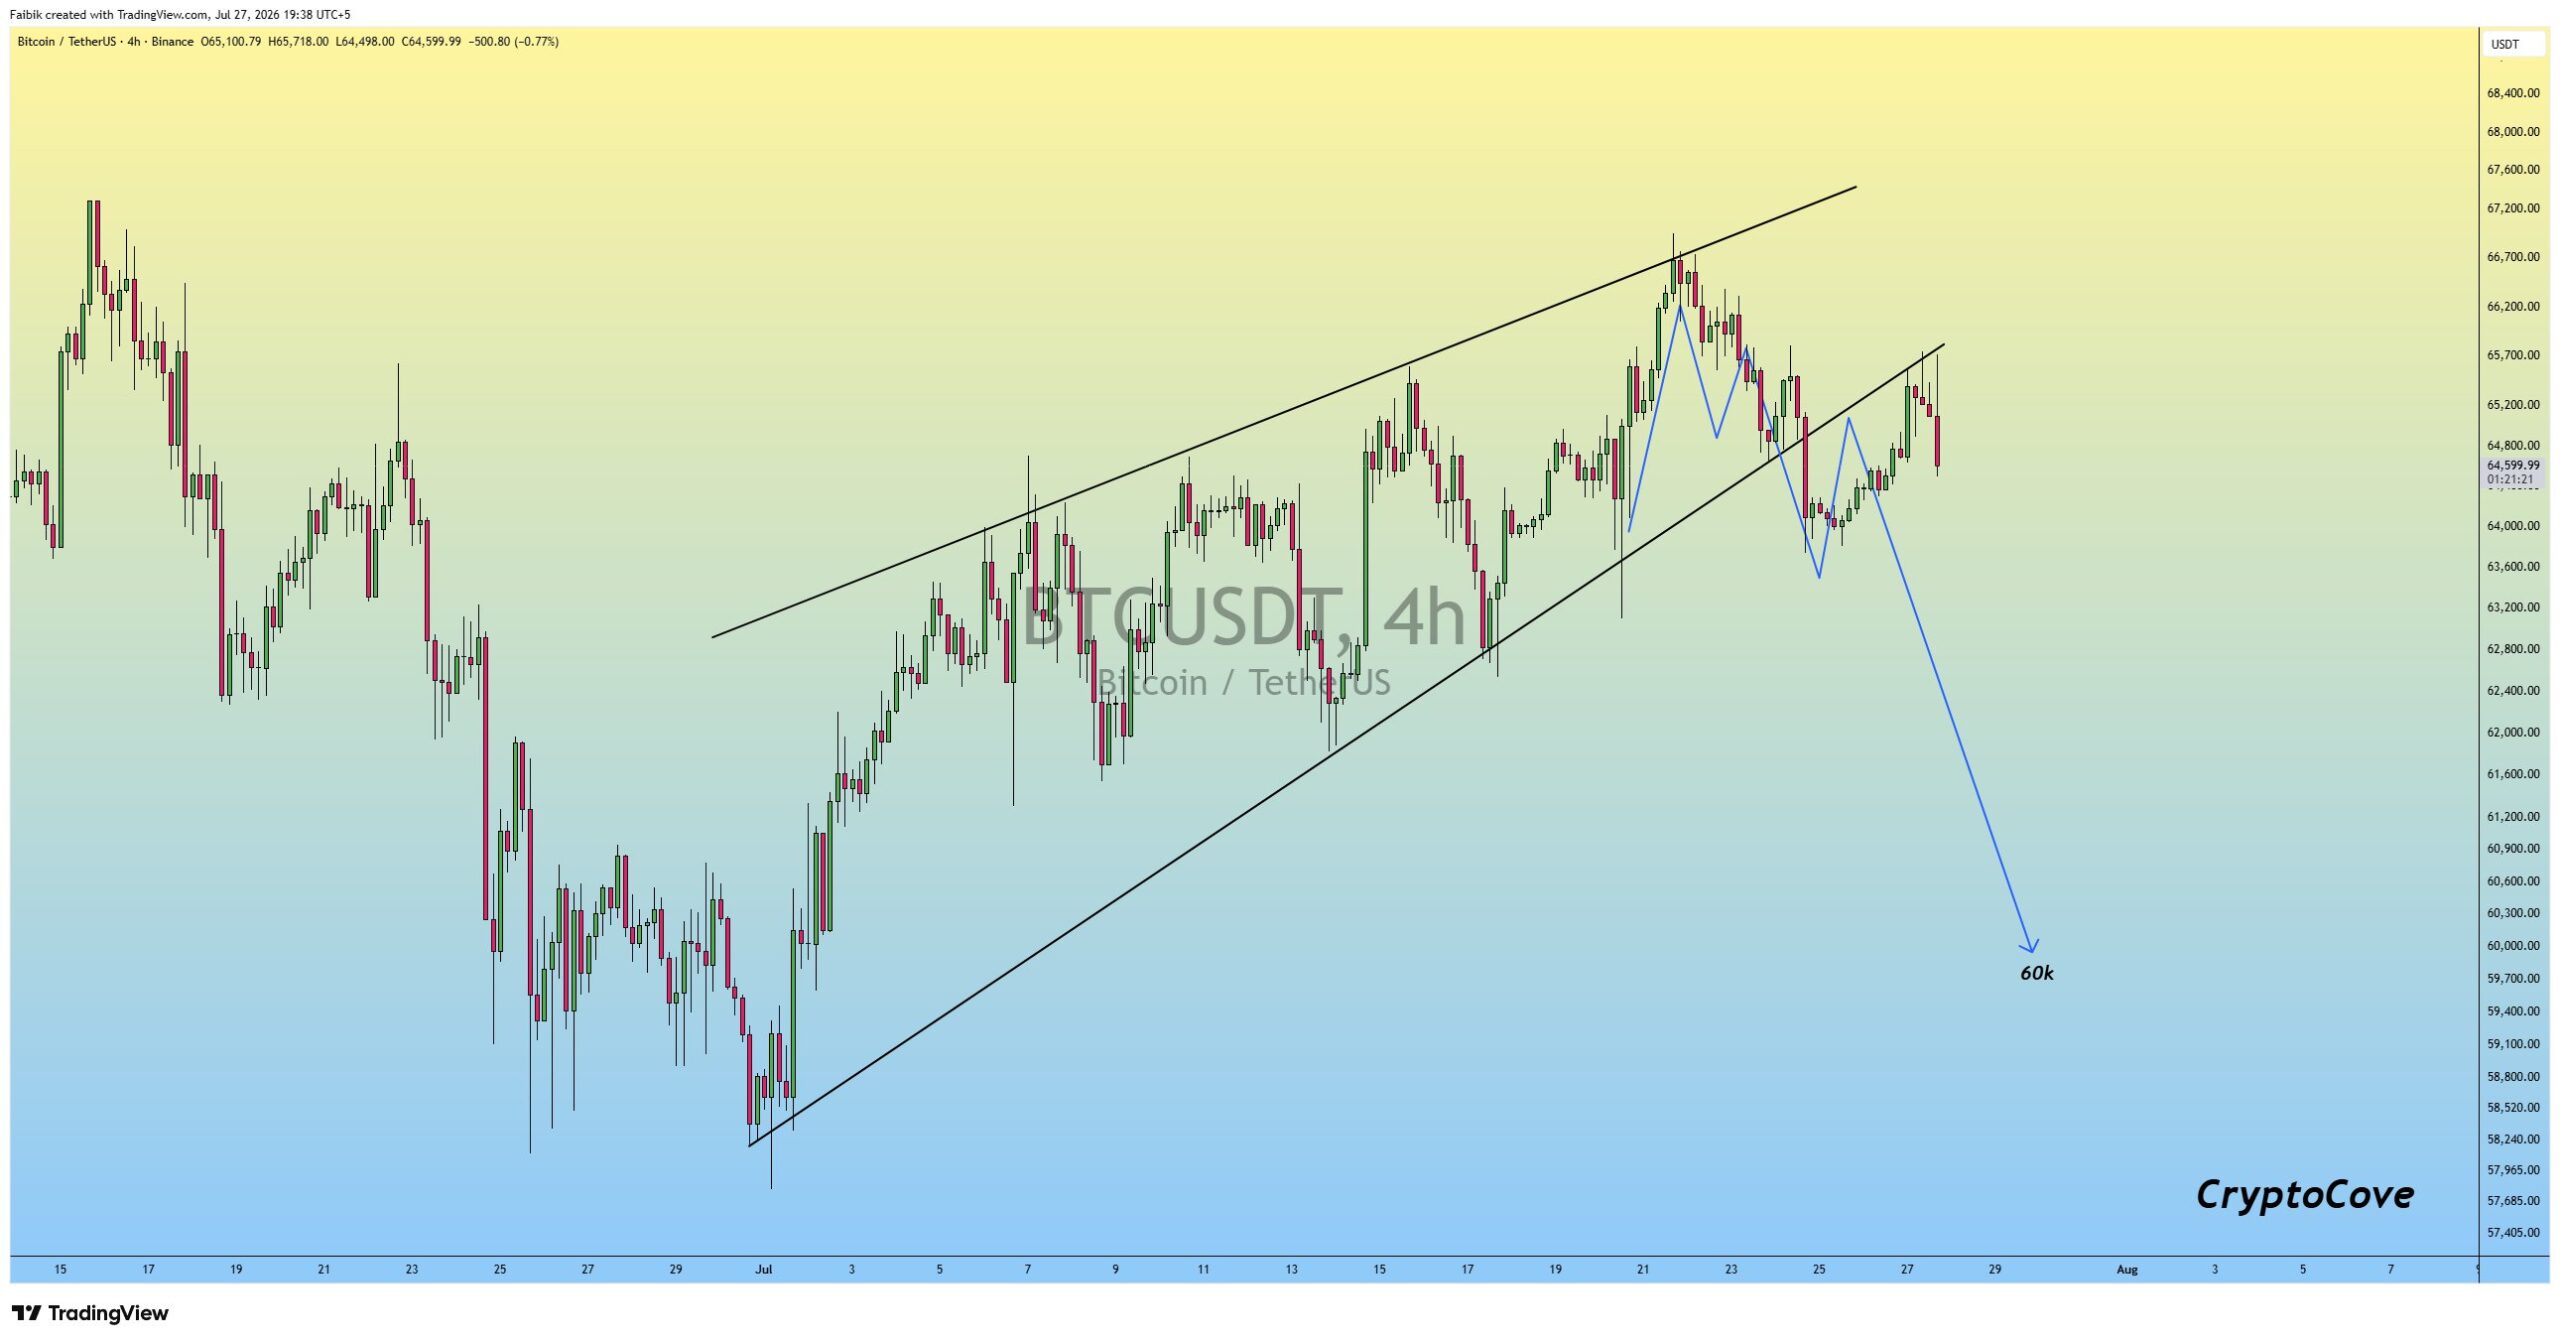
- A rising wedge breakdown could push BTC toward the $60,000 support zone.
- On-chain signals remain bullish, but short-term technicals point to further downside risk
Bitcoin’s -3.08% single-day decline is creating one of the more analytically interesting divergences of the current cycle: on-chain data showing whales actively adding 19,696 BTC over eight days — supply moving deliberately into stronger hands — while the 4-hour technical structure is pointing toward further near-term weakness toward $60,000. Both signals can be true simultaneously, and understanding how they interact is what the current setup requires.
Bitcoin is trading near $63,452 — down -3.08% in 24 hours — with a market cap of approximately $1.27 trillion. Despite the current pullback, BTC has gained approximately +5.97% over the past month — a recovery supported in part by the cooler-than-expected CPI readings we covered extensively in mid-July, which eased immediate inflation pressure and helped stabilise price after prior volatility.

Signal 1 — Whale and Shark Accumulation: 19,696 BTC in 8 Days
Santiment data provides the most compelling longer-term signal in the current setup — one that cuts directly against the bearish interpretation of today’s -3.08% price decline.
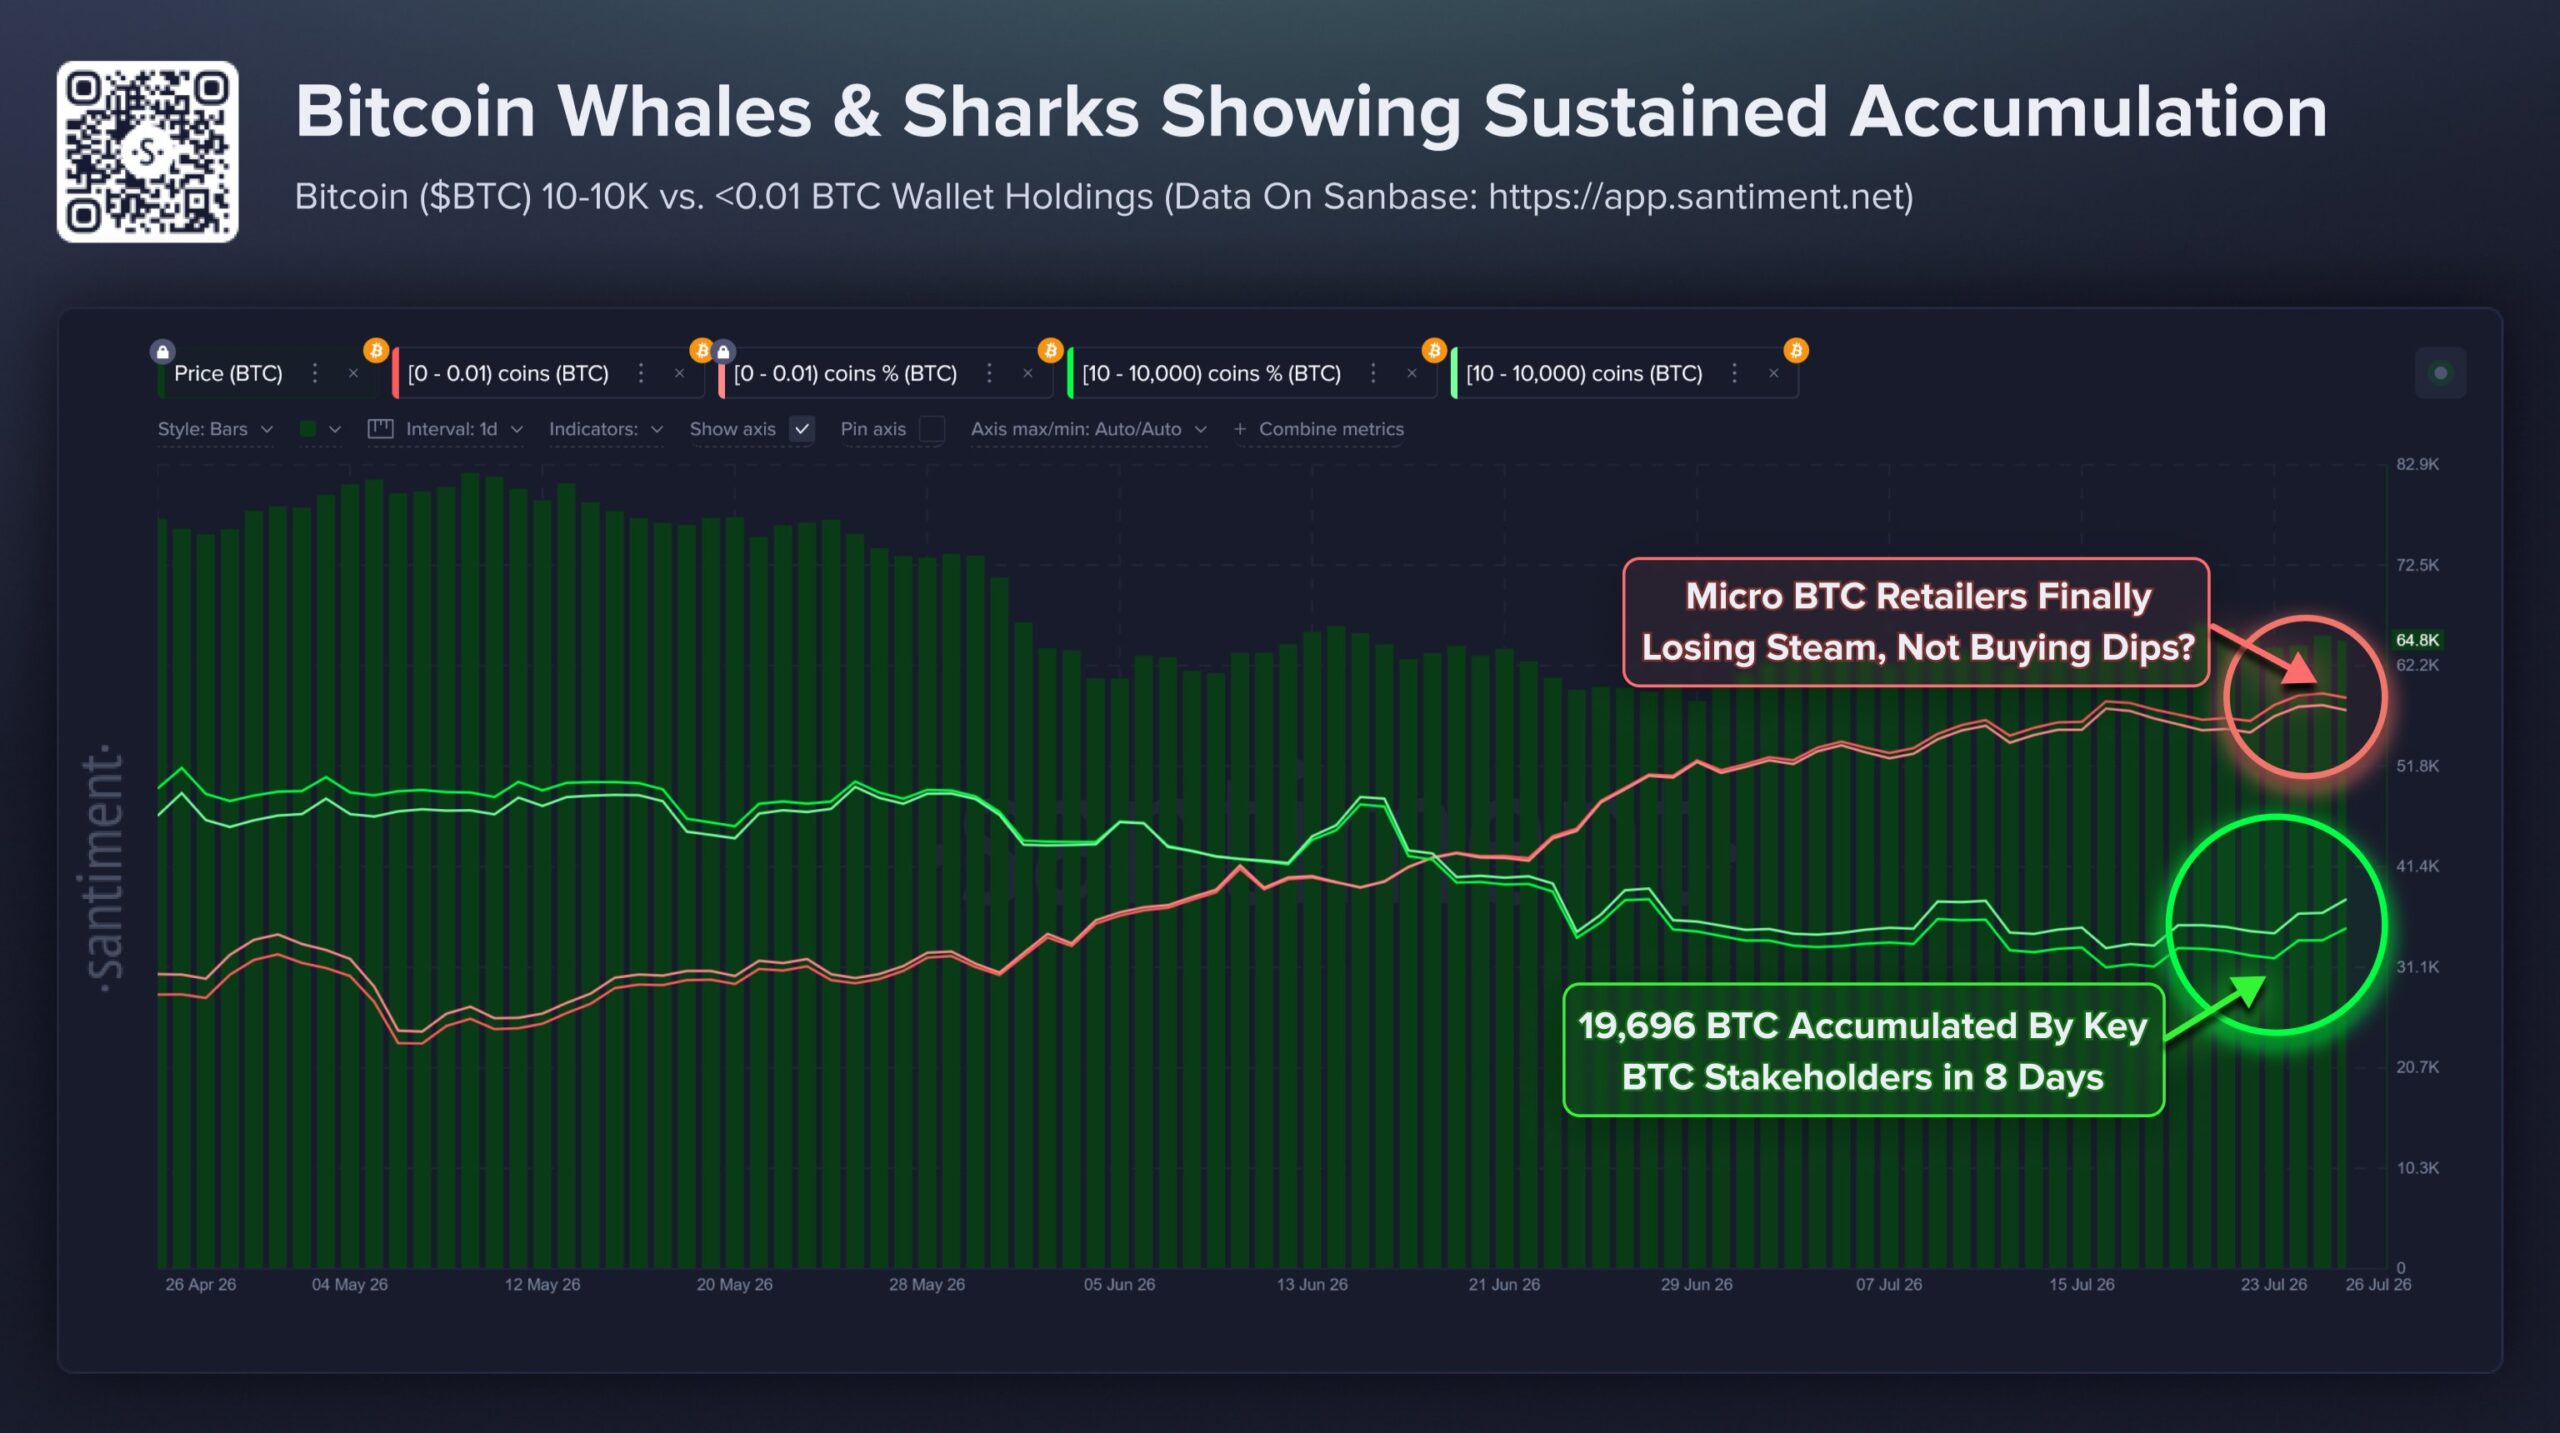
The accumulation data:
Wallets holding between 10 BTC and 10,000 BTC — the cohort that Santiment classifies as sharks and whales — have accumulated 19,696 BTC over the past 8 days. At the current price of approximately $63,452, that represents roughly $1.25 billion worth of Bitcoin being absorbed by mid-to-large holders during a period of price weakness.
The retail contrast:
Simultaneously, wallets holding less than 0.01 BTC — micro-retail participants — are showing reduced urgency in buying dips. This cohort, which tends to be the most sentiment-reactive segment of the market, is pulling back from the aggressive dip-buying behaviour that characterised prior periods of Bitcoin weakness.
Why this specific combination matters:
Santiment specifically characterises the divergence between declining retail urgency and rising whale accumulation as constructive — and the historical data supports this interpretation. When retail participants lose conviction and reduce their buying activity while larger holders are simultaneously accumulating at scale, it reflects a transfer of supply from weaker hands to stronger hands. Holders who accumulated at higher prices and are now underwater tend to sell to holders with deeper conviction and longer time horizons.
Santiment also noted two additional supporting observations: returning ETF demand — consistent with the 7-consecutive-day inflow streak we documented in our Bitcoin ETF article — and a broader shift of supply toward stronger hands — consistent with the 45% of LTH supply in loss with continued accumulation signal we covered throughout June and July.
The important caveat:
Whale accumulation patterns precede more sustained moves historically — but they do not guarantee short-term price direction. Whales can be early, and the 4-hour technical structure we cover below is a reminder that near-term weakness is possible even while longer-term accumulation is underway.
Signal 2 — Rising Wedge Retest Points Toward $60K
Analyst CryptoFaibik identified a specific and concerning technical development on Bitcoin’s 4-hour chart: a rising wedge retest near the $65,700 level that has subsequently broken to the downside.
Understanding the rising wedge:
A rising wedge is defined by two upward-sloping converging trendlines — where price makes higher highs and higher lows, but the higher highs are rising faster than the higher lows, causing the pattern to narrow toward an apex. Despite the upward price movement within the pattern, a rising wedge is typically a bearish structure — the narrowing range reflects diminishing buying momentum that eventually exhausts itself, producing a breakdown below the lower trendline.
The retest dynamic:
Following an initial break below the rising wedge’s lower trendline, Bitcoin retested the broken support near $65,700 — the level that had served as the wedge’s lower boundary. This retest is a standard technical behaviour — the market tests whether the broken support has now become resistance before continuing in the breakdown direction.
The retest near $65,700 has held as resistance — confirming the breakdown rather than reversing it — and price has begun moving lower in the direction the wedge structure projected.
The downside target:
CryptoFaibik’s chart projects a potential downside target toward $60,000 if the current structure continues to develop as mapped. From the current price of $63,452, reaching $60,000 would represent approximately -5.5% additional downside — a meaningful move but not an extreme one relative to Bitcoin’s typical volatility range.
Key Levels to Watch:
The $60,000–$63,000 zone is the near-term battleground. The $63,000 median realized price — identified by Glassnode as the heaviest demand cluster we covered in our Bitcoin $69K STH Cost Basis article — is the first meaningful support the current decline will test. If $63,000 fails to hold, the rising wedge measured move toward $60,000 becomes the next reference point.
The Split Picture — How Both Signals Can Be True Simultaneously
The apparent contradiction between whale accumulation (bullish longer-term) and a rising wedge breakdown target of $60,000 (bearish near-term) is not actually a contradiction — it is a description of how market bottoms often develop.
Large holders do not typically accumulate in a straight line into rising prices. They accumulate during periods of weakness and uncertainty — buying from retail participants who are losing conviction and selling. This means whale accumulation is often most visible precisely at the moments when price is under short-term pressure, not after it has already recovered.
A move toward $60,000 — if the rising wedge continues to play out — would not invalidate the whale accumulation signal. It might actually accelerate it: lower prices create more attractive entry points for participants with conviction, and the $60,000 zone aligns closely with the kind of structural support level where informed buying historically concentrates.
The practical reading: near-term, the technical structure suggests caution and potential further weakness toward $60K. Longer-term, the on-chain picture of whale accumulation and supply moving to stronger hands remains one of the most constructive signals Bitcoin has shown in the current cycle.
Bullish Scenario — $60K Holds as Support
Bitcoin tests the $60,000 zone — the rising wedge measured move target — where the combination of whale accumulation, ETF demand, and structural support absorbs the selling pressure. A hold and recovery from $60,000 with sustained buying volume would confirm the longer-term on-chain picture and set up the recovery toward the $69,000 STH Cost Basis that remains the key bull confirmation level.
Bearish Scenario — $60K Breaks
A sustained daily close below $60,000 would extend the current weakness and bring the $58,500 recent local low into focus — and potentially the 100 MA at $55,617 as the next meaningful support. In this scenario, the whale accumulation signal would need to be reassessed — either the accumulation continues at lower prices or the signal was premature.
Bottom Line
Bitcoin at $63,452 is navigating the specific tension between constructive longer-term on-chain signals and near-term technical weakness. Whale and shark accumulation of 19,696 BTC in 8 days — while retail urgency fades — represents one of the cleaner supply-transfer signals the current cycle has produced. The rising wedge retest failure at $65,700 represents one of the more specific near-term downside setups visible on the chart.
Both signals are real. The resolution depends on whether the $60,000–$63,000 zone attracts the kind of sustained buying that the whale accumulation data suggests is building beneath the surface — or whether selling pressure intensifies and tests the structural supports below.
Frequently Asked Questions
What does the Santiment whale accumulation data show?
Wallets holding 10–10,000 BTC (sharks and whales) accumulated 19,696 BTC over the past 8 days — while micro-retail wallets (under 0.01 BTC) show reduced buying urgency — a combination Santiment characterises as supply moving toward stronger, more conviction-driven hands.
What is Bitcoin’s longer-term on-chain picture?
Constructive — whale accumulation, returning ETF demand, supply shifting to stronger hands, 45% of LTH supply in unrealised loss with continued accumulation, and the 147-day bullish weekly divergence all point to a late-stage bottoming process despite the near-term technical weakness.
The opinions and market insights shared on CoinsProbe represent the views of individual authors based on prevailing market conditions at the time of publication. Cryptocurrency investments carry significant risk and volatility. Readers are encouraged to conduct their own research and seek professional financial advice before making investment decisions. CoinsProbe and its contributors do not accept responsibility for financial losses or decisions made based on published content.
CoinsProbe may publish sponsored articles, affiliate links, or promotional collaborations. All sponsored material is clearly labeled to maintain transparency with our audience. Our editorial decisions remain fully independent, and advertising partnerships do not influence reviews, rankings, or published opinions.
Since 2023, CoinsProbe has delivered reliable insights on cryptocurrency, blockchain, and digital assets. Our content is created by experienced researchers and analysts who follow strict editorial standards focused on accuracy, transparency, and credibility. Every article is carefully reviewed and verified using trusted sources and current market data. We provide unbiased analysis and timely updates covering everything from emerging crypto projects to major industry developments.