- Bitcoin trades near $63,753, up 8.67% over the past month as it enters August.
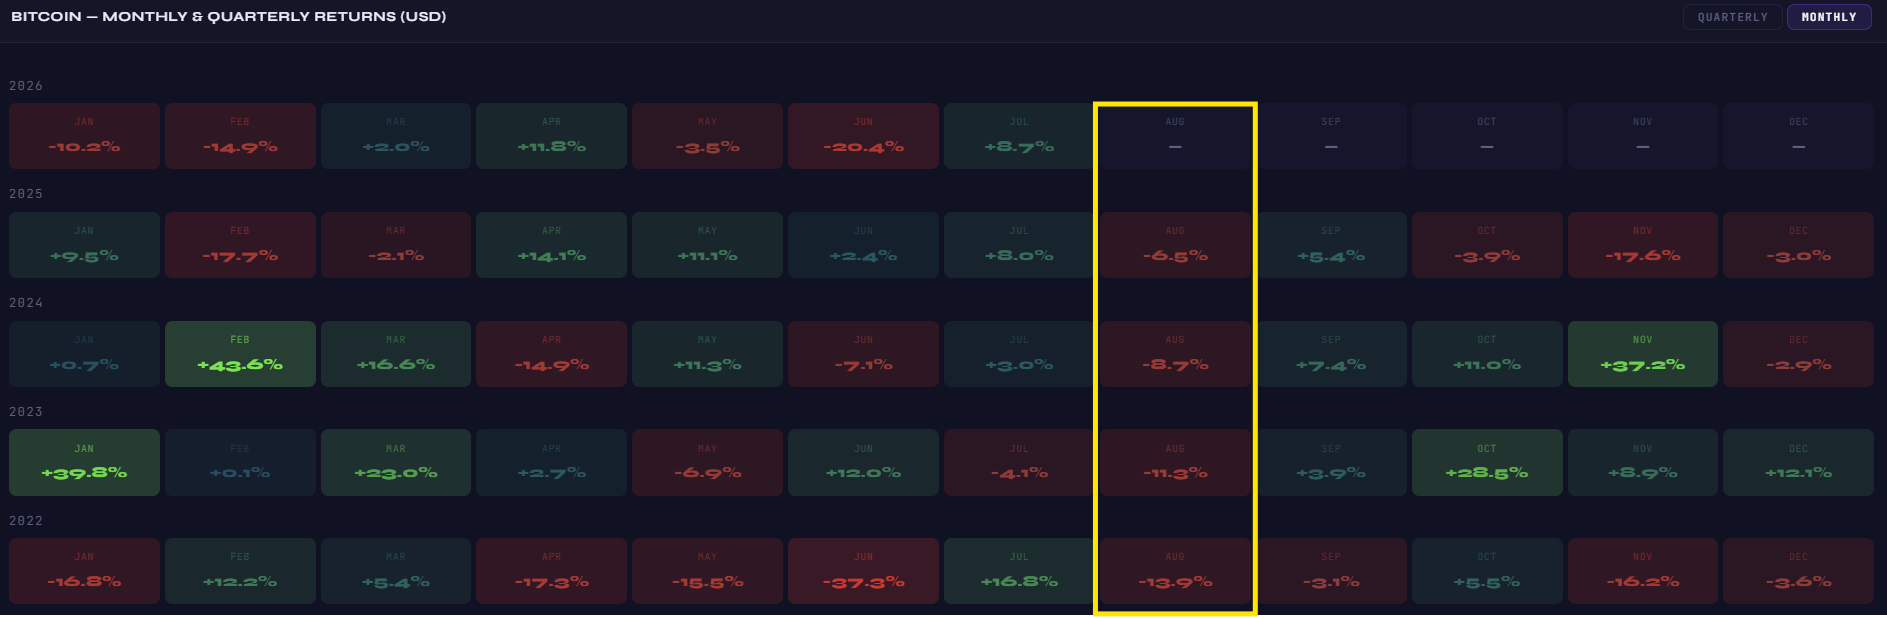
- August has been Bitcoin's weakest month, posting losses in each of the last four years.
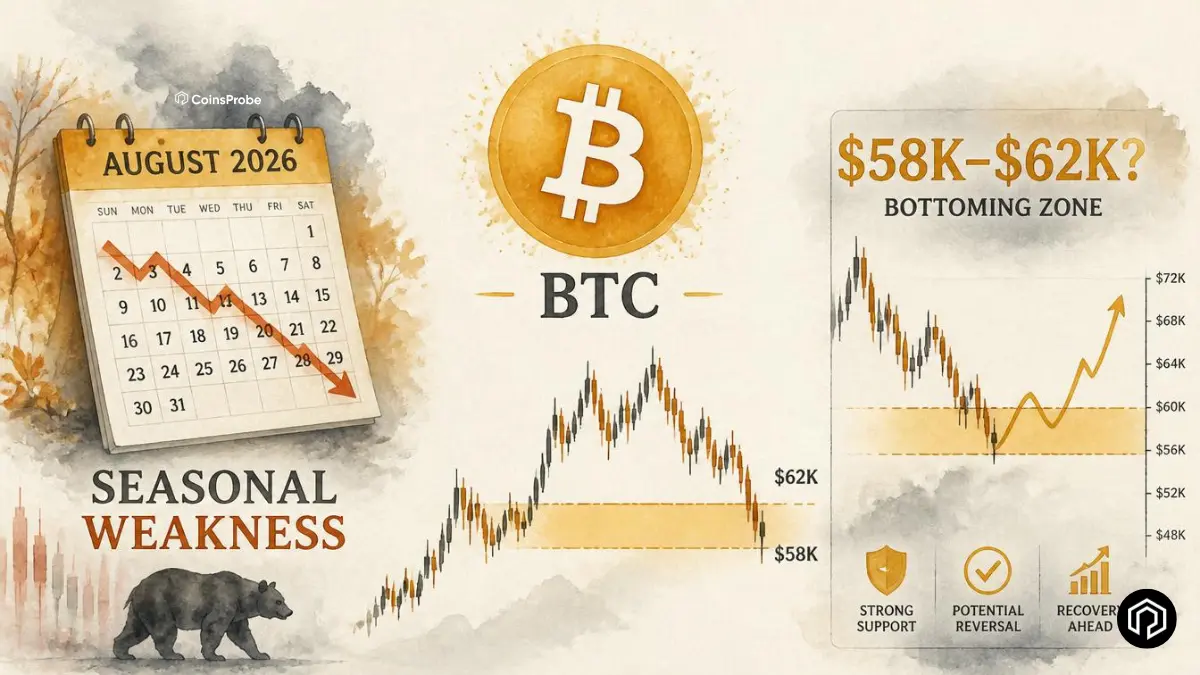
- Analyst expects a potential dip toward the $58K–$62K range in early August.
- The projected scenario points to a rebound toward $80K–$92K after the correction.
Bitcoin is entering August with the strongest 30-day performance it has shown in months — but entering August with positive momentum has not historically protected the asset from the month’s consistent pattern of negative returns. Four consecutive years of August declines averaging -10% creates a seasonal context that cannot be dismissed, regardless of the month’s starting conditions.
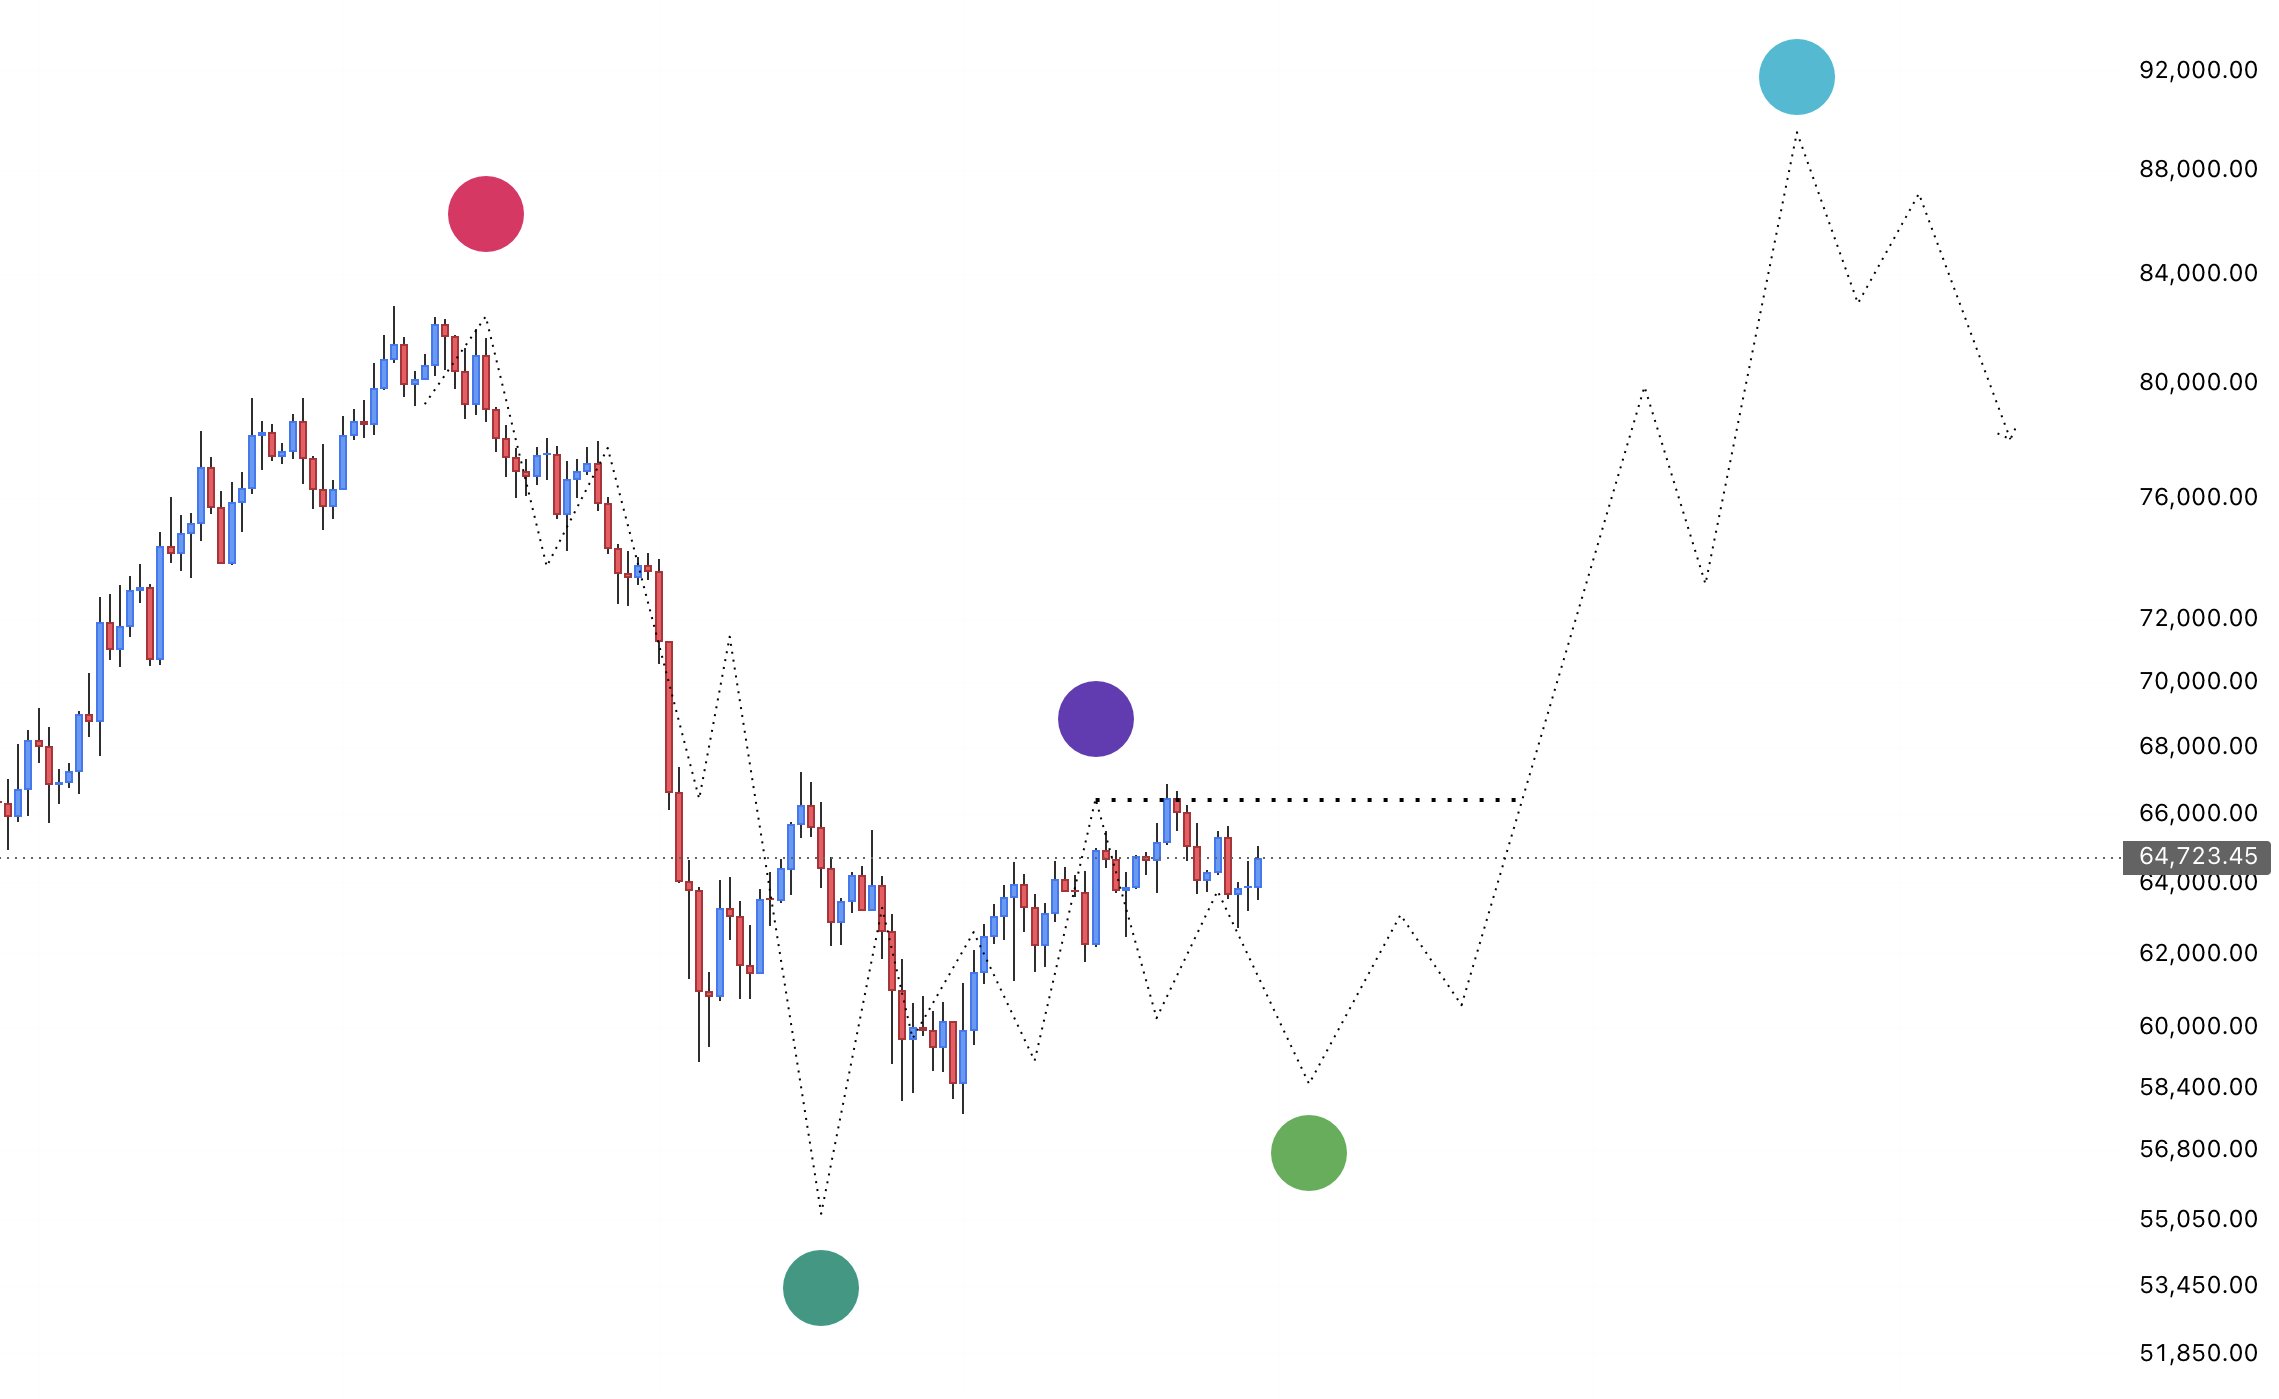
Bitcoin is trading at approximately $63,753 — up +8.67% over 30 days — with a market cap of approximately $1.27 trillion. The current price sits just above the horizontal reference level visible on the chart at approximately $64,723.45 — the level from which the analyst’s projected path begins its next move.

The August Seasonal Pattern — Four Years of Consistent Declines
August has been the single most reliably negative month in Bitcoin’s recent seasonal calendar — not by a small margin, but consistently and significantly:
| Year | August Return |
|---|---|
| 2022 | -13.9% |
| 2023 | -11.3% |
| 2024 | -8.7% |
| 2025 | -6.5% |
| 4-Year Average | ~-10% |
Several observations from this data are worth noting:
The pattern has been consistent without exception — not three out of four years, not occasionally — but every single August across the past four years has produced a negative return. This is not a small sample size coincidence — it represents a persistent seasonal dynamic that has appeared in different macro environments, different Bitcoin cycle phases, and different regulatory contexts.
The magnitude has been significant — the average -10% decline is not a rounding error. At the current price of $64,723, a -10% August would take Bitcoin to approximately $58,250 — which aligns almost precisely with the lower end of the analyst’s projected bottom range.
The trend in declines has been improving — each successive August has been slightly less negative than the prior year (-13.9% → -11.3% → -8.7% → -6.5%), suggesting the seasonal headwind may be gradually diminishing. Whether 2026 continues this trend toward a smaller decline or finally breaks the negative pattern entirely is the question August will answer.
The Analyst’s Projected Path — $58K–$62K Scenario
Analyst @LP_NXT has published a detailed chart projecting Bitcoin’s likely price path for early-to-mid August — and the track record of this analyst’s prior dotted-path projections on the same chart adds credibility to the current scenario beyond a simple price guess.
Reading the chart:
The dotted projection line on the chart shows a specific, sequenced path from the current ~$64,723 level:
Phase 1 — Decline to the $58K–$62K bottom zone:
The projected path moves lower from current levels toward a bottom in the $58,000–$62,000 range — marked approximately by the green dot on the chart, which sits in the mid-to-upper $56,000–$58,000 area as the projected low.
This bottom zone aligns with two independent reference points: the analyst’s price path projection and the four-year August seasonal average of approximately -10% from current levels.
Phase 2 — Bounce from the bottom:
Following the bottom formation in the $58K–$62K zone, the dotted path shows a recovery bounce toward higher levels — with the projection moving back above the $66,000 horizontal reference line (marked by the purple dot at approximately $68,000–$69,000) before continuing higher.
Phase 3 — Recovery toward $80K–$92K:
The full projected path extends toward the $80,000–$92,000 range — with the cyan/teal dot at approximately $91,000–$92,000 representing the analyst’s extended upside target following the August bottom. The dotted projection shows a path that reaches this zone through a series of higher highs and higher lows following the initial bottom.
The track record context:
The analyst specifically noted that prior updates on the same chart showed price following the dotted projection path with notable accuracy — giving the current projection more credibility than a first-time forecast. When a specific chart projection has tracked correctly across multiple prior updates — with actual price action following the dotted path through its various twists and turns — subsequent projections on the same chart carry meaningful analytical weight.
Two Scenarios for August 2026
Historical Pattern Repeats — Bottom at $58K–$62K
Bitcoin follows its four-consecutive-year August pattern — declining approximately 10% from current levels toward the $58,000–$62,000 zone that both the seasonal data and @LP_NXT’s projection identify as the likely bottom range. This scenario would produce a decline from $64,723 to approximately $58,000–$62,000 before the projected recovery begins building toward the $80K–$92K extended target.
If this plays out, the bottom represents one of the more significant accumulation opportunities in the current cycle — aligning with multiple independent signals we have documented throughout July 2026 including the MVRV 5th percentile, the Realized Profit vs. Loss crossover approaching, and the Structural Market Bands support zone.
Pattern Breaks — August Defies Seasonal Weakness
Bitcoin defies the four-year seasonal pattern — holding above $62,000 and pushing through the $66,000–$69,000 resistance zone that the purple dot represents on the analyst’s chart. This scenario — while less consistent with historical data — becomes more plausible in the context of the improving macro environment (cooling CPI, approaching rate cuts) and the convergent on-chain bottom signals that suggest accumulation demand is building.
A sustained move above $69,000 (the STH Cost Basis) would be the specific confirmation that August 2026 is breaking the seasonal pattern — and would accelerate the path toward the $80K–$92K targets identified on @LP_NXT’s extended projection.
Bottom Line
Bitcoin enters August 2026 with the best 30-day performance it has shown in months — and with a seasonal headwind that has produced negative returns in every single August for the past four years at an average of -10%. The analyst’s projected path maps a specific scenario consistent with that seasonal pattern: a bottom in the $58K–$62K range in early-to-mid August, followed by a recovery toward $80K–$92K.
Whether August 2026 follows the historical pattern or breaks it will be one of the most important directional questions of the current cycle. The $58K–$62K zone — where seasonal data and analyst projection converge — is the specific price area that will define the month’s significance in either direction.
Frequently Asked Questions (FAQ)
What is Bitcoin’s historical performance in August?
Bitcoin has posted negative returns in four consecutive Augusts — -13.9% (2022), -11.3% (2023), -8.7% (2024), and -6.5% (2025) — producing an average August decline of approximately -10%.
What BTC bottom range has analyst projected for August 2026?
A bottom in the $58,000–$62,000 range in early-to-mid August — followed by a recovery toward $80,000–$92,000 — consistent with the four-year seasonal average of approximately -10% from the current $64,723 level.
The opinions and market insights shared on CoinsProbe represent the views of individual authors based on prevailing market conditions at the time of publication. Cryptocurrency investments carry significant risk and volatility. Readers are encouraged to conduct their own research and seek professional financial advice before making investment decisions. CoinsProbe and its contributors do not accept responsibility for financial losses or decisions made based on published content.
CoinsProbe may publish sponsored articles, affiliate links, or promotional collaborations. All sponsored material is clearly labeled to maintain transparency with our audience. Our editorial decisions remain fully independent, and advertising partnerships do not influence reviews, rankings, or published opinions.
Since 2023, CoinsProbe has delivered reliable insights on cryptocurrency, blockchain, and digital assets. Our content is created by experienced researchers and analysts who follow strict editorial standards focused on accuracy, transparency, and credibility. Every article is carefully reviewed and verified using trusted sources and current market data. We provide unbiased analysis and timely updates covering everything from emerging crypto projects to major industry developments.