
- ENA trades at $0.2057 — down from $0.24–$0.25 recent highs — with a confirmed bearish RSI divergence on the daily Binance chart
- Analyst CryptoBullet1 targets a correction to $0.13–$0.15 support zone — a 27%–37% drawdown — before a bull run to new ATH above $0.38
- Ethena's USDe is the fourth-largest stablecoin globally — the fundamental anchor behind the 2027–2029 ATH thesis
- Watch $0.18 daily close — a break below confirms correction is underway; hold above keeps immediate bull path to $0.25 open
Ethena (ENA) is printing a textbook bearish RSI divergence on the daily chart — a setup that historically signals short-term correction before a larger move resumes. At the time of writing, ENA is trading at approximately $0.2057, down from a recent high near $0.24–$0.25, with the divergence now fully formed and visible across the daily timeframe on Binance.
Analyst CryptoBullet1 (@CryptoBullet1) flagged the setup in a September 22 post, stating: “There’s a strong BearDiv on the daily, so a correction is expected — good opportunity to buy some for the Bull Run. Expecting a new ATH.” He adds a longer-term conviction view: ENA is expected to “shine in 2027–2029” — a multi-year outlook anchored to Ethena’s structural position in the stablecoin market.
What a Bearish RSI Divergence Actually Measures
Before treating this as a directional call, the mechanics matter. A bearish RSI divergence occurs when price makes a higher high while the Relative Strength Index simultaneously makes a lower high. The divergence between the two lines indicates that the momentum driving the price higher is weakening — not that price will immediately collapse, but that the upward thrust is losing internal fuel.
This is a momentum exhaustion signal, not a price level. It identifies that buyers are becoming less aggressive at each successive high — a condition that often resolves through a pullback before the macro trend resumes. The RSI divergence does not predict how deep the correction goes, or how long it lasts — it flags that a correction is structurally overdue.
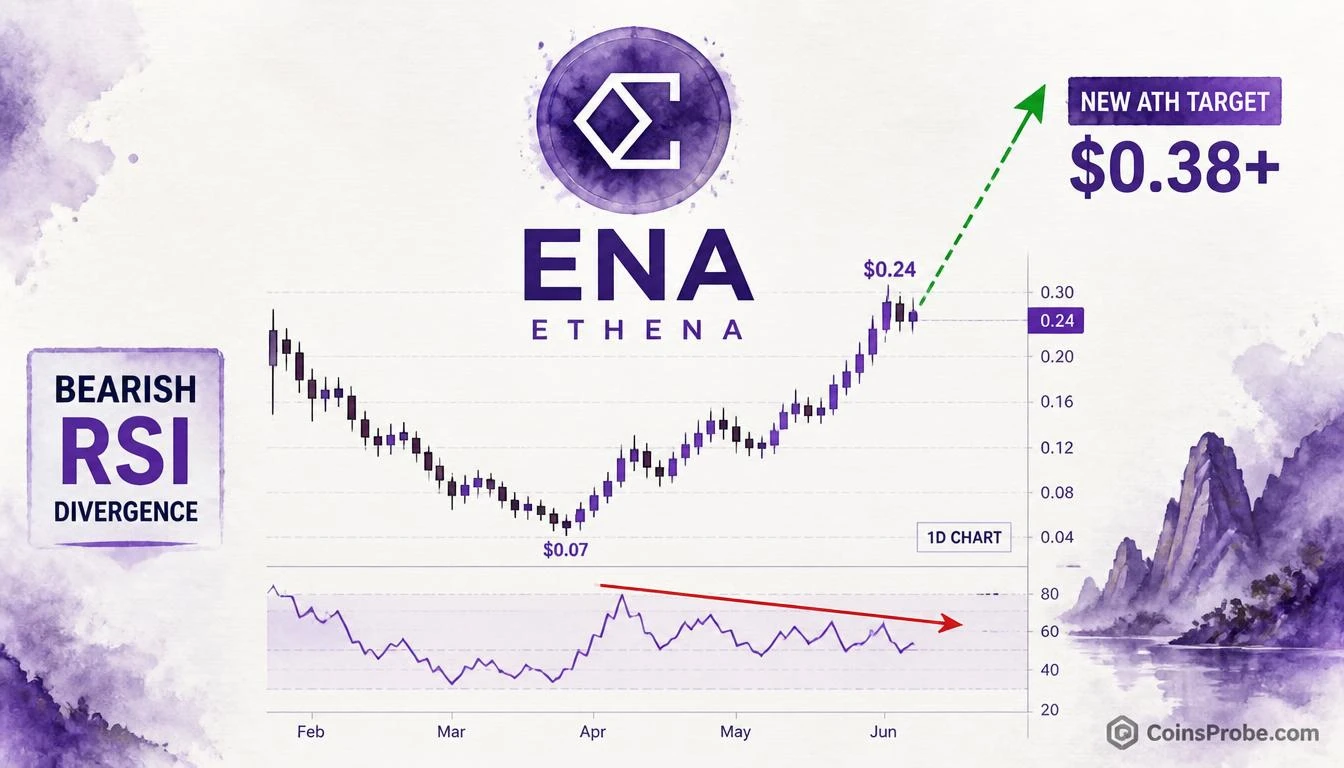
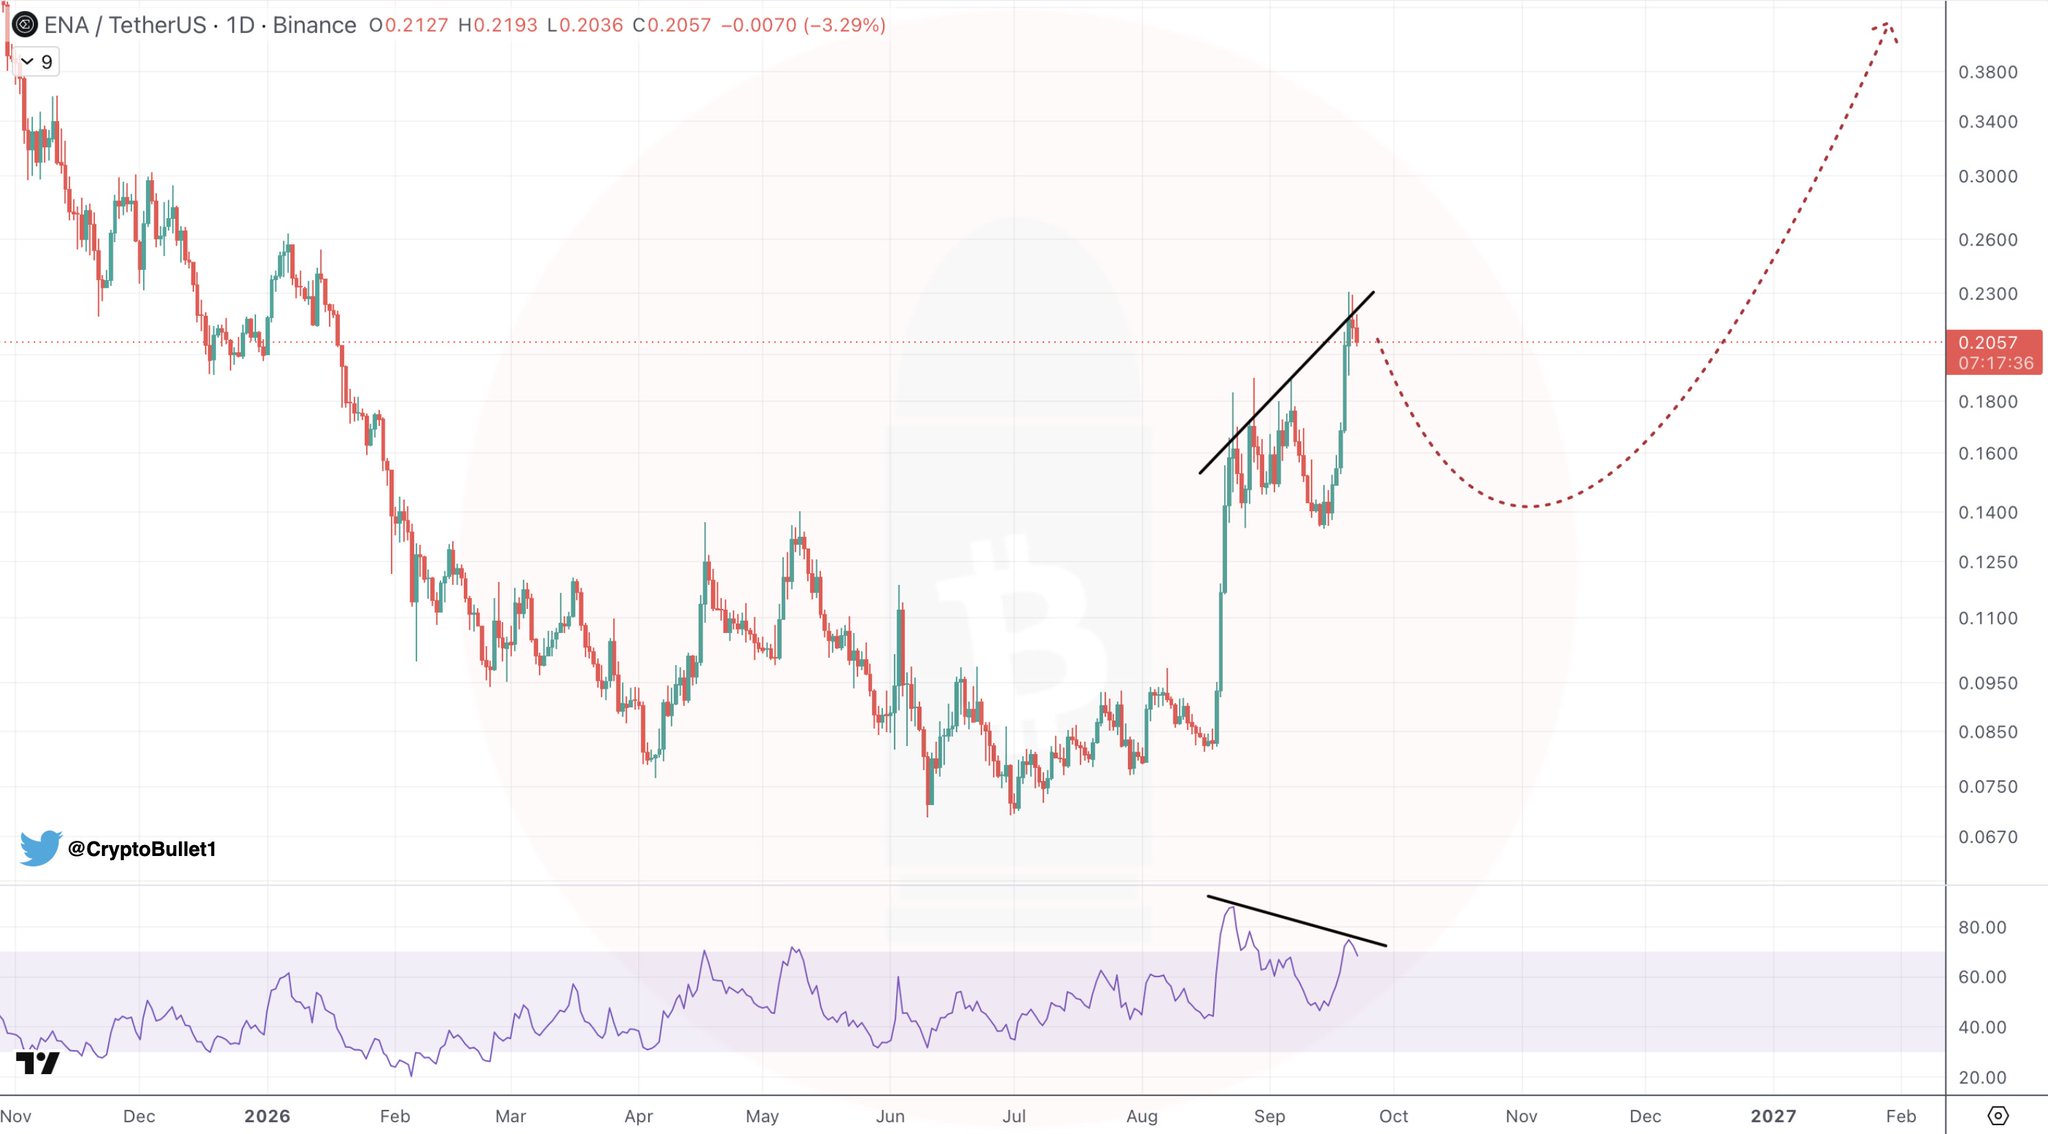
In ENA’s case, the divergence is clear: price climbed from the ~$0.07 lows through August 2025 to a recent high near $0.24–$0.25, while the RSI trendline across the same period produced a descending sequence of lower highs. Classic bearish divergence — fully formed on the daily candle close.
Signal 1 — Bearish RSI Divergence on the Daily Chart
CryptoBullet1’s daily ENA/USDT chart on Binance captures the divergence in full. The price channel shows a sharp recovery from approximately $0.07 in the lows of 2025 through to recent highs near $0.24–$0.25 — a recovery exceeding 240% from trough to peak. During that same move, the RSI formed a descending trendline of lower highs, indicating the momentum underneath the rally was deteriorating with each successive push.
The projected path drawn on the chart shows an anticipated pullback toward the $0.13–$0.15 support zone before resumption of the bull trend toward a new all-time high above $0.38–$0.40. Current price at $0.2057 sits near the horizontal dotted support line — meaning the first phase of the correction may already be underway.
Signal 2 — Ethena’s Structural Position: Fourth-Largest Stablecoin
CryptoBullet1’s conviction on a new ATH isn’t purely technical. His longer-term bullish thesis rests on a concrete protocol metric: Ethena’s USDe is currently the fourth-largest stablecoin by market cap. This is a fundamental anchor that differentiates ENA from tokens with only technical narratives behind them.
USDe’s stablecoin ranking places Ethena in direct competition with established issuers — a market position that generates protocol fees tied to the delta-neutral yield strategy underpinning USDe. As USDe supply expands, protocol revenue scales, and ENA as the governance and fee-accrual token becomes increasingly tied to that revenue stream. This is the structural argument for ENA’s 2027–2029 outlook — not speculation, but a function of USDe’s growing market share in a stablecoin market that now exceeds $200 billion in aggregate supply.
The combination of a bearish near-term technical signal and a strengthening fundamental position is what creates the setup CryptoBullet1 describes: correct now, accumulate at support, target new ATH as the macro cycle matures. For broader context on where the current market cycle stands, Bitcoin Bull Run Just Started — Google Trends Data Shows No One Cares Yet — a dynamic that typically precedes the altcoin expansion phase where ENA would be positioned to benefit.
The $0.13–$0.15 Zone — Support, Not a Guarantee
The projected correction target sits between $0.13 and $0.15 — a zone that represents approximately a 27%–37% decline from current price of $0.2057. This is not a precise number — it is a support cluster derived from prior horizontal structure and the chart’s dotted projection line.
Critically, bearish divergences can fail. Price can resolve a divergence through time (consolidation) rather than price (correction). If ENA holds above $0.18–$0.19 and the RSI resets higher without a deep correction, the divergence is neutralized and the bull trend resumes sooner. No confirmed reversal signal exists yet at the time of writing — the divergence is the warning, not the verdict.
The $0.14–$0.15 zone is where CryptoBullet1 identifies the “good opportunity to buy” — the level at which the correction would represent sufficient RSI reset to fuel the next leg toward new ATH territory. The Crypto Fear & Greed Index Hits Highest Level Since July 2025 — a broader market condition that historically compresses correction depth during bull cycles, meaning the $0.13–$0.15 target may represent a worst-case scenario rather than a guaranteed landing zone.
What It Says — And What It Doesn’t
What it says: ENA’s daily RSI has formed a confirmed bearish divergence against the recent price highs of $0.24–$0.25. Momentum is weakening at current levels. A short-to-medium-term correction toward the $0.13–$0.15 zone is the analyst’s base case before the bull trend resumes.
What it doesn’t say: The divergence does not confirm the correction has started, does not set a precise bottom, and does not guarantee a new ATH follows. Divergences fail in strong trending markets — if broader market conditions remain elevated, ENA may correct only partially before resuming.
What to watch for continuation: A daily close below $0.18 would confirm the correction phase is underway. RSI falling below 40 on the daily would signal the reset is in progress. A reclaim of $0.25 on a daily close without an RSI reset would invalidate the bearish divergence setup entirely.
Bull and Bear Scenarios
Bullish Scenario — Holds $0.18 and Divergence Resolves via Time
If ENA holds the $0.18–$0.19 zone and the RSI resets through consolidation rather than a sharp sell-off, the divergence is neutralized. Price would then be positioned for a direct move toward the $0.25 prior high and, on a breakout above that level, toward CryptoBullet1’s new ATH target of $0.38–$0.40 — representing approximately an 85%–95% gain from current price. This scenario aligns with Bitcoin’s reclaim of the 365-Day MA, which historically precedes sustained altcoin expansion.
Bearish Scenario — Daily Close Below $0.18 Triggers Deeper Correction
A confirmed daily close below $0.18 opens the path toward the $0.13–$0.15 support zone — a potential drawdown of 27%–37% from current levels. At that range, CryptoBullet1’s accumulation thesis activates. A loss of $0.13 on a closing basis would represent a more significant structural breakdown requiring re-evaluation of the setup.
Bottom Line
ENA is carrying a confirmed bearish RSI divergence on the daily chart — price reached $0.24–$0.25 while RSI traced lower highs, a classic momentum exhaustion signal after a 240%+ recovery from the $0.07 lows. Analyst CryptoBullet1 identifies this as a structurally expected correction, not a trend reversal, with the $0.13–$0.15 zone as the target accumulation area before a bull run toward a new ATH above $0.38. The fundamental anchor remains intact: Ethena’s USDe holds the fourth-largest stablecoin position globally, providing a revenue-generating foundation for the 2027–2029 outlook. The divergence does not confirm the correction has started — it confirms the setup for one exists. Watch $0.18 on the daily close: a break below activates the correction thesis. A hold above it keeps the immediate bull path open toward $0.25 and beyond.
Frequently Asked Questions
What is a bearish RSI divergence and what does it mean for ENA?
What is CryptoBullet1’s price target for ENA?
Why is Ethena’s USDe relevant to ENA’s price outlook?
What level must ENA hold to avoid the deeper correction scenario?
Can a bearish RSI divergence fail to produce a correction?
Source: Cryptobullet1 · Published by CoinsProbe Markets Desk
The opinions and market insights shared on CoinsProbe represent the views of individual authors based on prevailing market conditions at the time of publication. Cryptocurrency investments carry significant risk and volatility. Readers are encouraged to conduct their own research and seek professional financial advice before making investment decisions. CoinsProbe and its contributors do not accept responsibility for financial losses or decisions made based on published content.
CoinsProbe may publish sponsored articles, affiliate links, or promotional collaborations. All sponsored material is clearly labeled to maintain transparency with our audience. Our editorial decisions remain fully independent, and advertising partnerships do not influence reviews, rankings, or published opinions.
Since 2023, CoinsProbe has delivered reliable insights on cryptocurrency, blockchain, and digital assets. Our content is created by experienced researchers and analysts who follow strict editorial standards focused on accuracy, transparency, and credibility. Every article is carefully reviewed and verified using trusted sources and current market data. We provide unbiased analysis and timely updates covering everything from emerging crypto projects to major industry developments.