
- DOGE is trading at ~$0.06 — down 36% over 30 days — and has returned to the $0.054 support zone flagged by an analyst
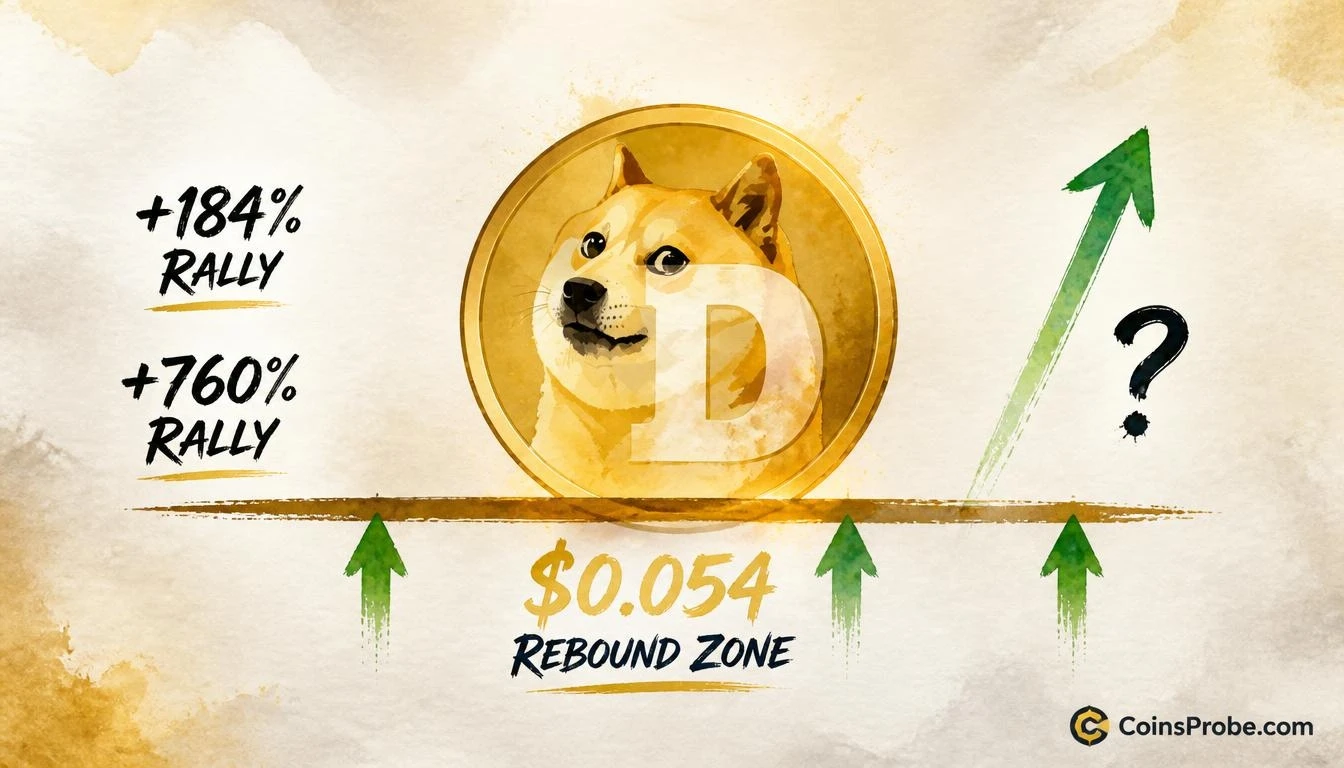
- November 2022 test of $0.054 produced a +184% rally; June 2023 test produced a +760% rally — two-for-two track record
- Monthly chart pattern is still forming — no confirmed breakout yet; $0.054 monthly close is the invalidation level
Dogecoin is trading at approximately $0.06 — down 29.82% over the past seven days and 36.02% over the past 30 days — and has returned to the exact price zone that produced two of its most significant rebounds in recent history. The signal is specific: $0.054 has functioned as a structural support floor since 2022, and every prior test has been followed by a rally of triple-digit magnitude.
One analyst identifies this as the “Dogecoin Rebound Zone,” pointing to two prior historical instances where DOGE tested this area and subsequently staged major recoveries. The first test came in November 2022, which preceded a 184% rally. The second came in June 2023, which eventually preceded a 760% rally. DOGE is now back at this zone for what would be the third major test.
Signal — The $0.054 Support Zone: Two-for-Two Since 2022
The thesis is straightforward and grounded entirely in historical behavior at a single price level. Since 2022, $0.054 has not been a rough estimate or a region — it has been a recurring inflection point where sellers exhausted and buyers absorbed supply with enough force to generate sustained, multi-month rallies.
The monthly chart shared by the analyst reveals two prior cycle bottoms marked by upward arrows, each coinciding with price touching the lower boundary near the $0.054–$0.059 zone. Following both touches, Dogecoin reversed sharply and sustained its move for months. A third upward arrow appears at the chart’s right edge, representing the analyst’s anticipated move from the current zone — though the chart’s pattern status remains forming, with no confirmed breakout above resistance yet.
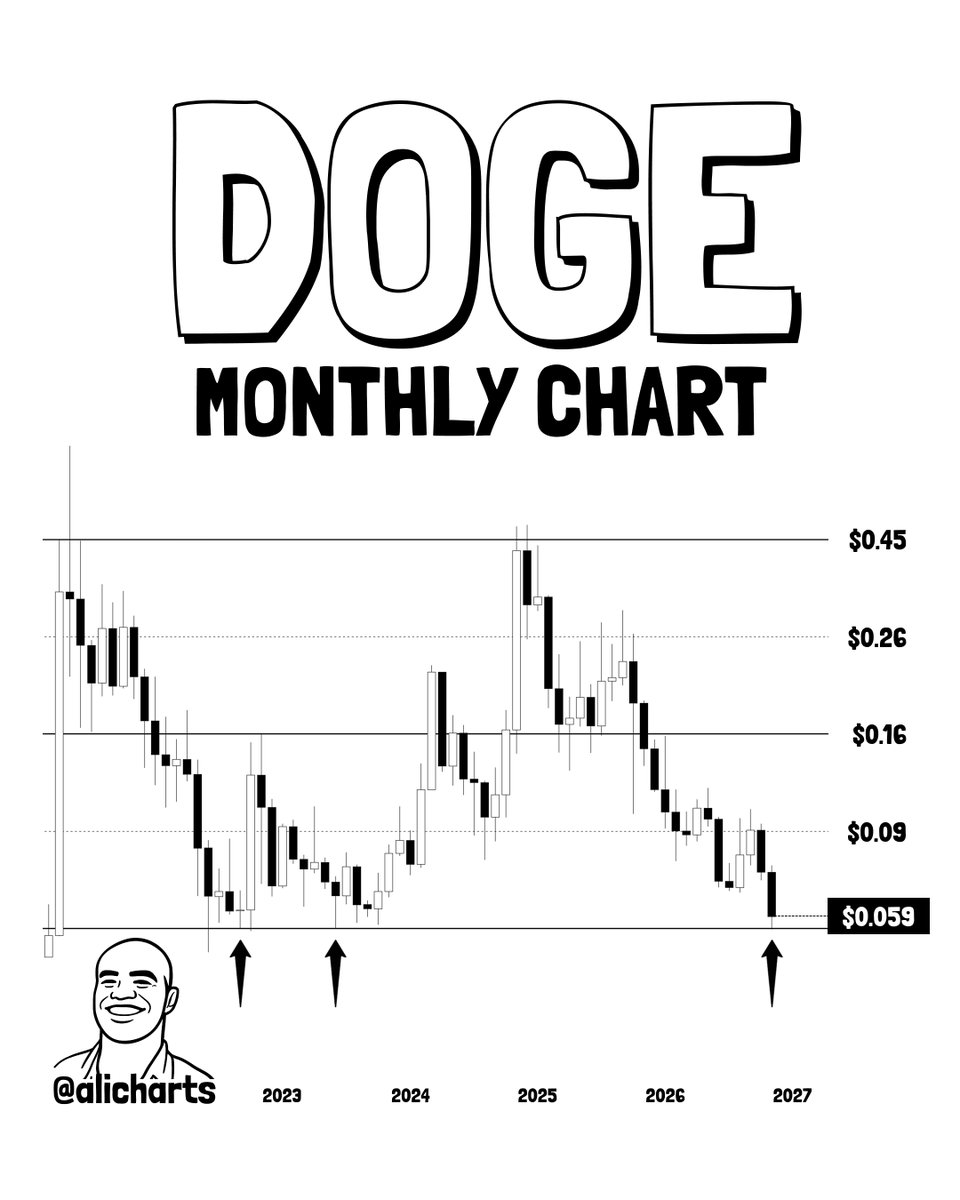
The chart currently shows price sitting at the $0.059 level — highlighted with a labeled price box — just above the $0.054 zone the analyst identifies as the structural floor. The proximity is not incidental. DOGE has entered the range where both prior rebounds initiated.
| Test Date | Support Zone | Rally Produced |
|---|---|---|
| November 2022 | ~$0.054 | +184% |
| June 2023 | ~$0.054 | +760% |
| November 2026 | ~$0.054–$0.059 | TBD |
DOGE Historical Support Zone Tests | Source: @alicharts (X)
What the Signal Says — and What It Doesn’t
The analyst’s thesis is a historical support-zone rebound argument — not a momentum call, not an on-chain thesis, and not a derivatives signal. The mechanism is behavioral: at $0.054, DOGE has historically found enough demand to absorb selling pressure and reverse course. That is the entirety of the claim, and it deserves to be stated precisely.
What the signal says: Dogecoin is at a zone that has produced rebounds of 184% and 760% in its two prior documented tests since 2022. The zone is active. The analyst anticipates a third rebound.
What it doesn’t say: There is no specific upside target stated. There is no timeframe for a potential move. The analyst does not name a catalyst, a confirmation trigger, or an on-chain metric. The pattern on the monthly chart remains forming — price is at the support zone, but no breakout above resistance has been confirmed.
What to watch for continuation: A sustained hold above $0.054 on a monthly closing basis, followed by a reclaim of $0.09 — the next level printed on the analyst’s chart — would begin to replicate the structure of the prior two rebounds. Loss of $0.054 on a monthly close would be the clearest invalidation of this thesis.
This setup is also documented in the context of a broader pattern across meme-layer assets. As previously covered, DOGE, SHIB, and PEPE simultaneously hit critical channel floors with $0.059 identified as the decisive line — consistent with the zone the analyst is now highlighting. Additionally, Dogecoin had earlier printed three converging buy signals at $0.081, a level that has since given way, compressing price further into the current support range.
Macro Context — Upcoming Data Could Shift the Setup
The timing of the signal coincides with a heavy macro calendar. Core PCE Price Index data and GDP figures are due November 24, followed by ISM Manufacturing PMI and JOLTs Job Openings on November 30. Each of these releases carries the potential to shift broader risk appetite — which historically affects DOGE’s direction more than any asset-specific catalyst, given its retail-driven demand profile.
DOGE spot ETF data via SoSoValue shows $9.6M in total ETF net assets and cumulative net inflows of $15.1M since launch, with daily trading volume at $168,049 and no net inflows recorded over the past five trading days. This confirms that ETF-driven institutional demand has not been a factor in recent price support — the $0.054 zone is holding, if it holds, on market structure alone.
Is Two-for-Two Enough?
A two-instance track record is a data point, not a statistical law. The 2022 and 2023 rebounds at $0.054 are documented — 184% and 760% respectively — but each occurred in a different macro and sentiment environment. The 2022 rebound was driven by post-FTX accumulation; the 2023 test preceded a full altcoin cycle expansion. The current environment — with DOGE down 36% in 30 days, macro uncertainty elevated, and ETF flows flat — is its own context.
That said, the level itself is precise. The analyst is not citing a range or a zone of approximation. $0.054 is a named, recurring floor with two prior documented outcomes. The current chart places price at $0.059 — still above the floor, still within the zone. Whether the third test matches its predecessors depends on whether buyers at this level prove as persistent in 2026 as they did in 2022 and 2023. For prior coverage of multi-signal setups at similar junctures, see XRP, SOL, DOGE, and HYPE flashing TD Sequential buy signals simultaneously.
Watch $0.054 as the line that keeps the thesis intact. A monthly close below it ends the two-for-two track record. A hold followed by a reclaim of $0.09 begins to replicate the structure that preceded both prior triple-digit rallies.
Source: x.comFrequently Asked Questions
What is the $0.054 support zone in Dogecoin and why does it matter?
What would invalidate the Dogecoin rebound thesis at $0.054?
Does the analyst give a price target for DOGE’s next potential rally?
Has the Dogecoin breakout from $0.054 been confirmed?
Source: Ali Charts · Published by CoinsProbe Markets Desk
The opinions and market insights shared on CoinsProbe represent the views of individual authors based on prevailing market conditions at the time of publication. Cryptocurrency investments carry significant risk and volatility. Readers are encouraged to conduct their own research and seek professional financial advice before making investment decisions. CoinsProbe and its contributors do not accept responsibility for financial losses or decisions made based on published content.
CoinsProbe may publish sponsored articles, affiliate links, or promotional collaborations. All sponsored material is clearly labeled to maintain transparency with our audience. Our editorial decisions remain fully independent, and advertising partnerships do not influence reviews, rankings, or published opinions.
Since 2023, CoinsProbe has delivered reliable insights on cryptocurrency, blockchain, and digital assets. Our content is created by experienced researchers and analysts who follow strict editorial standards focused on accuracy, transparency, and credibility. Every article is carefully reviewed and verified using trusted sources and current market data. We provide unbiased analysis and timely updates covering everything from emerging crypto projects to major industry developments.