
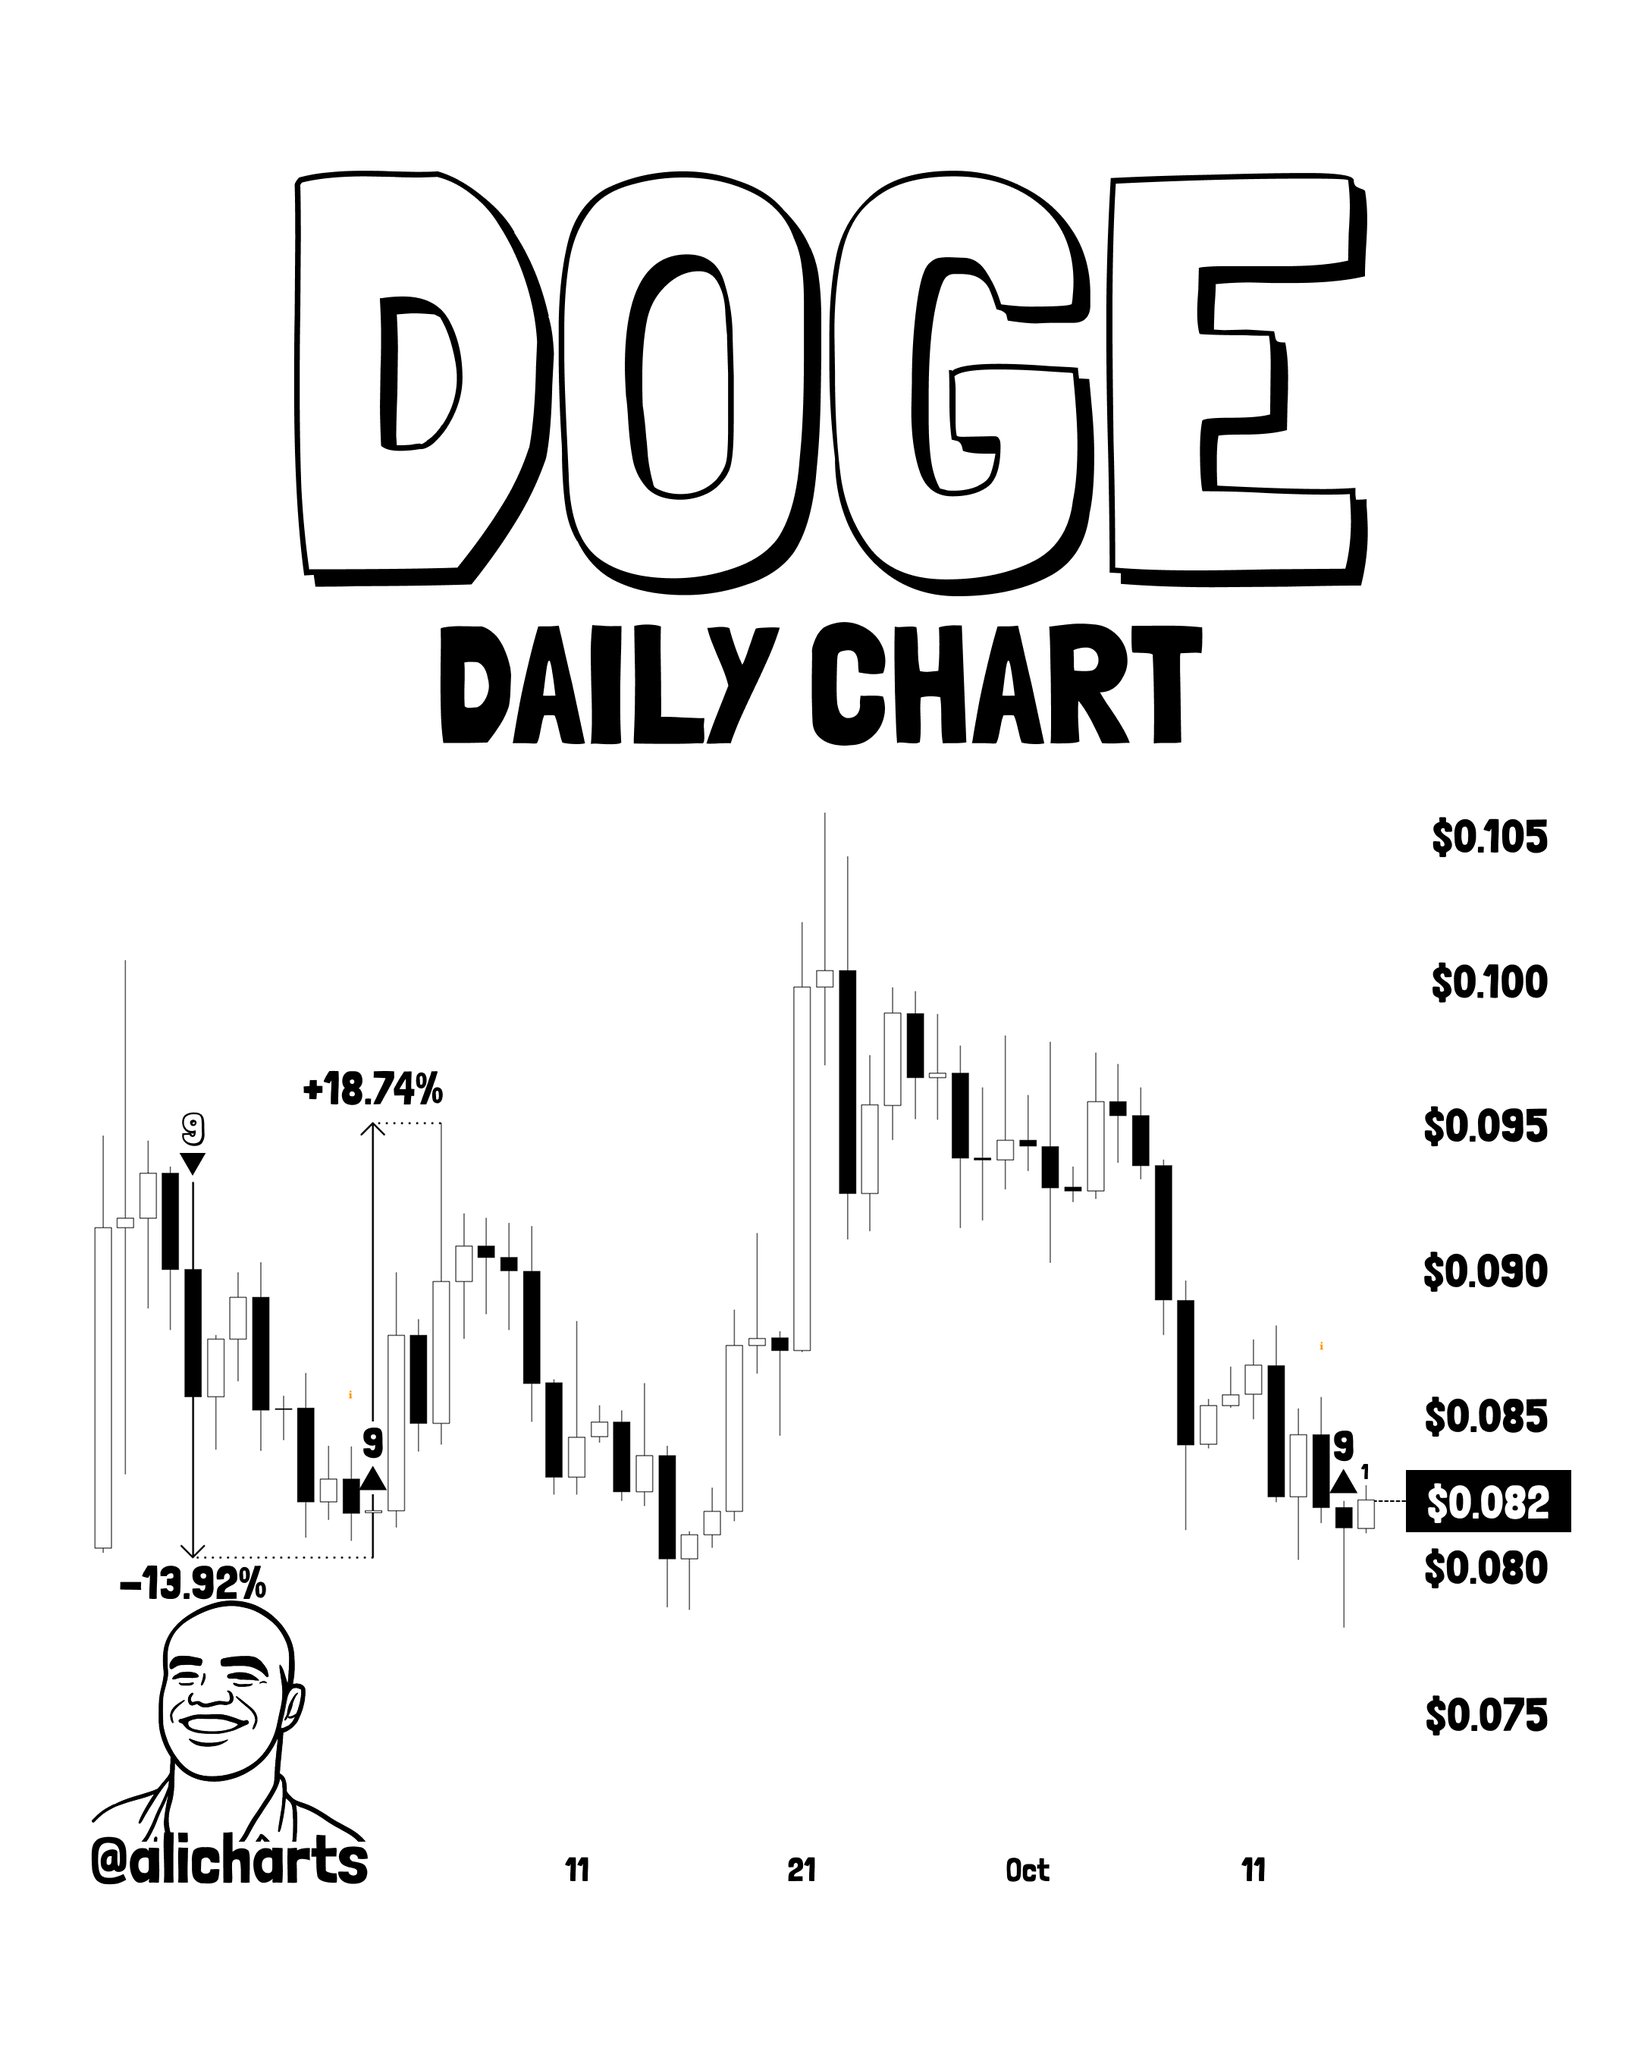
- DOGE TD Sequential prints daily '9' buy signal at $0.081 — same print preceded a +18.74% bounce in prior instance per @alicharts
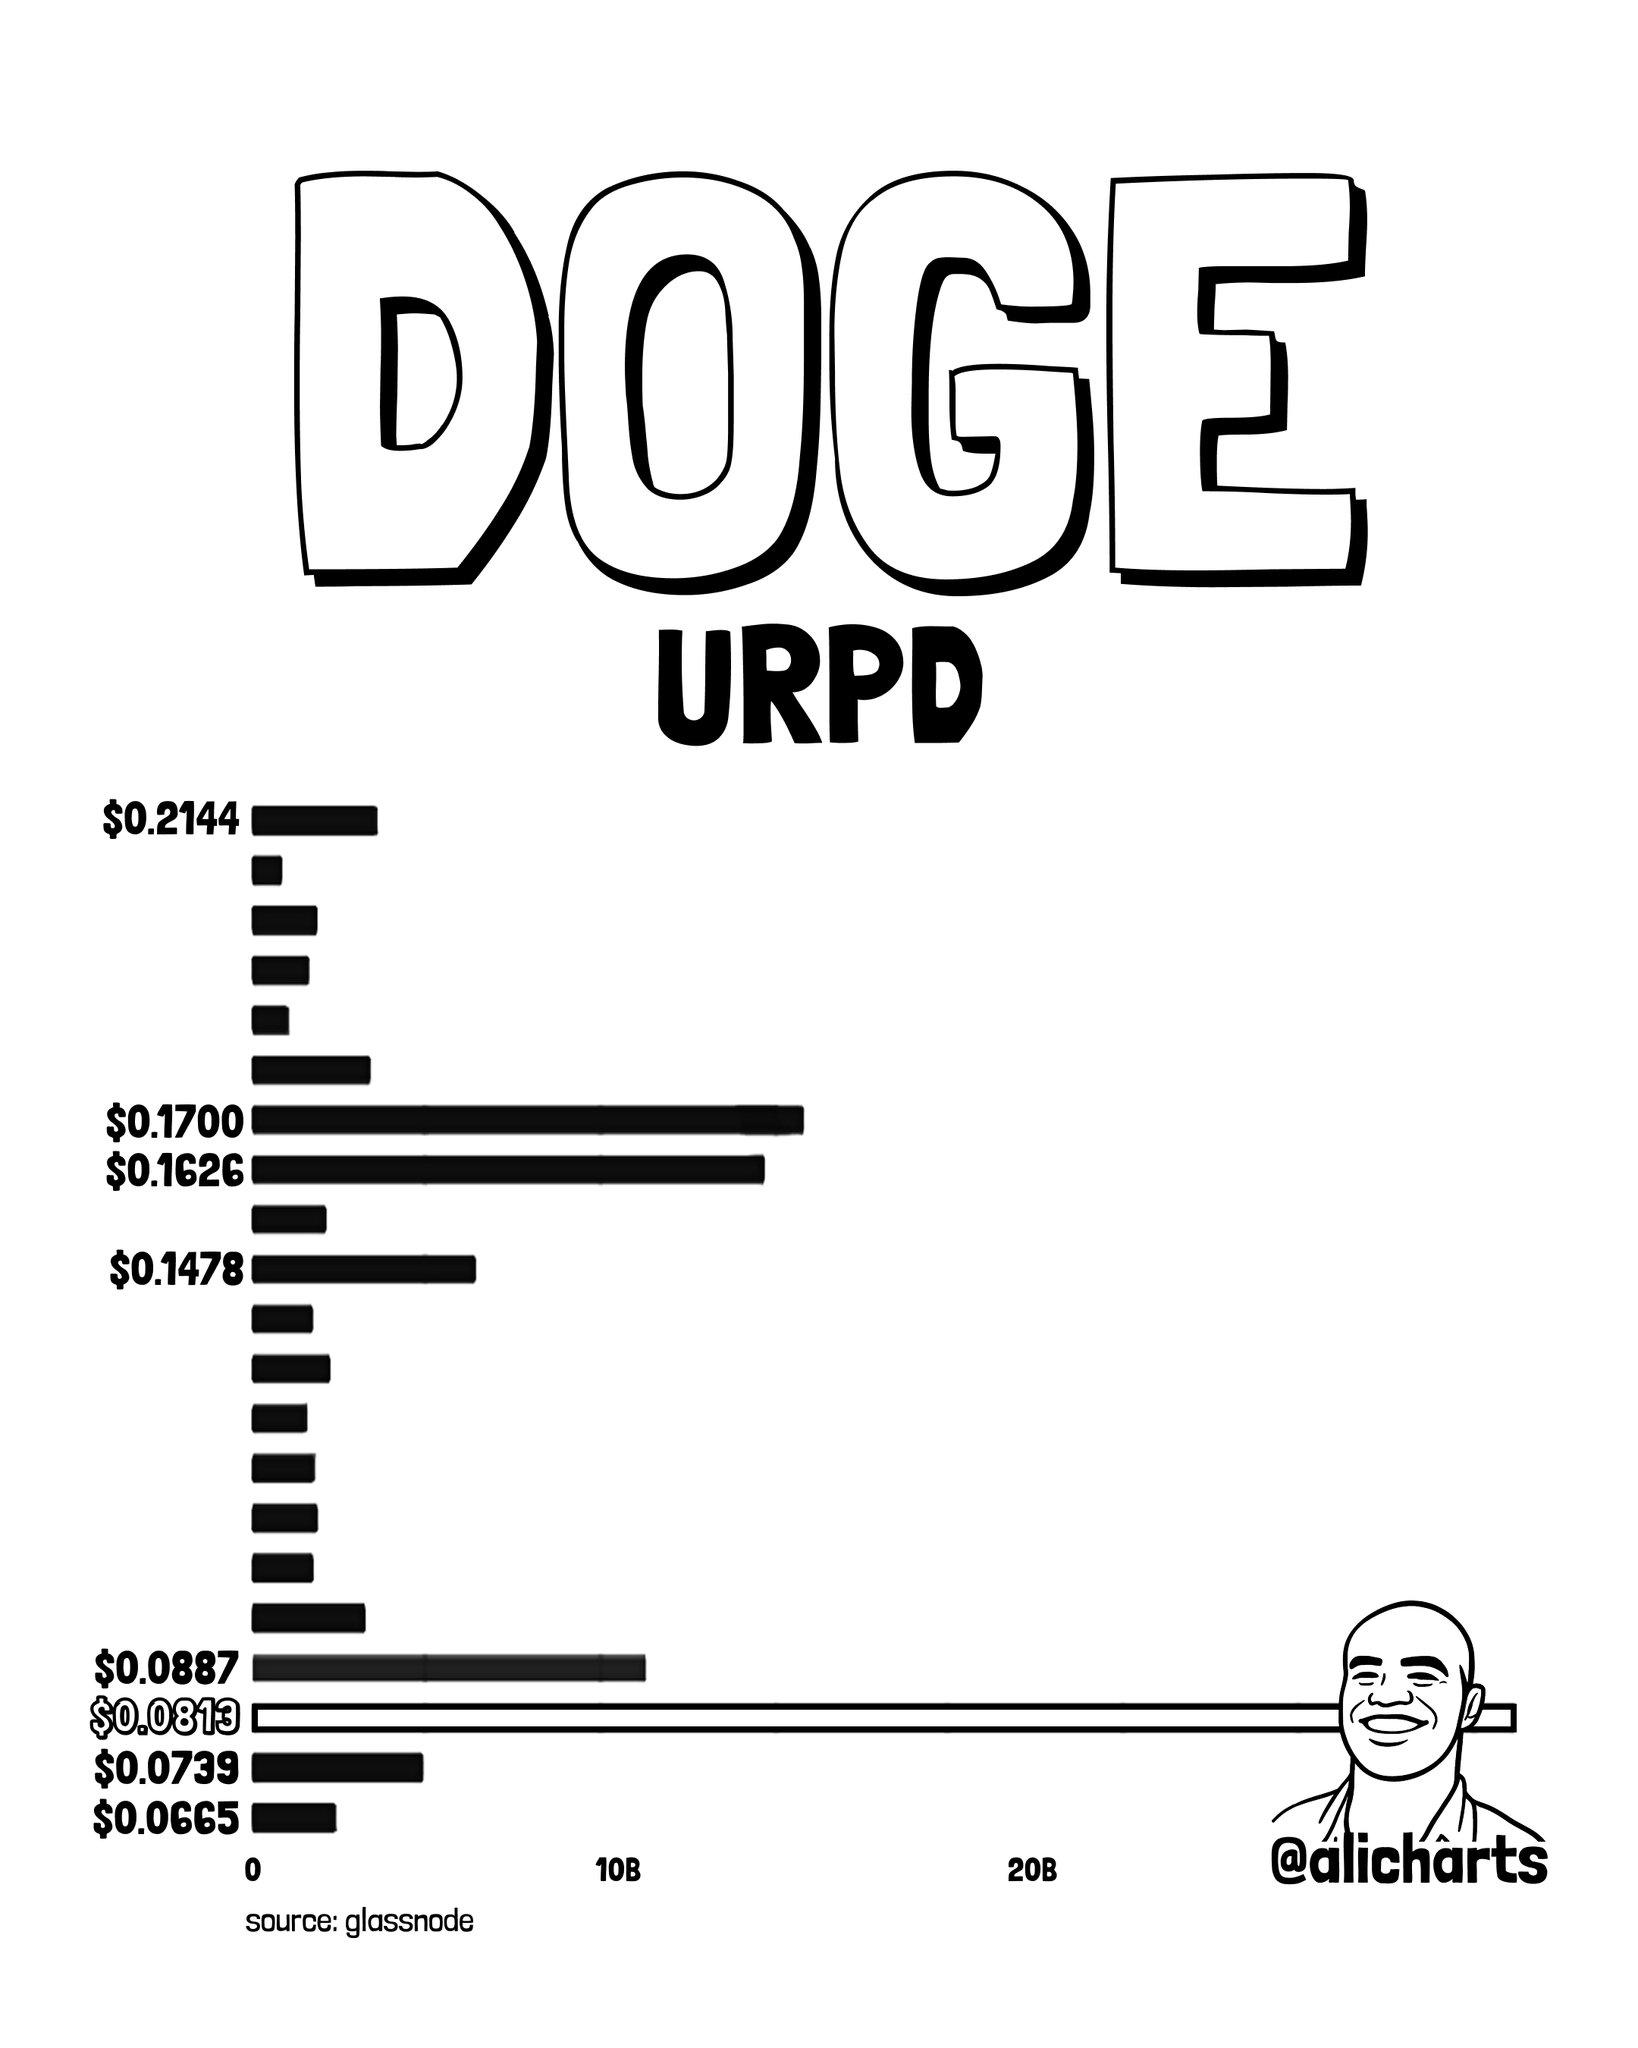
- URPD data shows ~36 billion DOGE in on-chain cost-basis supply concentrated at $0.081 — structural demand anchor
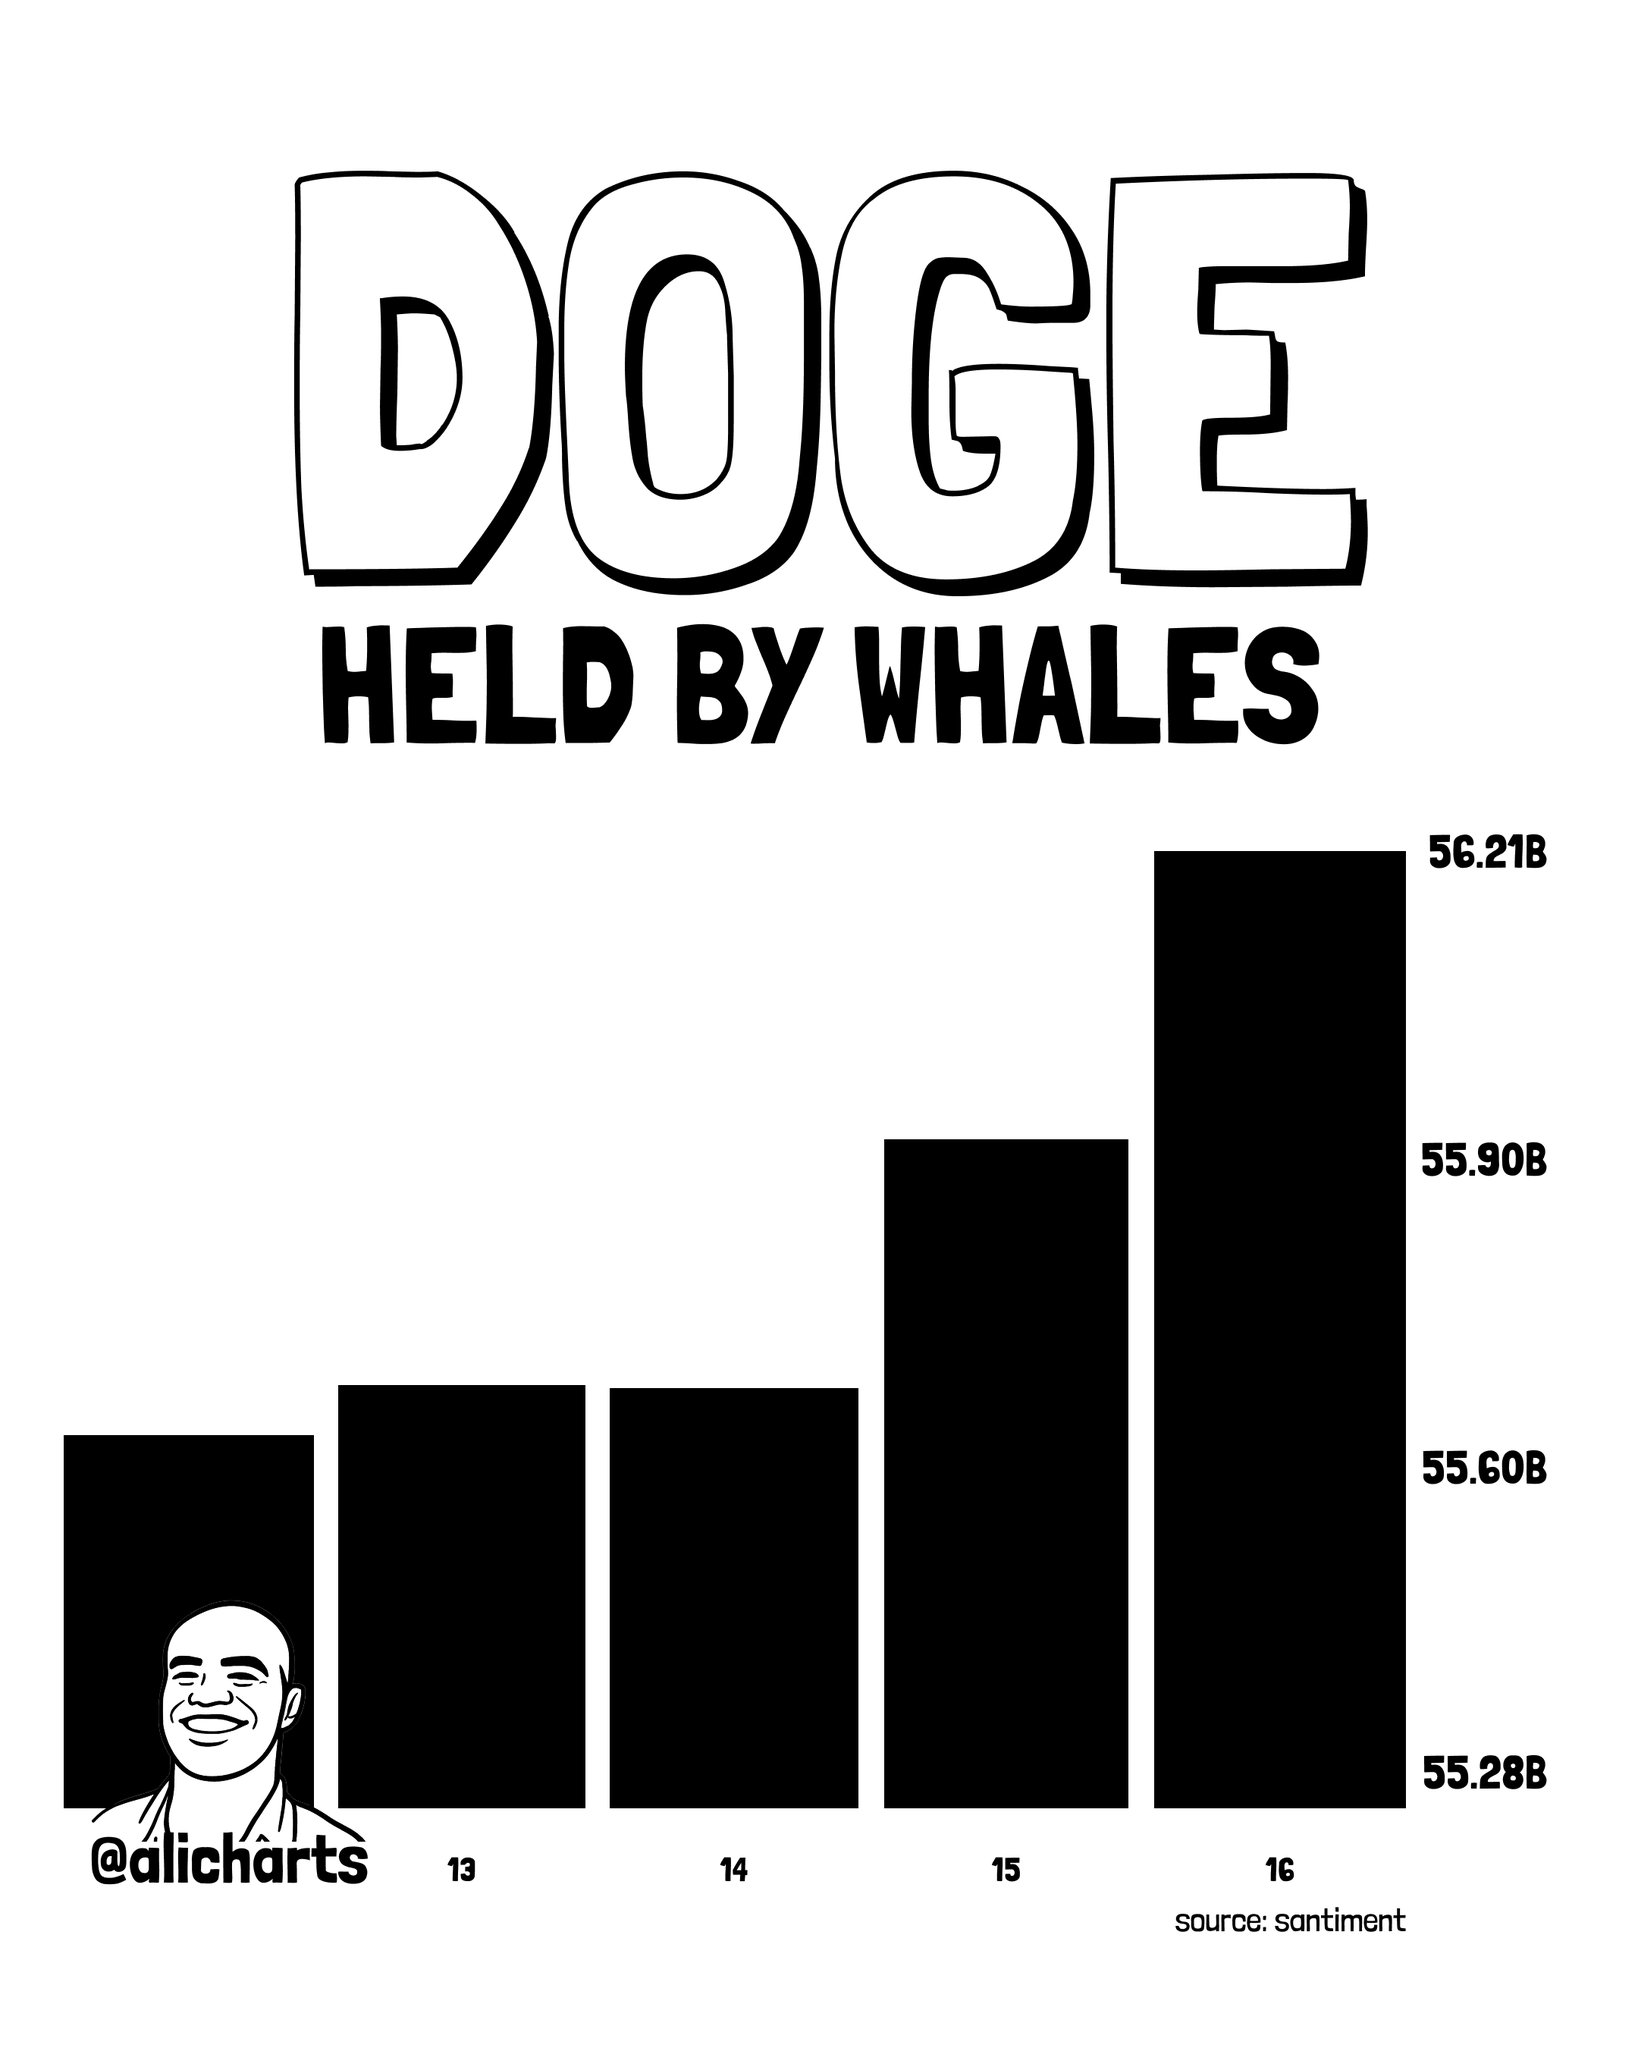
- Whale wallets added ~600M DOGE since October 12; holdings rose from 55.28B to 56.21B across 4 days per on-chain data
- On-chain resistance sits at $0.16–$0.17 — 26 billion DOGE in aggregate cost-basis supply at that zone
Dogecoin is trading near a level that analyst Ali Martinez (@alicharts) describes as a three-way confluence of technical, on-chain, and behavioral signals — and on October 16, 2026, he published a six-part thread laying out each one in sequence.
The signal is not a single indicator. It is three independent measures arriving at the same price — $0.081 — simultaneously. That convergence is the thesis.
Signal 1 — TD Sequential Buy Print on the Daily Chart
The TD Sequential is a price-exhaustion counter developed to identify points where a directional move has run its statistical course. It counts nine consecutive bars closing lower than four bars prior — when that count completes, the indicator prints a “9” and flags potential momentum exhaustion. It does not predict direction; it identifies that sellers have been active for an unusually extended sequence.
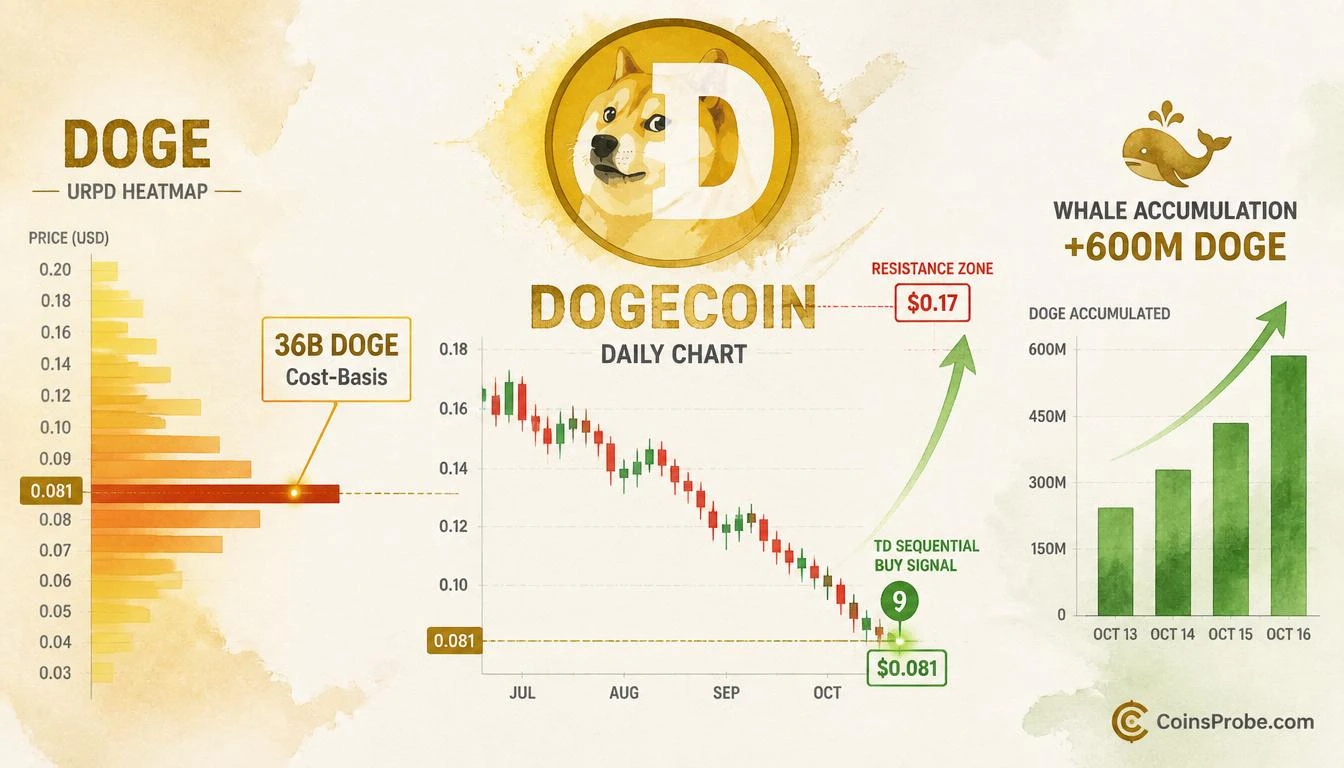
At $0.081, the daily DOGE chart has printed that exact count. The visual marker — a “9” with an upward triangle — appeared at the right edge of the chart near current lows. According to the chart analysis, a prior identical signal at an earlier swing low preceded an +18.74% bounce, while a separate signal at a swing high was followed by a -13.92% decline — confirming the indicator’s symmetrical behavior at exhaustion points in both directions.
Martinez flags this particular print as “especially interesting because of where it appeared” — language that points directly to Signal 2.
Signal 2 — 36 Billion DOGE On-Chain Cost-Basis Cluster at $0.081
The URPD — Unspent Realized Price Distribution — maps the price at which existing DOGE supply last changed hands. A dense cluster at a specific level means a large number of tokens were acquired there, and those holders are sitting at or near breakeven. That creates a natural behavioral floor: holders who bought at $0.081 are unlikely to capitulate at $0.081.
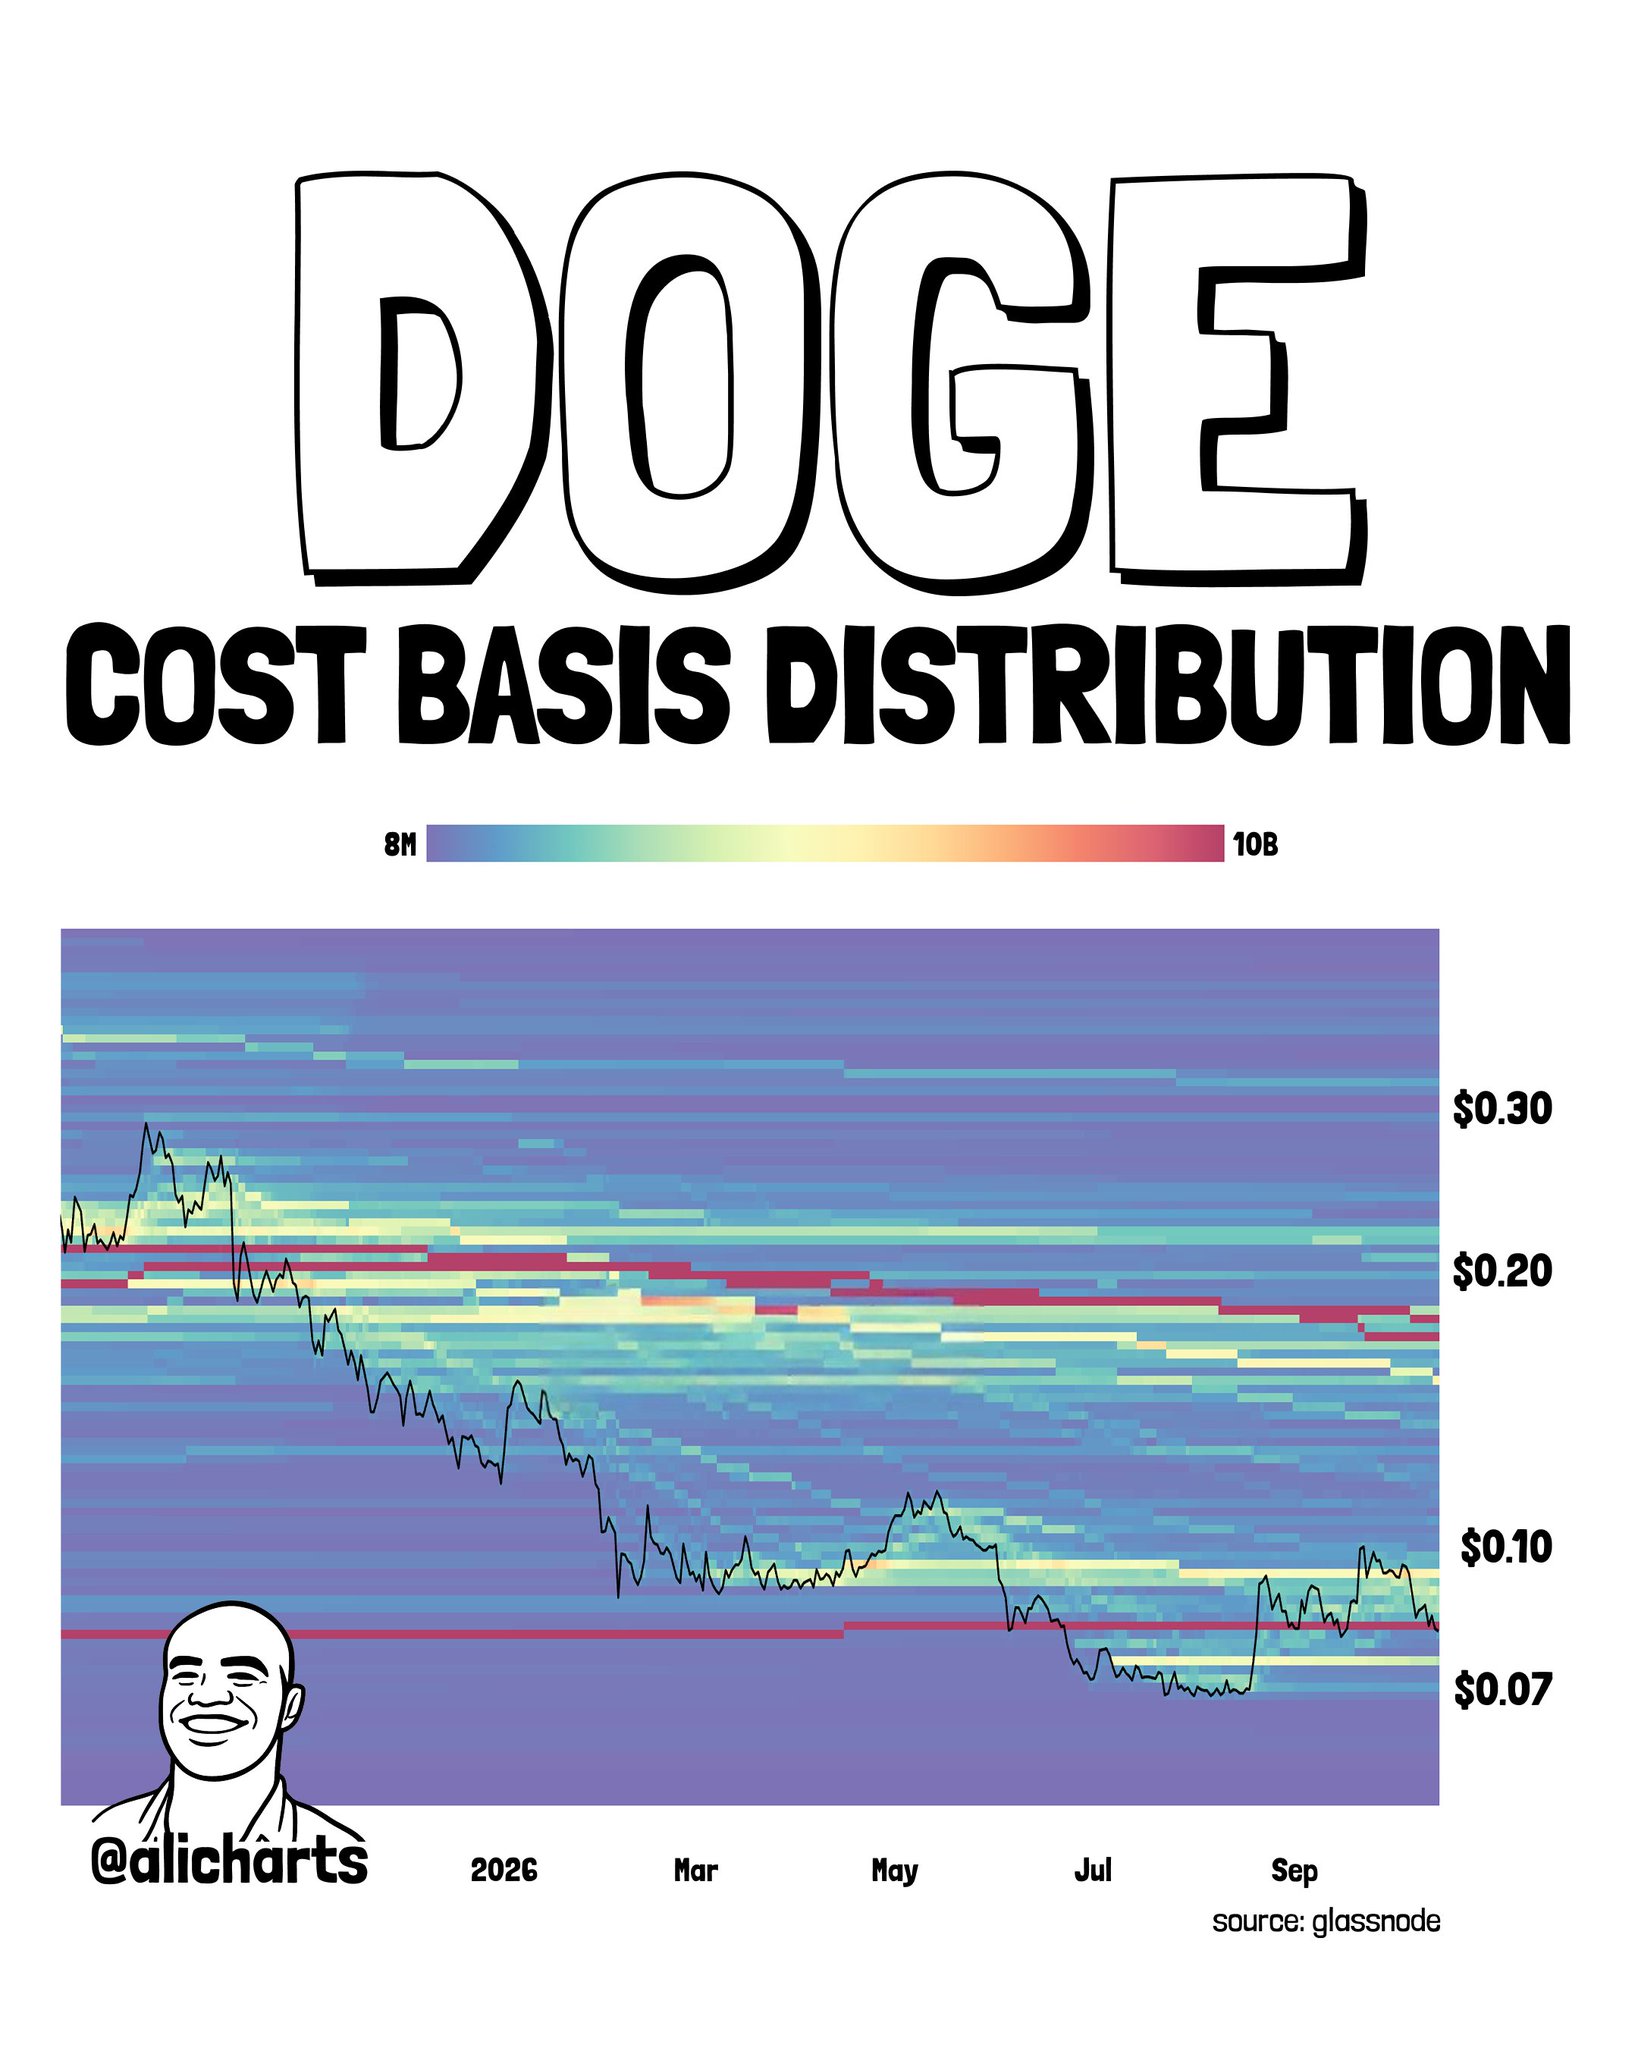
Martinez cites URPD data showing approximately 36 billion DOGE traded at the $0.081 zone. That is not a support line drawn on a chart — it is a record of where actual supply was purchased. The cost-basis heatmap in the thread confirms the picture: a warm-colored horizontal band concentrated at the lower price range, representing the heaviest supply cluster near current levels.
The same heatmap identifies the overhead zone. Dense warm bands at $0.16–$0.17 represent approximately 12 billion DOGE at $0.16 and 14 billion DOGE at $0.17 — the profit-taking zone where underwater holders who recover breakeven may look to exit. That is the natural ceiling for any recovery move, per the on-chain structure.
Signal 3 — Whale Accumulation of ~600 Million DOGE Since October 12
On-chain data tracked by Martinez shows that large DOGE holders — whales — have added approximately 600 million DOGE since October 12. The four-day whale holdings chart (October 13–16) shows a staircase pattern: holdings at the Y-axis rise from the 55.28B baseline on October 13 to 56.21B by October 16 — a consistent, day-over-day increase across each bar without reversal.
The behavioral significance is straightforward: whales are not selling at $0.081. They are adding. When large holders accumulate at the same level that on-chain cost-basis data and a technical exhaustion signal are both flagging, the convergence moves from coincidence to structure.
For broader context on how on-chain whale behavior has informed recent altcoin analysis, see Ethereum After the Binance Leverage Flush — What the Data Says Now.
Why the Confluence Matters More Than Any Single Signal
Each of these three signals can and does appear independently — and independently, each has limitations. The TD Sequential produces both true and false signals. URPD clusters can be breached. Whale accumulation can reverse. But the three arriving at the same price, within the same four-day window, is a different analytical condition.
Martinez’s framing in the thread is explicit: this is a three-reason case built around a single level. The TD Sequential says momentum exhaustion. The URPD says 36 billion tokens are anchored here. The whale chart says the largest holders are not reducing exposure — they are increasing it.
The cost-basis heatmap adds one more layer of structural context: the current price sits below the $0.20 cluster — a heavy band representing supply acquired at significantly higher prices — meaning much of the market is underwater. The $0.081 zone is not where people are panicking out. It is where they bought.
The Level That Determines the Trade
Martinez does not state a formal invalidation level, but the on-chain structure implies one. The 36 billion DOGE cost-basis cluster at $0.081 is the structural anchor. A sustained move decisively below that level — on volume, not a wick — would mean holders who established positions there are now underwater, converting a demand zone into a potential supply zone. That is the scenario that breaks the thesis.
To the upside, the URPD data provides the roadmap. The first meaningful overhead supply sits at $0.16 (approximately 12 billion DOGE) and thickens at $0.17 (approximately 14 billion DOGE). A recovery toward that zone — roughly a +97% to +110% move from $0.081 — is where the on-chain structure anticipates selling pressure to emerge, regardless of any technical signal.
Bullish Scenario
DOGE holds $0.081 on a closing basis, the TD Sequential print acts as a momentum pivot, and whale accumulation continues. First meaningful resistance at $0.16–$0.17 based on URPD data — the zone where 26 billion DOGE in aggregate cost-basis supply creates natural overhead pressure.
Bearish Scenario
A sustained daily close below $0.081 — through the 36B DOGE cost-basis cluster — converts the support zone to supply and invalidates all three signals simultaneously. No analyst-stated downside target is available; the thesis requires $0.081 to hold.
The live price data as of writing reflects a 24-hour gain of +3.80%, with a 7-day decline of -2.27% and a 30-day change of -0.18% — DOGE has been essentially range-bound over the past month, which is consistent with a consolidation at a major on-chain cost-basis level rather than a trending breakdown.
Three independent signals — a TD Sequential “9” on the daily chart, 36 billion DOGE in on-chain cost-basis supply at $0.081, and 600 million DOGE added by whale wallets since October 12 — converge at one price. Martinez’s six-part thread, published October 16, treats that convergence as structurally significant. The on-chain target zone, if the level holds, sits at $0.16–$0.17 where 26 billion DOGE in aggregate supply creates the next wall. Watch $0.081 on a closing basis: that is where the structure either holds or breaks.
Source: x.comFrequently Asked Questions
What is a TD Sequential buy signal and what does it mean for DOGE right now?
What is URPD and why does 36 billion DOGE at $0.081 matter?
Where is the next major resistance level for DOGE based on on-chain data?
What would invalidate the three-signal bullish case for DOGE?
Source: Ali Charts · Published by CoinsProbe Markets Desk
The opinions and market insights shared on CoinsProbe represent the views of individual authors based on prevailing market conditions at the time of publication. Cryptocurrency investments carry significant risk and volatility. Readers are encouraged to conduct their own research and seek professional financial advice before making investment decisions. CoinsProbe and its contributors do not accept responsibility for financial losses or decisions made based on published content.
CoinsProbe may publish sponsored articles, affiliate links, or promotional collaborations. All sponsored material is clearly labeled to maintain transparency with our audience. Our editorial decisions remain fully independent, and advertising partnerships do not influence reviews, rankings, or published opinions.
Since 2023, CoinsProbe has delivered reliable insights on cryptocurrency, blockchain, and digital assets. Our content is created by experienced researchers and analysts who follow strict editorial standards focused on accuracy, transparency, and credibility. Every article is carefully reviewed and verified using trusted sources and current market data. We provide unbiased analysis and timely updates covering everything from emerging crypto projects to major industry developments.