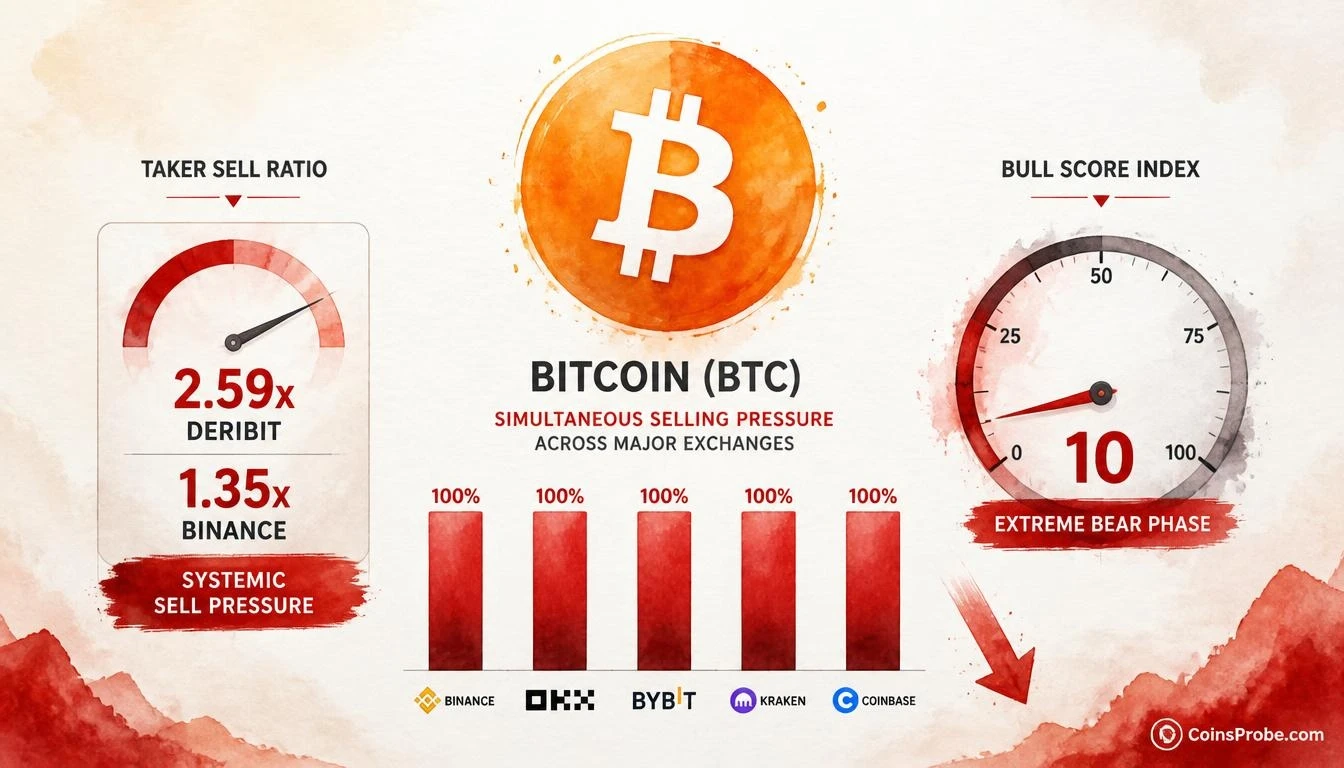

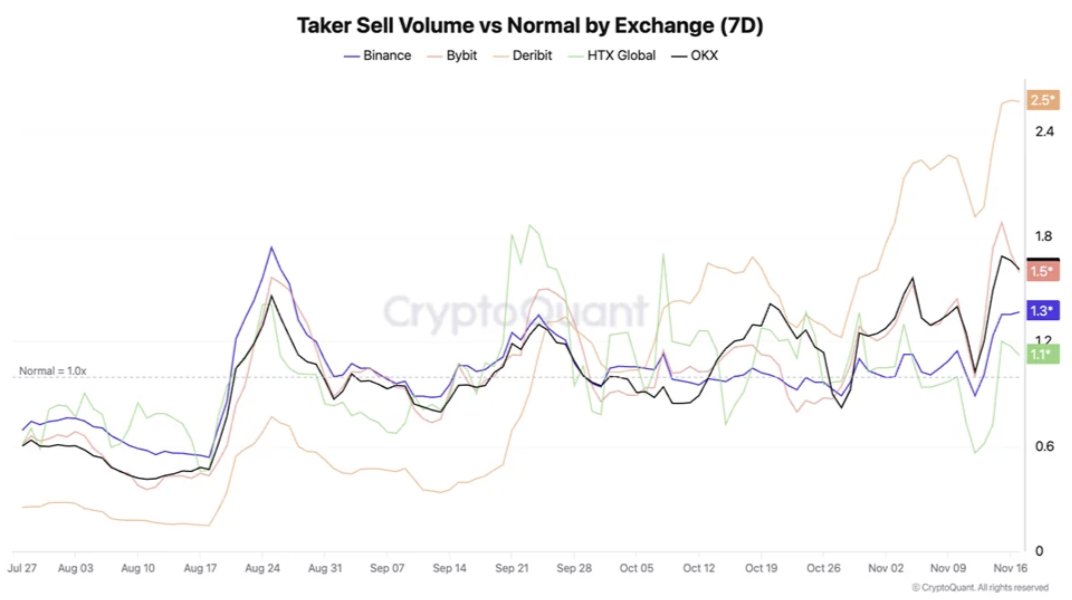
- Bitcoin is trading at $63,181 — down 22% from recent highs — with taker sell pressure hitting 1.35x at Binance and 2.59x at Deribit per CryptoQuant
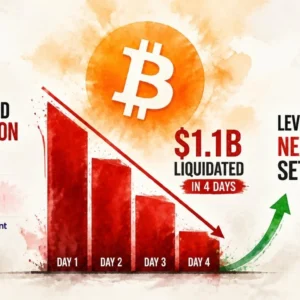
- $1.1B in long positions liquidated over four days; 30-day demand growth fell below -400,000 BTC — deepest contraction since July 1
- CryptoQuant Bull Score Index fell to 10 — "extreme bear phase" — with realized losses of 25,800 BTC on a single day, the largest since July 13
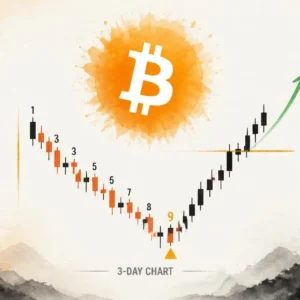
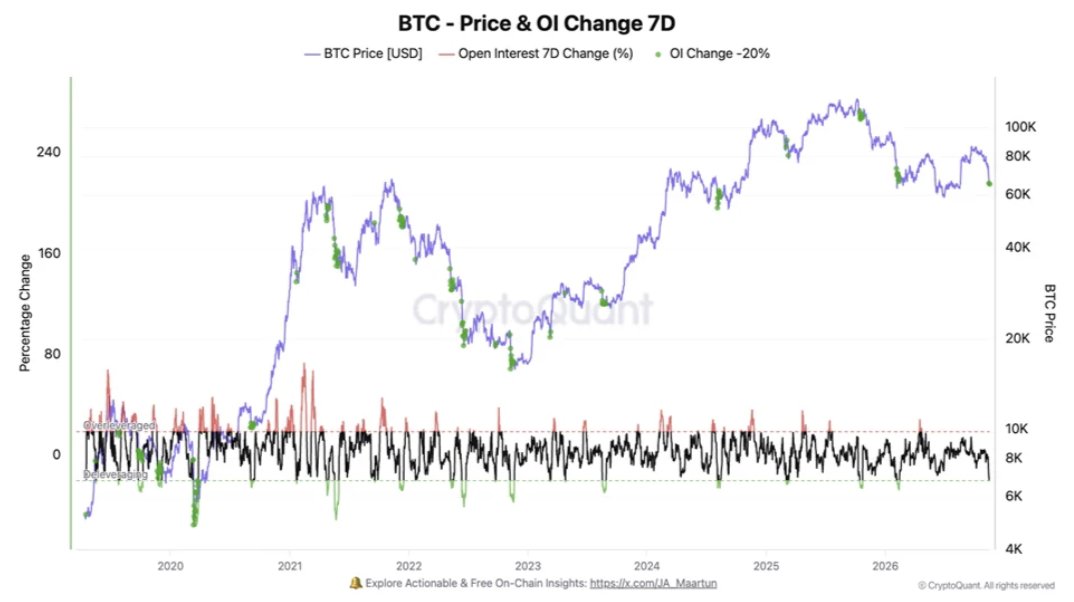
- OI 7-day change triggered a historical green-dot bottom signal, but Bull Score at 10 states no conditions exist for a sustainable recovery yet
Bitcoin is trading at $63,181 — down 0.52% over the past 24 hours and roughly 22% below its recent cycle high — and the nature of that decline tells a more important story than the magnitude. This was not a single whale, a single exchange, or an isolated event. According to CryptoQuant, it was the entire market selling at once.
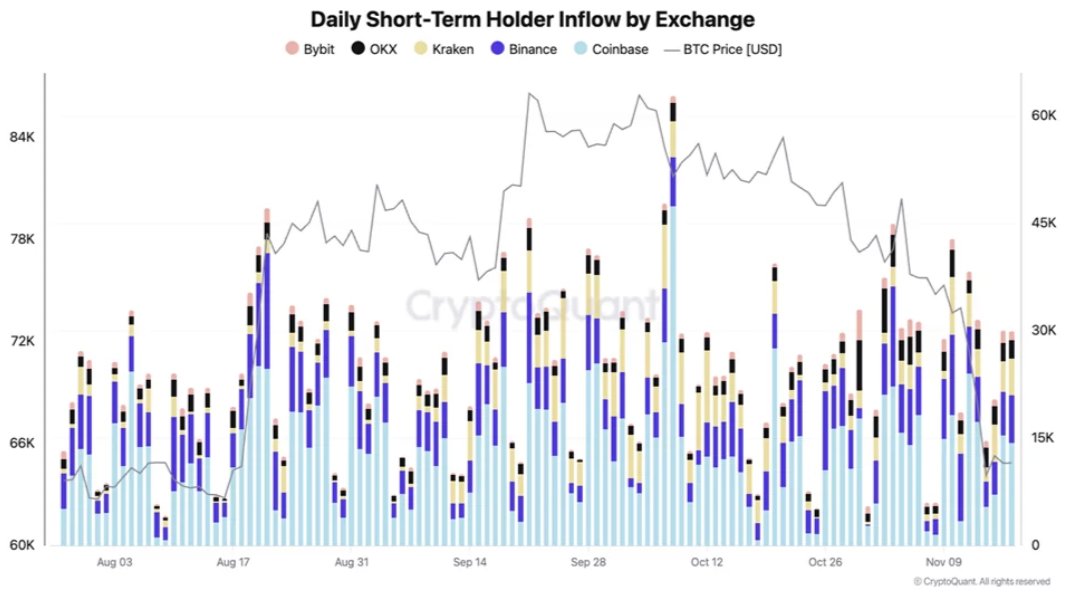
CryptoQuant’s official account (@cryptoquant_com) published a four-chart thread on November 19, 2026 documenting the structural fingerprint of the drawdown: spot inflows and futures selling rose simultaneously across every major venue, with each exchange maintaining near-normal market share proportions. Taker sell pressure ran above the daily average everywhere — from 1.35x at Binance to 2.59x at Deribit — and $1.1 billion in long positions were liquidated across just four days.
Systemic Distribution — Not a Single-Exchange Event
The first chart in CryptoQuant’s thread plots Bitcoin’s short-term holder inflow by exchange across all major venues from August through mid-November 2024. The key observation is structural: Bybit, OKX, Kraken, Binance, and Coinbase all show near-normal market share proportions throughout the drawdown period. No single exchange dominates the inflow picture. That symmetry is not coincidence — it is the signature of coordinated, market-wide distribution rather than a single actor or venue offloading a concentrated position.
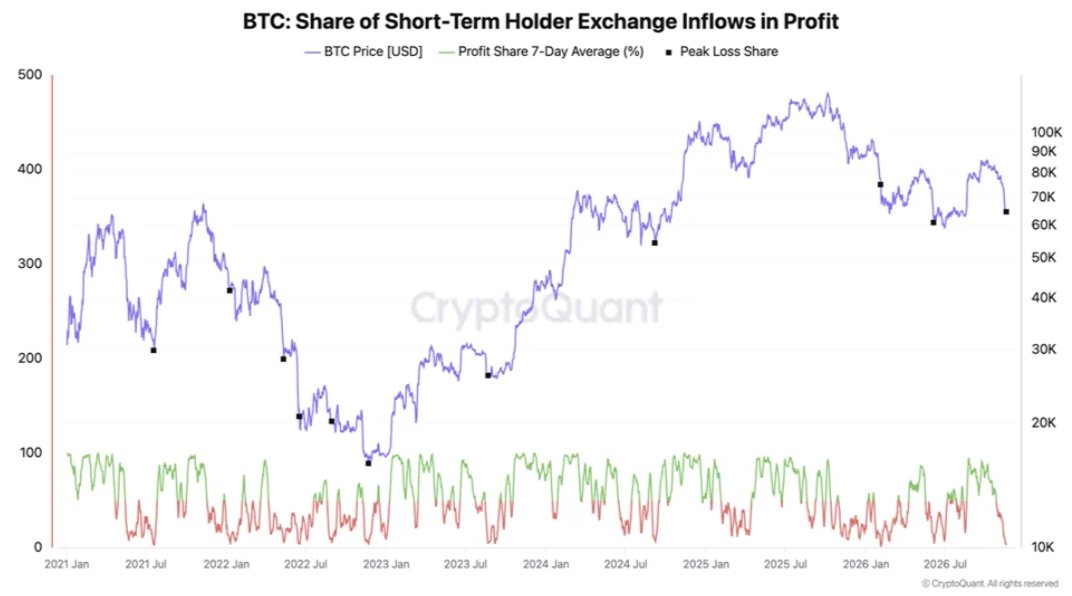
The second chart extends the view across Bitcoin’s full cycle from January 2021 through mid-2026, overlaying profit share and loss share across cycle peaks and troughs. Black square markers denote Peak Loss Share events at prior cycle bottoms. At the right edge of the chart — corresponding to the current drawdown — the profit share line is declining and loss share is rising. CryptoQuant’s published analysis, dated November 17, 2026, confirmed the market had returned to a bearish phase, with realized losses hitting 25,800 BTC in a single day — the largest daily reading since July 13. On a 30-day basis, total Bitcoin demand growth has fallen below negative 400,000 BTC. For context, a 30-day demand contraction of negative 284,000 BTC had marked local bottoms in March 2025 and again in June–July 2026.
Taker Sell Pressure — Above Normal Everywhere
The third chart quantifies the sell-side intensity using a 7-day rolling taker sell volume ratio normalized against each exchange’s baseline. The dashed reference line at 1.0x represents normal selling activity. As of mid-November, every exchange displayed is trading significantly above that baseline — with endpoint readings of 1.1x, 1.3x, 1.5x, and 2.5x printed directly on the chart. HTX Global diverges notably higher than the others at the right edge. CryptoQuant’s tweet makes the exchange-level specifics explicit: Binance taker selling ran at 1.35x above average, while Deribit registered 2.59x. The simultaneous elevation across all venues eliminates the single-exchange explanation and points to broad, market-wide capitulation.
Open Interest Flush — A Signal With Historical Precedent
The fourth chart tracks Bitcoin’s 7-day open interest change percentage from 2019 through 2026, with two horizontal dashed thresholds marking overbought and oversold extremes. Green dots appear at readings where the OI 7-day change drops below the lower threshold — historically associated with local price bottoms. At the latest data point, a green dot has appeared, with the OI change at or near the lower dashed line. The chart’s own legend labels these zones: “Overbought/Topped” near the upper threshold and “Oversold/Bottom” near the lower. The -20% OI change threshold is explicitly labeled on the chart. Prior green dot instances correspond to points where aggressive long liquidations preceded recoveries — the $1.1 billion in four-day liquidations documented in this event places it squarely in that category.
Bull Score Index Hits 10 — Extreme Bear Phase
The systemic selling data aligns with CryptoQuant’s composite Bull Score Index, which aggregates ten independent on-chain signals into a single 0–100 reading. As of November 17, 2026, that index had fallen to 10 — the firm’s definition of an extreme bear phase. CryptoQuant’s published analysis states the reading “indicates there are no conditions for a sustainable price recovery and rally.” The unrealized profit-and-loss margin for traders fell simultaneously to negative 20%, its weakest reading since July 1. Spot demand is leading the contraction, while perpetual-futures demand has also turned negative as long positions were sold and liquidated.
The historical parallel CryptoQuant draws is April 2025, when a tariff-related market sell-off pushed the Bull Score to 20 before it recovered to 80 within two months as the market found its bottom. A separate CryptoQuant analyst has noted that the intensified sell-off, if sustained, threatens a new bear-market low in the region of $50,000. That level has not been confirmed by CryptoQuant’s core analysis — it represents a risk scenario, not a base case.
This context connects to the broader structural picture tracked in prior analysis: Bitcoin’s loss of its 200-day moving average placed the 200-week MA as the last major structural support, while the Power Law Oscillator at 34.5 remains far from the extreme readings that historically precede major cycle tops.
What the Data Confirms — And What It Doesn’t
The CryptoQuant thread answers a specific and important question: where did the selling come from? The answer is unambiguous — it came from everywhere simultaneously. Each exchange’s share of total spot inflows remained near normal, which means the pressure was distributed, not concentrated. That eliminates the narrative of a single large actor engineering the move.
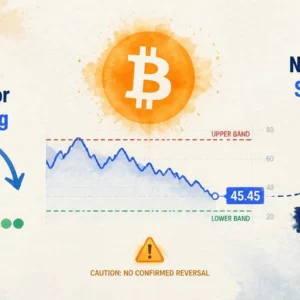
What the data does not resolve is direction from here. The OI flush and the green dot on Chart 4 are historically associated with bottoming conditions — but they are non-directional signals. They quantify exhaustion, not reversal. CryptoQuant’s Bull Score at 10 explicitly states there are currently no conditions for a sustainable recovery. The two readings coexist: the sell-side flush is historically consistent with bottoming, while the composite on-chain regime remains in extreme bear territory.
The metric to watch, per CryptoQuant’s published analysis, is total Bitcoin demand growth on a 30-day basis. It currently sits below negative 400,000 BTC. The prior local bottoms in March 2025 and June–July 2026 formed when that figure approached negative 284,000 BTC — a level that represented maximum contraction before stabilization. Whether the current contraction exceeds that historical floor or begins to recover toward it will determine whether the OI flush green dot marks a genuine bottom or a temporary pause.
Watch $62,380 — the price level at which CryptoQuant’s analysis was published — as the near-term reference point. A sustained recovery in the 30-day demand growth figure turning less negative, combined with the Bull Score recovering off the 10 reading, would be the two conditions required before CryptoQuant’s framework would indicate conditions for a sustainable rally.
Source: x.comFrequently Asked Questions
What does it mean that every exchange sold Bitcoin simultaneously?
What is the CryptoQuant Bull Score Index and what does a reading of 10 mean?
Does the open interest flush green dot signal a Bitcoin bottom?
What metric should traders watch to identify when Bitcoin’s demand contraction is reversing?
Source: CryptoQuant · Published by CoinsProbe Markets Desk
The opinions and market insights shared on CoinsProbe represent the views of individual authors based on prevailing market conditions at the time of publication. Cryptocurrency investments carry significant risk and volatility. Readers are encouraged to conduct their own research and seek professional financial advice before making investment decisions. CoinsProbe and its contributors do not accept responsibility for financial losses or decisions made based on published content.
CoinsProbe may publish sponsored articles, affiliate links, or promotional collaborations. All sponsored material is clearly labeled to maintain transparency with our audience. Our editorial decisions remain fully independent, and advertising partnerships do not influence reviews, rankings, or published opinions.
Since 2023, CoinsProbe has delivered reliable insights on cryptocurrency, blockchain, and digital assets. Our content is created by experienced researchers and analysts who follow strict editorial standards focused on accuracy, transparency, and credibility. Every article is carefully reviewed and verified using trusted sources and current market data. We provide unbiased analysis and timely updates covering everything from emerging crypto projects to major industry developments.