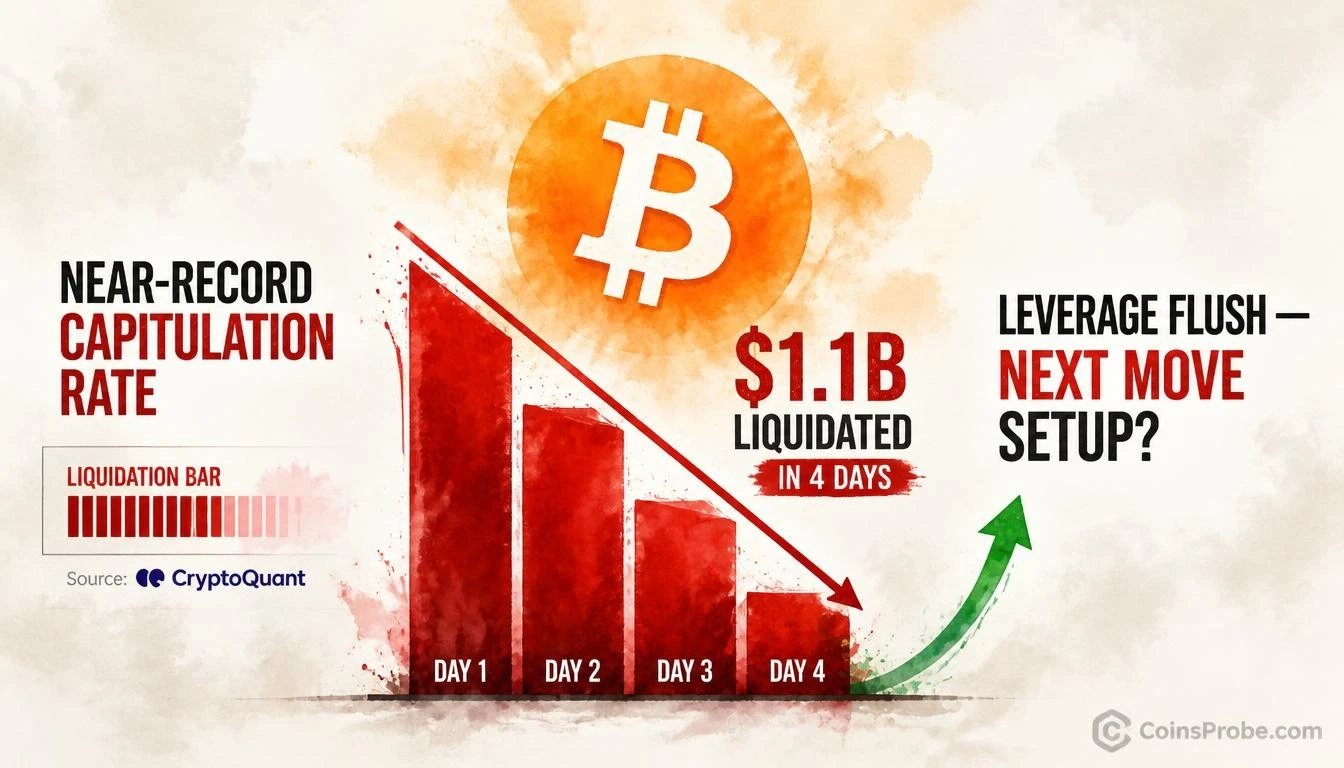

- $1.1B in Bitcoin long positions liquidated over four days at a near-record capitulation rate per CryptoQuant
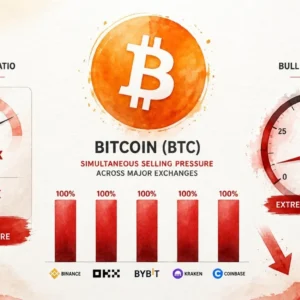
- Taker sell ratios ranged from 1.35x on Binance to 2.59x on Deribit — elevated across every major venue simultaneously
- Bitcoin's 22% decline was driven by synchronized spot inflows and futures selling across all major exchanges
- CryptoQuant argues the leverage flush may set up the next move by removing forced selling pressure from the market
Bitcoin is weathering one of its sharpest deleveraging events of the current cycle. Following a 22% price decline, the market has absorbed $1.1 billion in long liquidations across just four days — a near-record capitulation rate that on-chain analytics platform CryptoQuant argues may be clearing the structural conditions for the next meaningful move.
The signal comes from CryptoQuant’s latest dashboard update, which characterizes the ongoing selling as recent buyers capitulating at a near-record rate. The framing is deliberate: capitulation, historically, marks the moment where the weakest hands exit — and where the technical setup for a recovery typically begins to form.
$1.1 Billion in Four Days — What the Liquidation Data Shows
The scale of the leverage flush is the first data point that matters here. $1.1 billion in long positions liquidated over a four-day window is not routine selling pressure. It is a forced exit event — the market mechanically closing leveraged positions that could no longer meet margin requirements as price fell.
CryptoQuant’s thread, published November 19, 2026, connects this directly to synchronized behavior across all major venues. Taker sell ratios ran above average on every exchange monitored — ranging from 1.35x on Binance to as high as 2.59x on Deribit. Crucially, spot inflows and futures selling moved simultaneously, which the platform characterizes as a normal share distribution pattern rather than speculative panic. The selling was broad, not isolated to one venue or instrument.
What makes this reading notable is the near-record classification. CryptoQuant’s data places the current capitulation rate among the highest observed in this cycle — not the absolute peak of all time, but close enough to place the current event in a historically significant category. When recent buyers exit at this velocity, the pool of sellers who entered at elevated prices is being rapidly exhausted.
Why a Leverage Flush Can Set Up the Next Move
The mechanism here is straightforward, and it is structural rather than speculative. Leveraged long positions create two distinct risks for a market: they amplify upward moves on the way in, and they create forced selling on the way down when margin calls trigger. When those positions are liquidated at scale, the forced selling pressure they represent is removed from the equation.
What remains after a leverage flush is a market populated primarily by spot holders — participants who bought without leverage and have no margin call forcing them to sell. These holders are, by definition, more patient and less price-sensitive in the short term. The liquidation cascade clears the air. It does not guarantee a recovery, but it removes the mechanical selling engine that can accelerate declines.
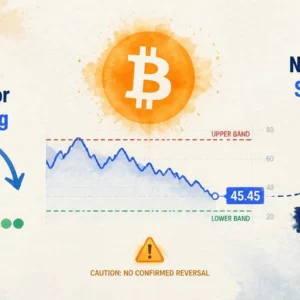
This dynamic has appeared in prior Bitcoin correction cycles. The Bitcoin NUPL and MVRV Z-Score data during previous capitulation windows has consistently shown that the deepest fear readings tend to precede, not follow, the strongest recovery phases. Similarly, the Bitcoin SSR Oscillator’s behavior during prior deleveraging events has flagged improving liquidity conditions in the aftermath of large liquidation clusters — though confirmation is never immediate.
The 22% Drop — Context for the Capitulation
The liquidation event does not exist in isolation. CryptoQuant’s prior thread in the same analytical sequence establishes that Bitcoin’s 22% decline was driven by a specific combination: simultaneous spot inflows and futures selling across every major exchange. This is not the same as a single-venue panic or a derivatives-only squeeze. When spot and futures markets move in the same direction with elevated taker sell ratios across Binance, Deribit, and other venues simultaneously, the signal is a broad-based, real-money exit — not a technical artefact of one market structure.
That context matters for interpreting the $1.1 billion figure. The longs that were liquidated were not all speculative day-trade positions. A portion of them represented recent buyers — participants who entered during the most recent price advance — now being forced out at a loss. CryptoQuant labels this capitulation precisely because the exits are coming from holders who bought near the top, not from long-term holders rotating.
What Remains Unconfirmed — and What to Watch
CryptoQuant’s dashboard points to a potential setup. The word “potential” is load-bearing. A leverage flush clears one category of selling pressure. It does not eliminate spot selling, macro-driven outflows, or ETF redemptions. The platform does not name a specific price recovery target or a confirmed bottom level in the available data — and this article will not invent one.
What the data does establish with precision: $1.1 billion in forced long exits over four days at a near-record capitulation rate, synchronized across spot and futures markets, following a 22% decline. The structural argument for a setup is that this magnitude of liquidation rarely repeats immediately. The leverage that was supporting price above current levels has now been cleared.
Traders watching this setup will want to track two things specifically: whether taker sell ratios on Binance and Deribit normalize back toward 1.0x in the sessions ahead, and whether spot inflows into exchanges continue at elevated rates or begin to decline. If sell-side pressure from both metrics retreats simultaneously, the thesis that the flush has set up the next move gains on-chain confirmation. If spot selling continues even after the futures leverage has been cleared, the structural case weakens.
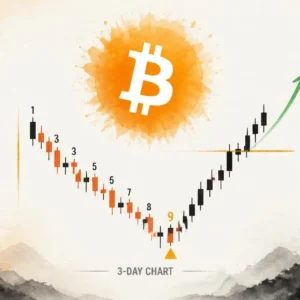
For prior context on Bitcoin’s technical signals during comparable periods, the TD Sequential buy signal analysis from an earlier correction phase documents how momentum exhaustion indicators have behaved at similar capitulation junctures.
The $1.1 billion liquidation event is documented and near-record in rate. Whether it marks the low or merely a pause in continued deleveraging will be answered by taker sell ratios and spot flow data on CryptoQuant’s live dashboard in the sessions ahead.
Source: x.comFrequently Asked Questions
What does a $1.1B long liquidation event mean for Bitcoin’s price?
What is a ‘leverage flush’ and why does CryptoQuant consider it a potential setup?
What taker sell ratios did CryptoQuant record during Bitcoin’s 22% decline?
What specific metrics would confirm that the leverage flush has actually set up a recovery?
Source: CryptoQuant · Published by CoinsProbe Markets Desk
The opinions and market insights shared on CoinsProbe represent the views of individual authors based on prevailing market conditions at the time of publication. Cryptocurrency investments carry significant risk and volatility. Readers are encouraged to conduct their own research and seek professional financial advice before making investment decisions. CoinsProbe and its contributors do not accept responsibility for financial losses or decisions made based on published content.
CoinsProbe may publish sponsored articles, affiliate links, or promotional collaborations. All sponsored material is clearly labeled to maintain transparency with our audience. Our editorial decisions remain fully independent, and advertising partnerships do not influence reviews, rankings, or published opinions.
Since 2023, CoinsProbe has delivered reliable insights on cryptocurrency, blockchain, and digital assets. Our content is created by experienced researchers and analysts who follow strict editorial standards focused on accuracy, transparency, and credibility. Every article is carefully reviewed and verified using trusted sources and current market data. We provide unbiased analysis and timely updates covering everything from emerging crypto projects to major industry developments.