
- Bitcoin is trading at approximately $80,800 — up +8.86% over 30 days — with a market cap exceeding $1.62 trillion.
- USDT Dominance (USDT.D) has broken below its long-term ascending diagonal support — a historically significant signal that capital is rotating from stablecoins back into risk assets.
- The US Dollar Index (DXY) is displaying a structurally identical fractal to USDT.D — both breaking down from matching rectangular consolidation zones — reinforcing the crypto-bullish setup.
- The critical level to watch: 6.50–6.76% on USDT.D. A sustained break below this zone alongside continued DXY weakness would significantly strengthen the case for a broad crypto market advance.
Bitcoin is holding steady near $80,800 — but the most important signal for the next major move may not be on Bitcoin’s own chart. Two macro indicators — USDT Dominance and the US Dollar Index — are simultaneously breaking down from long-term structural levels in a way that has historically preceded some of the strongest rally periods in Bitcoin’s cycle.
As we covered in our USDT.D fractal analysis and our Bitcoin 200 SMA fractal article, macro dominance indicators are often more predictive of Bitcoin’s next major directional move than price action alone — and the current setup across both USDT.D and DXY is one of the cleaner macro signals the market has produced in months.
USDT Dominance — The Breakdown That Matters
USDT Dominance measures the percentage of the total crypto market cap held in Tether (USDT) — essentially measuring how much capital is sitting in defensive stablecoin positions rather than deployed in risk assets. When USDT.D falls, capital is rotating out of stablecoins and into cryptocurrencies. When it rises, the opposite is happening.
The current technical development on USDT.D is significant for one specific reason: price has broken below a multi-year ascending diagonal support level that has held as the floor of USDT.D’s macro structure for an extended period.
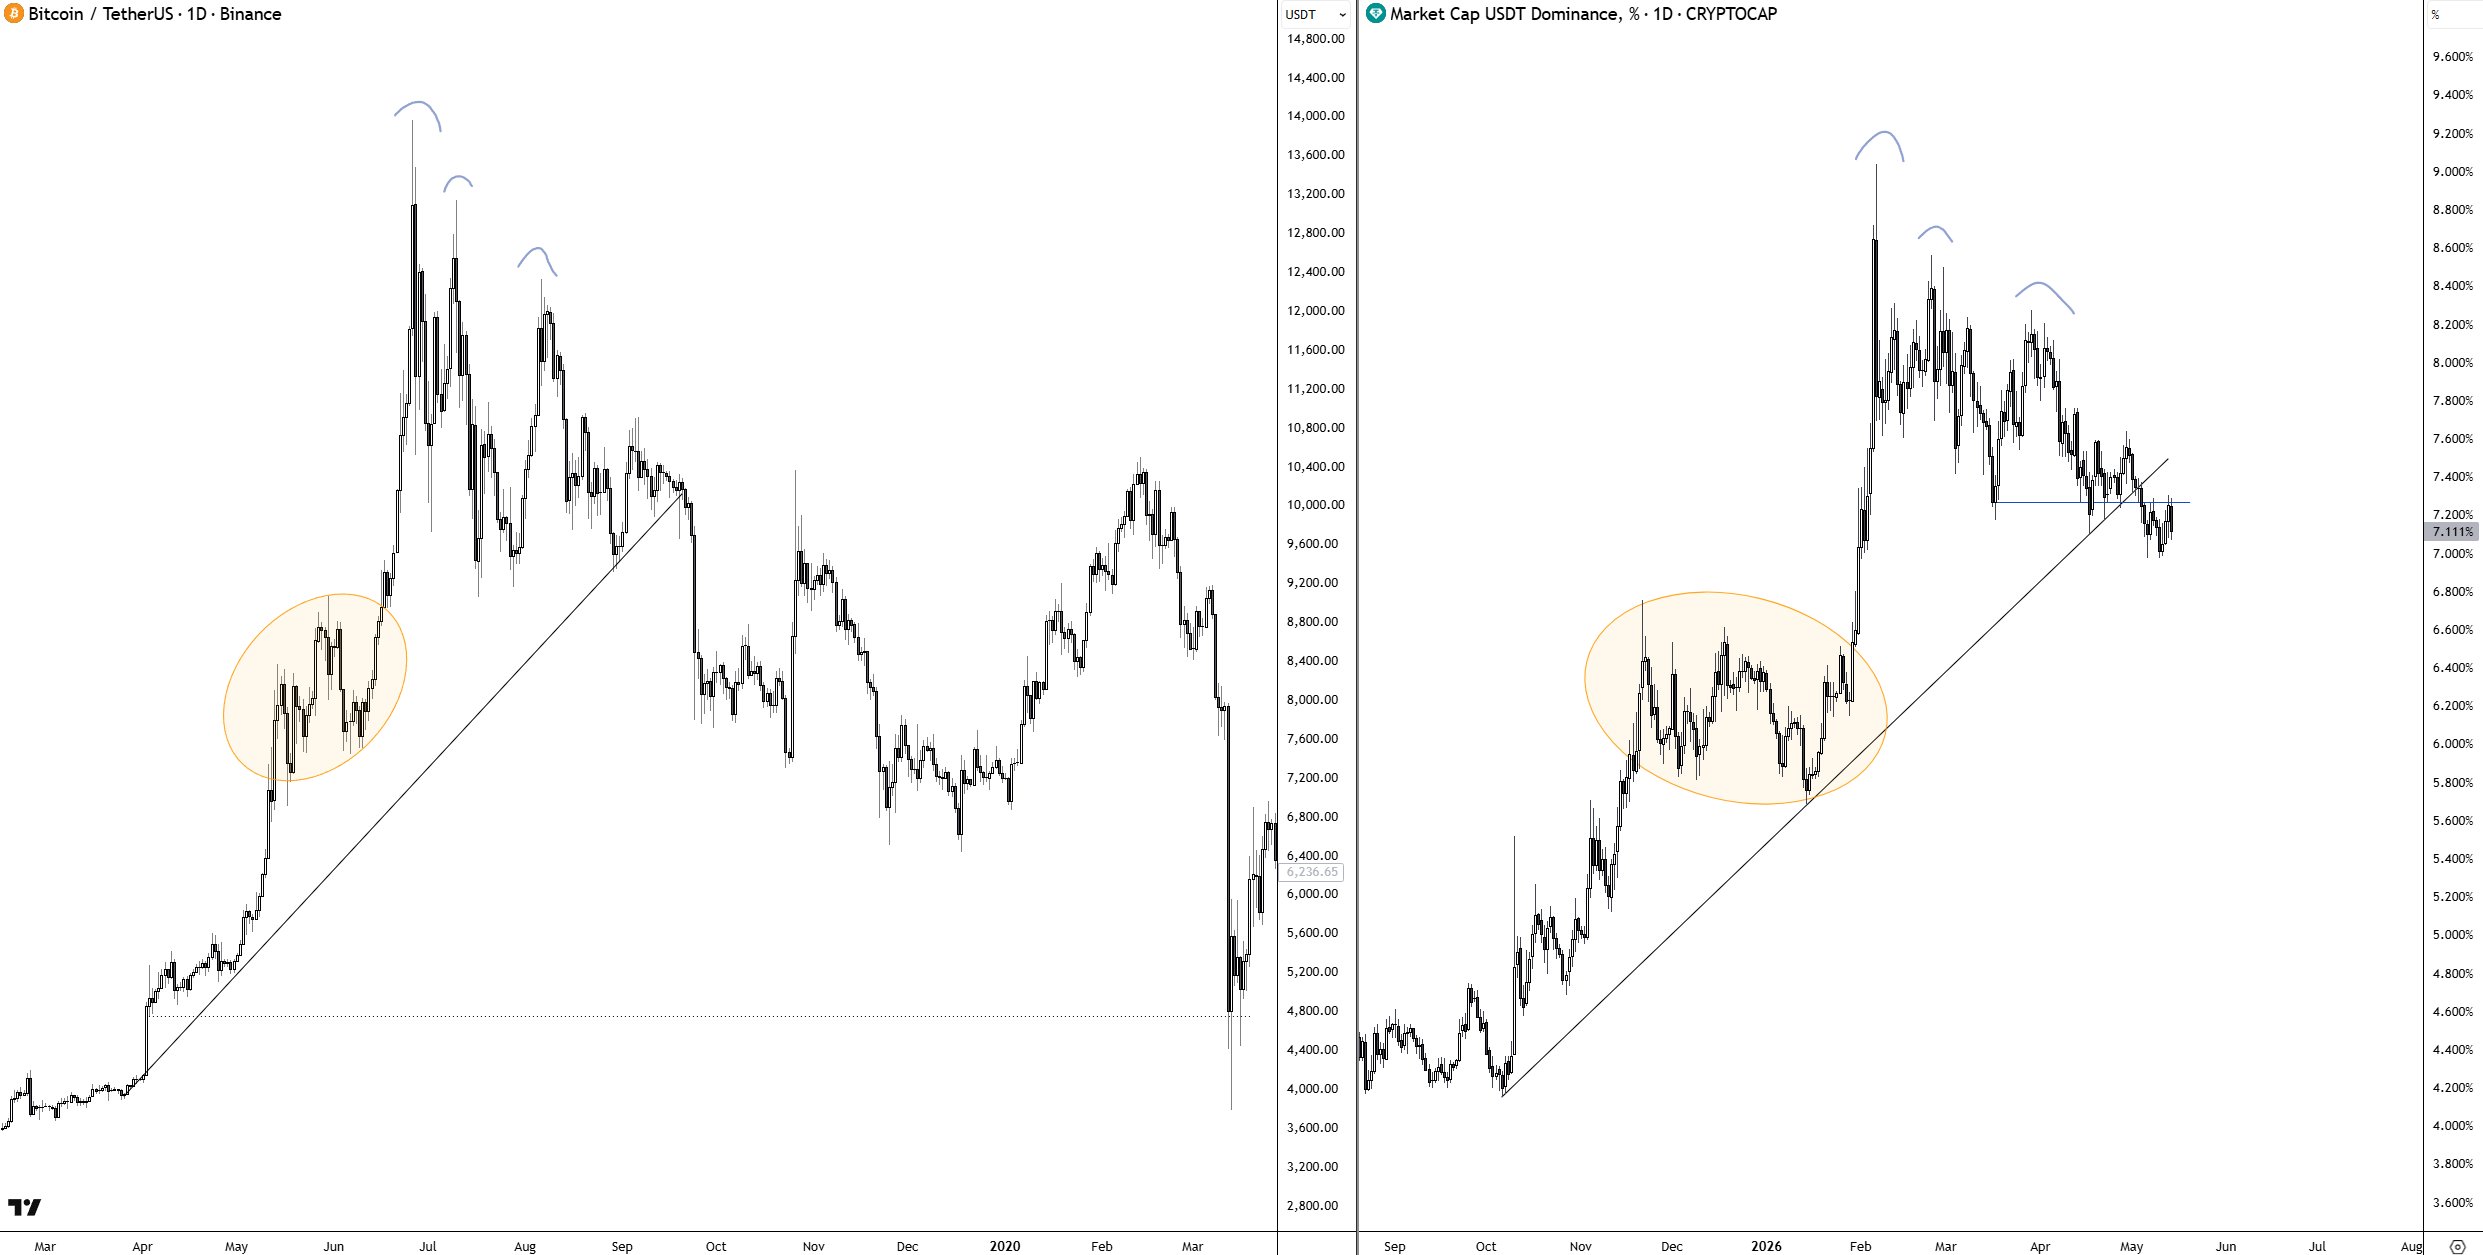
The breakdown has occurred alongside acceptance below a key horizontal support zone — meaning the diagonal break is not a one-candle wick rejection but a sustained structural move below the level. This combination — diagonal break plus horizontal support loss — is the more definitive version of the signal.
Historically, USDT.D breaking below comparable diagonal levels has consistently coincided with strong Bitcoin rally phases — as the capital that was defensively parked in stablecoins flows back into BTC, ETH, and altcoins. The current setup mirrors those prior instances closely.
DXY Fractal — The Corroborating Signal
The USDT.D breakdown does not exist in isolation. Weekly chart analysis reveals a structurally identical fractal forming simultaneously on the US Dollar Index (DXY) — and the parallel is difficult to dismiss.
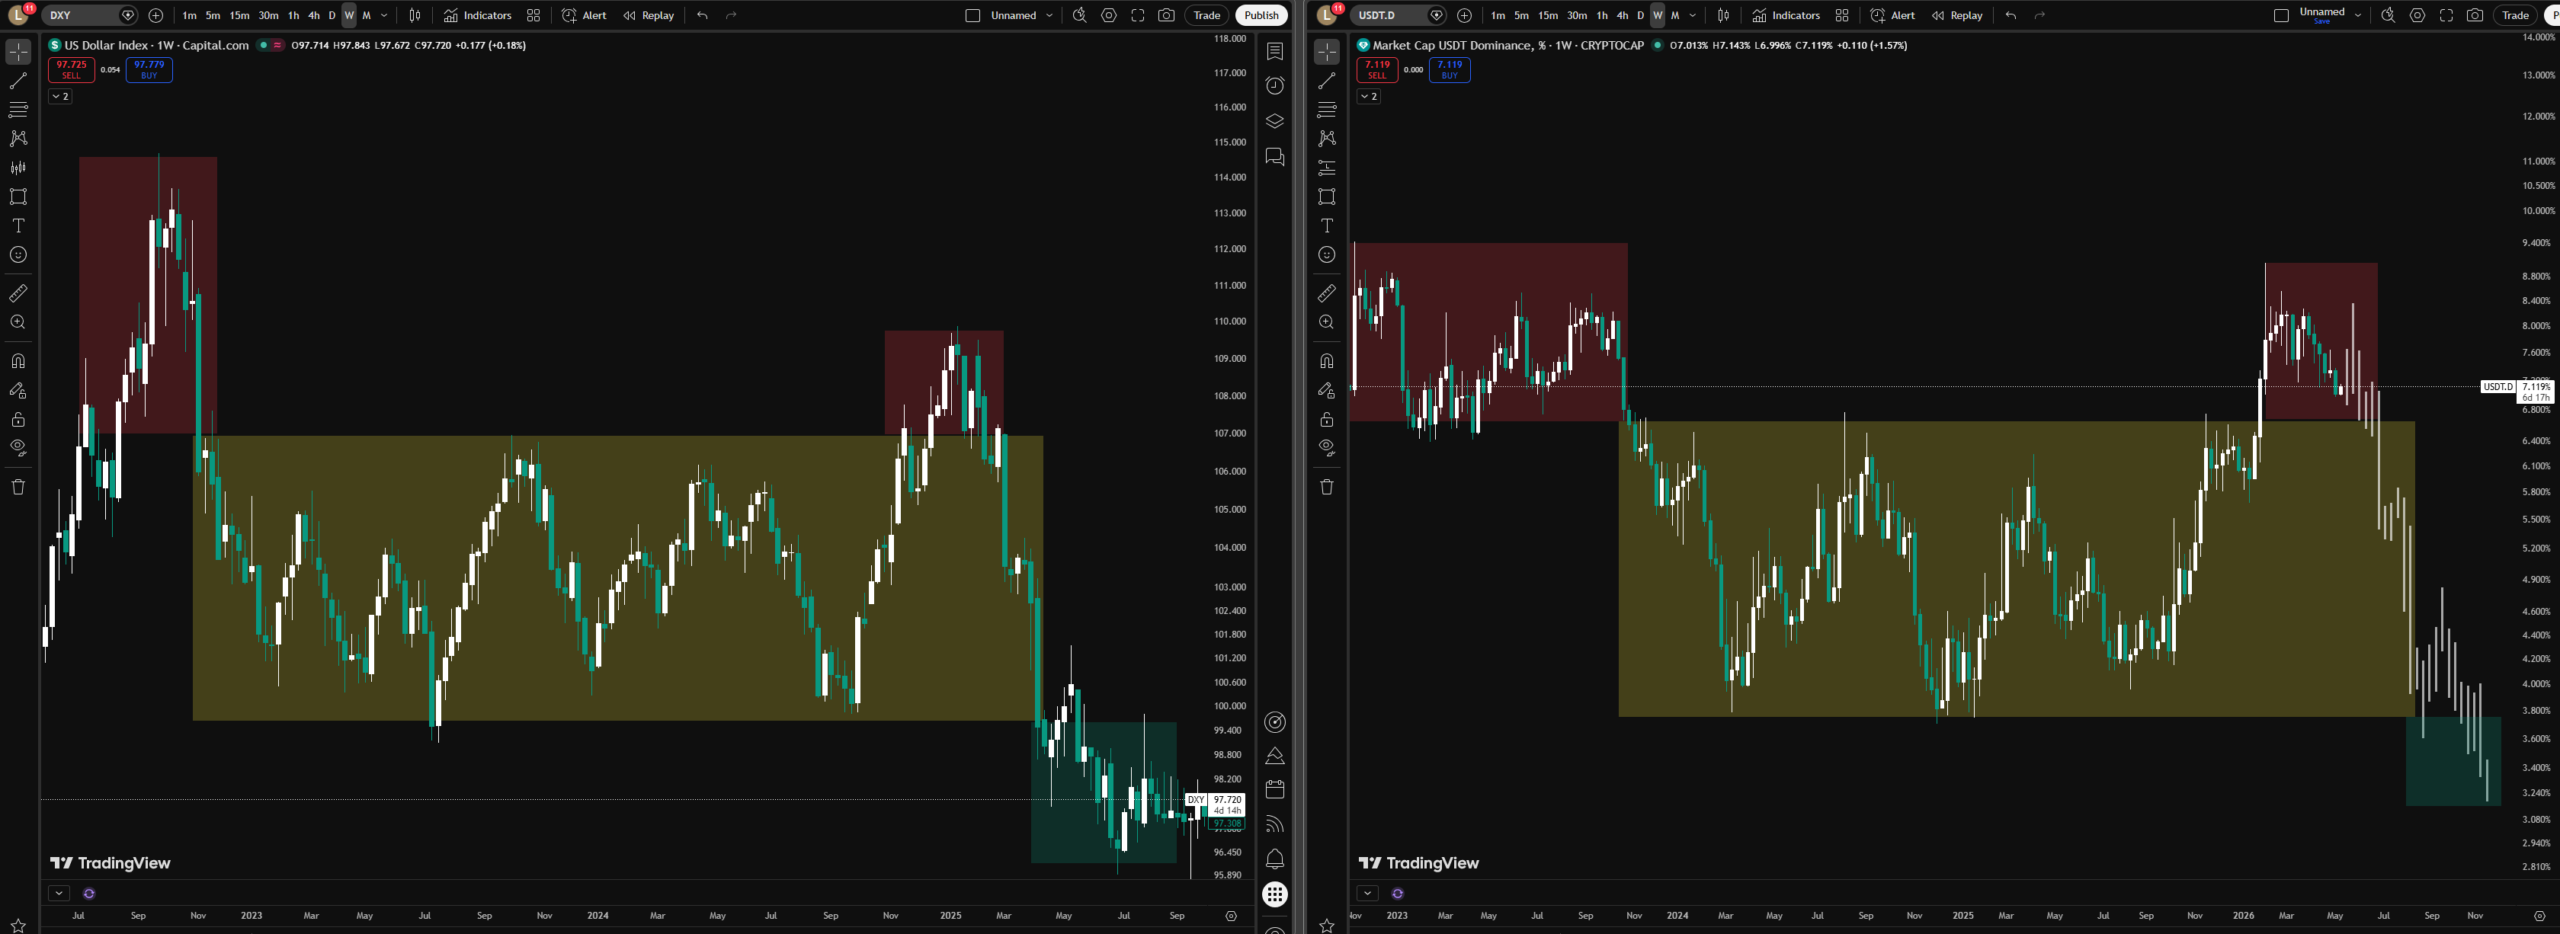
Both the DXY and USDT.D are exhibiting:
- Matching rectangular consolidation zones — defined ranges where price compressed before breaking directionally
- Similar fractal patterns — the sequence of price action within the consolidation mirrors each other across both assets
- Wick rejections at the same structural points — multiple failed attempts to reclaim the broken levels
- Momentum shifts — both indicators showing declining momentum following the consolidation breakdowns
The DXY’s breakdown from its consolidation range directly mirrors the USDT.D development. This correlation matters because a weaker US Dollar has historically created a more favourable environment for risk assets broadly — and for crypto specifically, a weakening DXY combined with falling stablecoin dominance creates a dual tailwind that has preceded some of the market’s most powerful rally periods.
If the DXY-USDT.D correlation continues — as it has through multiple prior cycles — the combined signal points toward further downside in stablecoin dominance and amplified capital inflows into digital assets.
The key level: The 6.50–6.76% zone on USDT.D is the critical support area to monitor. A sustained daily or weekly close below this zone — particularly alongside continued DXY weakness — would confirm that the rotation is accelerating rather than pausing.
Why This Sets Up Bitcoin, Ethereum, and Altcoins
The mechanics of the capital rotation are straightforward:
Stablecoin dominance falls → capital exits defensive USDT positions → that capital seeks deployment in risk assets → BTC absorbs the first wave as the highest liquidity destination → ETH follows as the second major liquid asset → altcoin rotation begins as the cycle matures
This sequence — visible in prior USDT.D breakdown cycles — is exactly what the current setup is suggesting may be approaching. As we covered in our Ethereum ETH/BTC fractal analysis, ETH/BTC is simultaneously testing one of the most important descending resistance trendlines in Ethereum’s history — a breakout of which would signal that the altcoin rotation has definitively begun.
Bitcoin itself is navigating the 200 SMA at $82,333 — the level we identified as the most critical technical decision point in the market. A USDT.D breakdown below the 6.50–6.76% zone would provide the macro tailwind needed to push BTC through that resistance decisively — potentially unlocking the $85,539–$98,000 target zone we identified in our ascending triangle and channel breakout analysis.
What’s Next — Two Scenarios
Bullish Scenario
USDT.D sustains a break below 6.50–6.76% on a weekly closing basis — confirming that capital rotation is accelerating. Simultaneously DXY continues to weaken below its consolidation range. The combined macro tailwind pushes BTC through the 200 SMA at $82,333 — unlocking the path toward $85,539 and beyond. ETH/BTC breaks its historic descending trendline — igniting altcoin season rotation across the broader market.
Bearish Scenario
USDT.D finds support at the 6.50–6.76% zone and bounces — signalling the diagonal break was a false move and stablecoin dominance is reasserting. DXY recovers its consolidation range. In this scenario macro conditions return to risk-off — adding pressure to BTC’s 200 SMA test and increasing the probability of the 2022 bearish fractal playing out rather than being invalidated.
Bottom Line
The most important charts for Bitcoin’s next major move right now are not Bitcoin’s own chart — they are USDT Dominance and DXY. Both are breaking down simultaneously from long-term structural levels in a fractal pattern that has historically preceded some of crypto’s strongest rally phases. The capital rotation mechanics are clear — and the 6.50–6.76% USDT.D zone is the line that will confirm whether the rotation is real or a false start.
Watch USDT.D. Watch DXY. Bitcoin’s next major move will follow.
What is USDT Dominance (USDT.D)?
USDT Dominance shows how much of the crypto market is held in Tether. A decline usually signals capital moving from stablecoins into assets like Bitcoin and Ethereum.
What does the current USDT.D breakdown mean?
USDT.D has broken below a major long-term support trendline, suggesting money may be rotating back into the broader crypto market.
What is the key USDT.D level to watch?
The 6.50%–6.76% zone is the major support area. A weekly close below it could confirm stronger bullish momentum for crypto.
The opinions and market insights shared on CoinsProbe represent the views of individual authors based on prevailing market conditions at the time of publication. Cryptocurrency investments carry significant risk and volatility. Readers are encouraged to conduct their own research and seek professional financial advice before making investment decisions. CoinsProbe and its contributors do not accept responsibility for financial losses or decisions made based on published content.
CoinsProbe may publish sponsored articles, affiliate links, or promotional collaborations. All sponsored material is clearly labeled to maintain transparency with our audience. Our editorial decisions remain fully independent, and advertising partnerships do not influence reviews, rankings, or published opinions.
Since 2023, CoinsProbe has delivered reliable insights on cryptocurrency, blockchain, and digital assets. Our content is created by experienced researchers and analysts who follow strict editorial standards focused on accuracy, transparency, and credibility. Every article is carefully reviewed and verified using trusted sources and current market data. We provide unbiased analysis and timely updates covering everything from emerging crypto projects to major industry developments.