
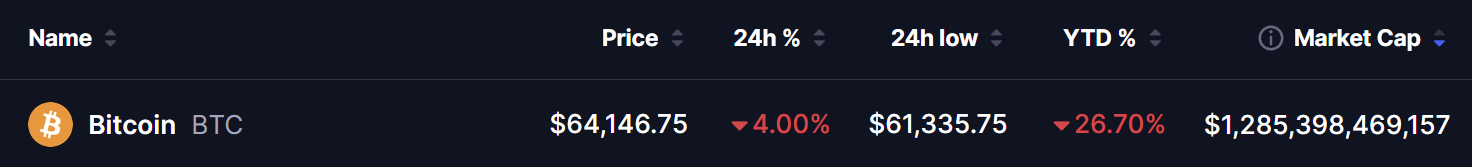
- Bitcoin is trading at $64,146 — down -4.00% in 24 hours — touching a session low of $61,335 — with year-to-date losses now at -26.70% and a market cap of approximately $1.285 trillion.
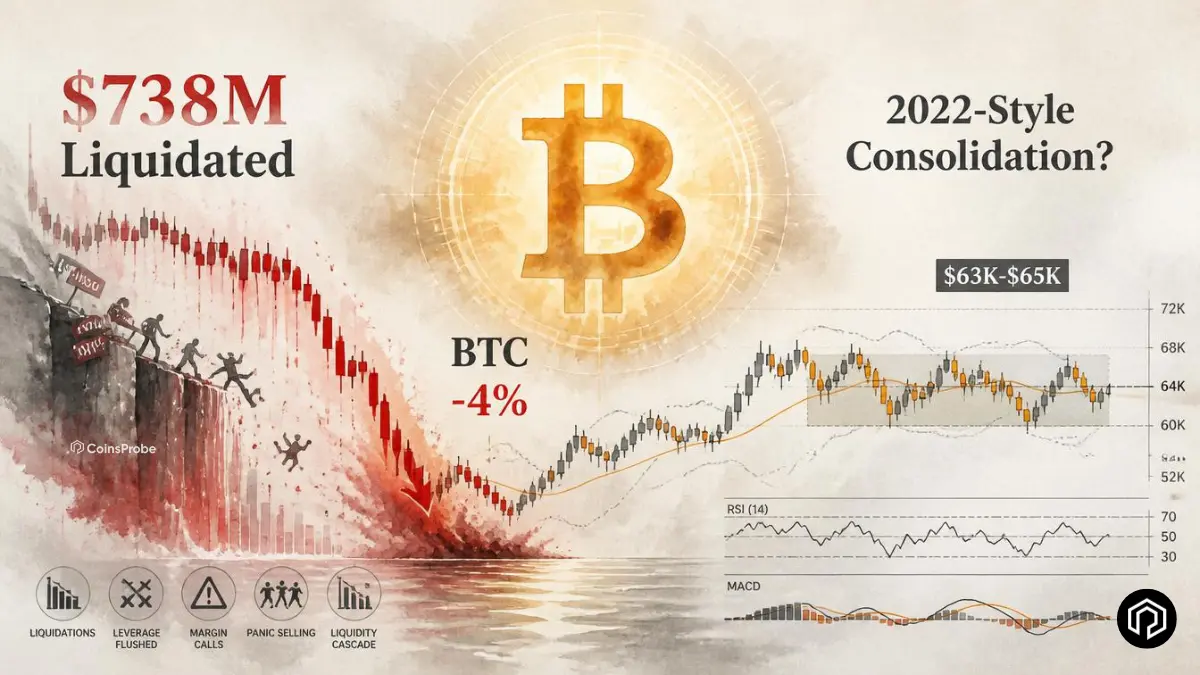
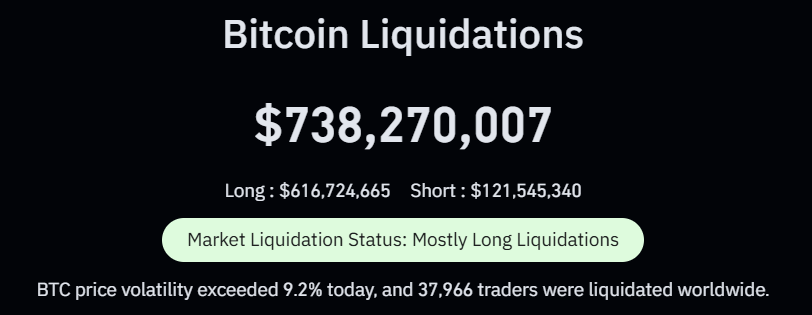
- $738.27 million in Bitcoin liquidations in 24 hours — with $616.72 million from long positions — as 37,966 traders were wiped out in a single session following a 9.2%+ intraday volatility event.
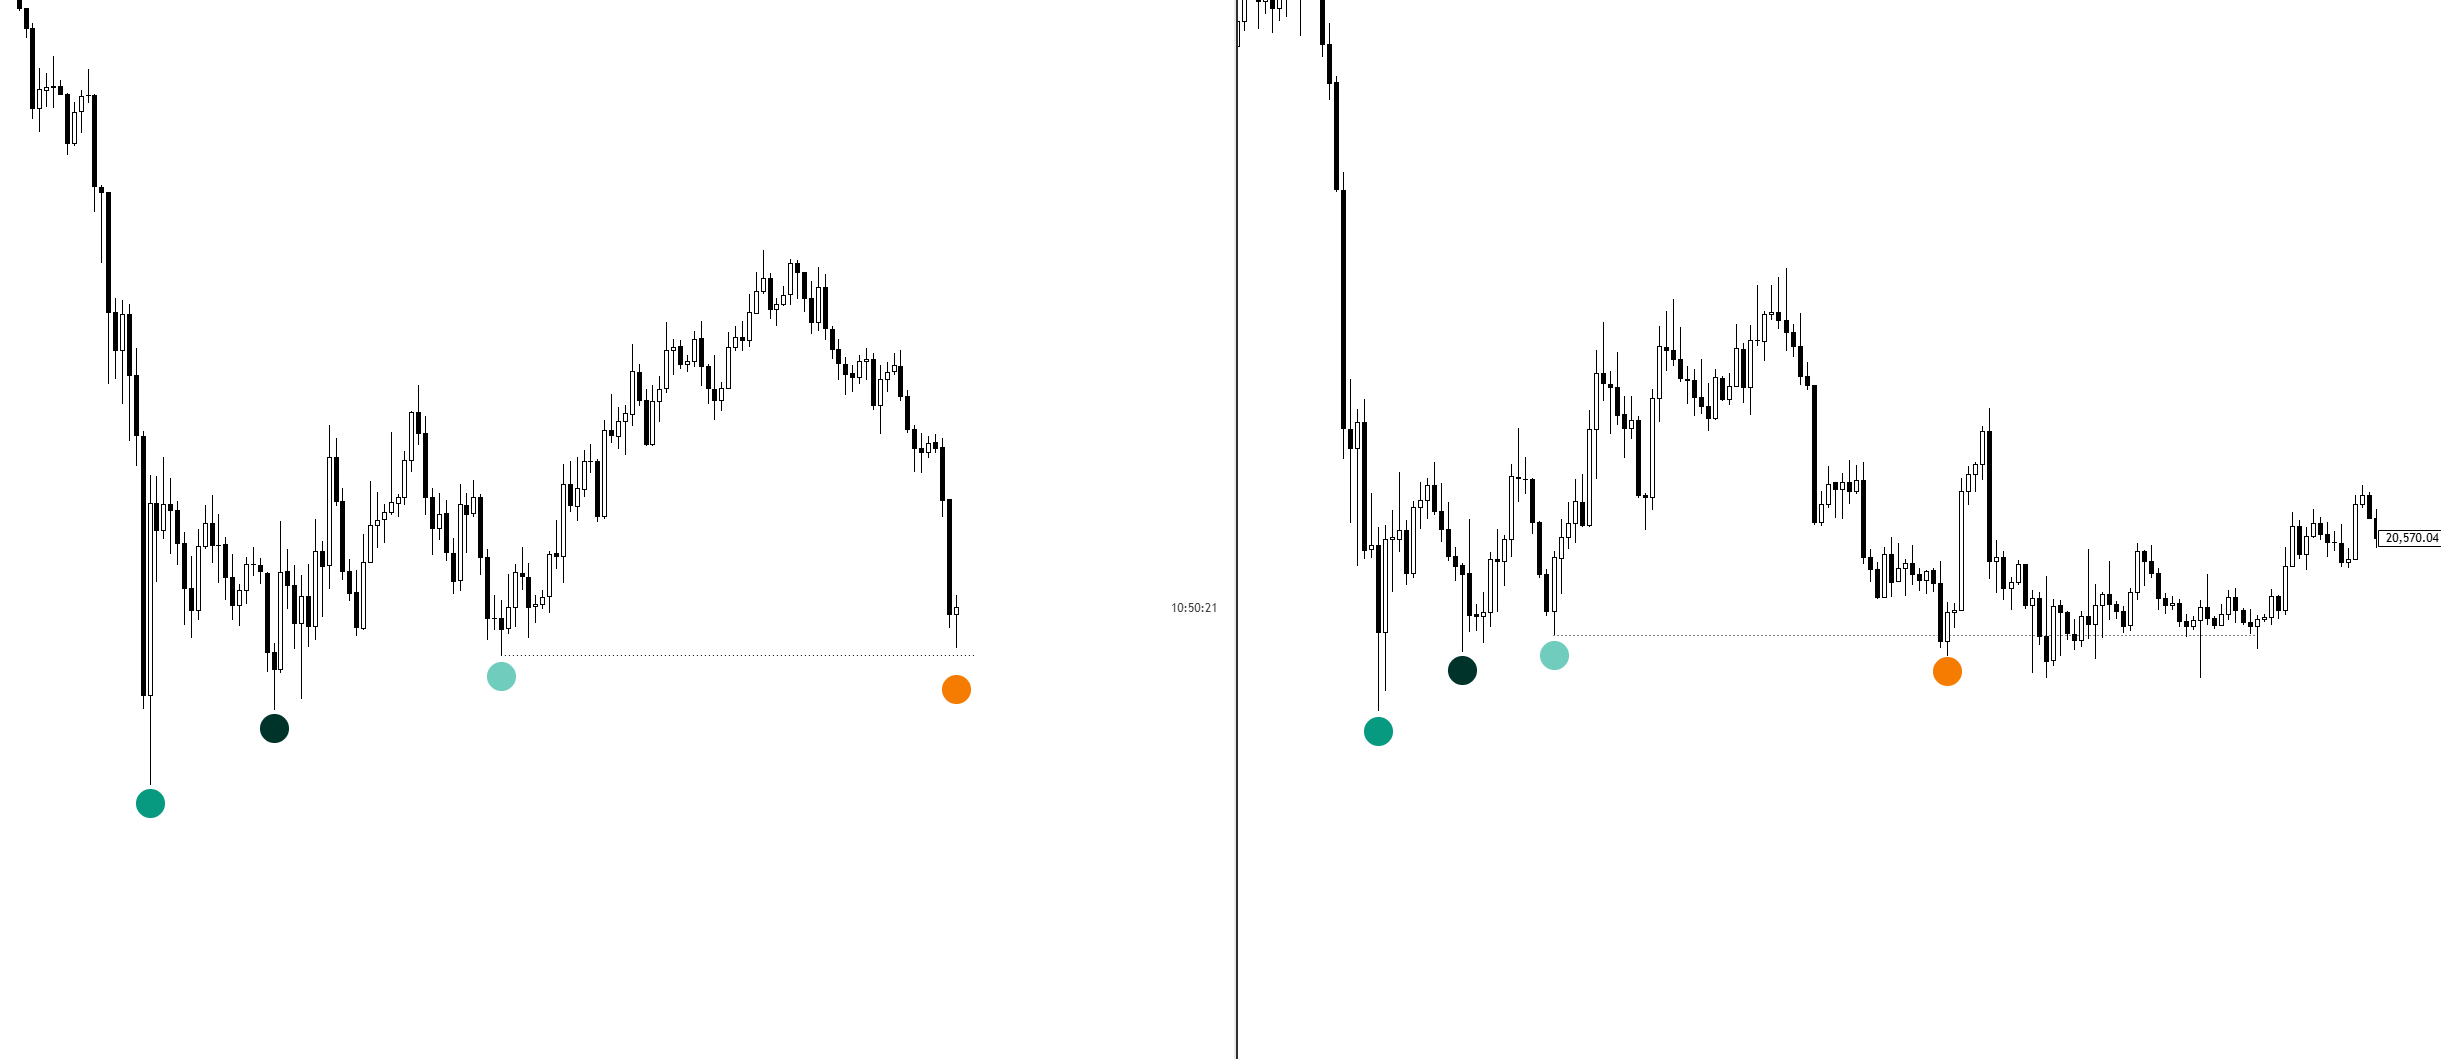
- Analyst @KillaXBT has identified a 2022 bottom formation parallel — suggesting the $63,000–$65,000 zone could trigger a multi-week bounce if the historical pattern holds.
- Bitcoin has repeatedly failed to reclaim the 200-day SMA at ~$82,000 throughout 2026 — the unreclaimed ceiling that continues to define the macro bearish structure.
Bitcoin is facing one of its most painful 24-hour sessions of 2026 — dropping to $64,146 with a session low of $61,335 amid a toxic combination of macro uncertainty, persistent inflation concerns, and technical failure at key resistance levels. The session has produced $738 million in liquidations, wiped out nearly 38,000 traders, and added to a broader crypto liquidation sequence that has seen over $1.78 billion cleared across all assets in recent sessions.
As we covered in our Bitcoin 200 SMA bearish fractal analysis and our Bitcoin ETF outflows article, the 200-day SMA at approximately $82,000 has been the decisive level separating the recovery thesis from the bearish fractal scenario — and the repeated failure to reclaim it has progressively weakened the technical structure heading into June.
Bitcoin at a Glance — June 3, 2026
The Liquidation Cascade — $738M in 24 Hours
The sharp price decline triggered a significant liquidation event — the latest in a sequence of cascades that have defined the 2026 crypto market downturn:
The 83.5% long-heavy composition of liquidations confirms the familiar pattern: leveraged bulls who had been positioned for a recovery toward the 200 SMA have been systematically cleared as price continues to find new lows. As we documented in our Bitcoin $72,879 crash analysis, these leveraged long flushes are characteristic of downtrending markets where each rally attempt creates new over-leveraged long positions that become fuel for the next leg lower.
The 37,966 traders liquidated in a single session reflects the scale of retail leverage that had accumulated during the brief recovery attempts from the $60,061 February low — all of which are now being systematically unwound.
What Is Driving the Decline
The 200 SMA ceiling — Bitcoin’s repeated failure to reclaim the 200-day SMA at approximately $82,000 has been the defining technical fact of 2026. As we detailed in our 200 SMA bearish fractal analysis, this mirrors 2022’s structure almost exactly — where multiple failed reclaim attempts preceded a sustained multi-month decline. Each failed attempt at $82,000 adds to the supply accumulation at that level and reduces the buying pressure available for the next attempt.
Macro headwinds — Persistent inflation concerns — as we covered in our Bitcoin USDT dominance and CPI analysis — continue to push Federal Reserve rate-cut expectations further into the future. The delayed rate cycle removes a key macro tailwind that crypto markets had been pricing in for recovery.
ETF outflow environment — As we documented in our Bitcoin ETF weekly outflows article, institutional demand through regulated ETF products has turned significantly negative — with weekly outflows hitting the third-highest on record. The institutional demand floor that supported prior recovery attempts has materially weakened.
The 2022 Bottom Formation — A Glimmer of Optimism
Against the bearish backdrop — quantitative trader @KillaXBT has identified a historical parallel that is generating significant community discussion:
“A little bit of optimism for you guys.. If $BTC follows the 2022 bottom formation. We bounce for weeks at the 63–65K region.”
The 2022 bottom formation comparison draws on the structural similarities between the current price action and the accumulation phase that preceded Bitcoin’s recovery from the $15,500–$16,000 cycle low in late 2022. In that prior instance, Bitcoin:
- Experienced a prolonged multi-month decline
- Found a support zone that held through multiple retest attempts
- Built a multi-week base in a defined price range
- Launched a significant recovery rally before the broader trend reversed
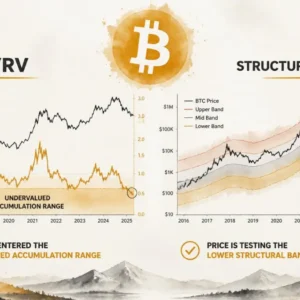
The $63,000–$65,000 zone that @KillaXBT identifies as the potential bounce region aligns with both the current session low of $61,335 and the MVRV support levels we identified in our Bitcoin MVRV analysis.
Community reaction has been divided:
The bullish interpretation: the aggressive long liquidation cascade — $616M in a single session — may have cleared sufficient weak hands to establish a near-term floor. Markets often find local bottoms when leveraged longs have been systematically removed and remaining sellers face less aggressive buying resistance.
The bearish warning: multiple community members note that if the $63K–$65K zone fails to hold, extreme downside scenarios target the $44,000–$48,000 range — levels that would represent a full confirmation of the 2022 structural parallel playing out to its historical conclusion.
What’s Next — Two Scenarios
Bullish Scenario — 2022 Formation Holds
The $63,000–$65,000 support zone absorbs the remaining selling pressure — leveraged long liquidations have cleared sufficient weak hands to establish a local floor. Price stabilises in this range over the coming days — building the multi-week base that @KillaXBT’s 2022 comparison suggests is possible.
A confirmed hold above $63K — particularly if accompanied by any positive macro development — could trigger a relief rally toward $70,000–$75,000 as the first significant resistance above the current range.
Bearish Scenario — Support Fails
The $63K–$65K zone fails to contain selling pressure — price breaks below the $61,335 session low and continuation toward $44,000–$48,000 becomes the next structural target. This scenario would confirm the 2022 bearish fractal we have been tracking throughout 2026 is playing out to its full historical conclusion.
Bottom Line
Bitcoin’s drop to $64,146 with $738M in liquidations adds to one of the most difficult macro environments for the asset in the current cycle. The 200 SMA at $82,000 remains unreclaimed. ETF outflows have been severe. And the leveraged long positioning that accumulated during recovery attempts continues to be systematically cleared.
The 2022 bottom formation parallel identified by @KillaXBT offers the most concrete near-term optimism — suggesting the $63K–$65K zone could provide the multi-week bounce that would give bulls time to rebuild. Whether it plays out depends on whether the aggressive long flush of the past 24 hours has cleared enough selling pressure to allow genuine accumulation at this level.
Watch $61,335 as the immediate floor. Watch $63,000–$65,000 as the bounce zone. And watch $82,000 — because until that level is reclaimed, the macro structure remains bearish regardless of short-term bounces.
Frequently Asked Questions
Why is Bitcoin falling so sharply in June 2026?
Bitcoin is under pressure from three converging forces — the unreclaimed 200-day SMA at $82,000 acting as a resistance ceiling, persistent macro headwinds from elevated inflation delaying Fed rate cuts, and institutional ETF outflows that have materially weakened the demand floor.
What is the 2022 bottom formation parallel?
Analyst @KillaXBT identified that Bitcoin’s current price action resembles the 2022 accumulation phase that preceded a multi-week recovery. The $63,000–$65,000 zone is identified as the potential multi-week bounce region if the historical pattern holds.
The opinions and market insights shared on CoinsProbe represent the views of individual authors based on prevailing market conditions at the time of publication. Cryptocurrency investments carry significant risk and volatility. Readers are encouraged to conduct their own research and seek professional financial advice before making investment decisions. CoinsProbe and its contributors do not accept responsibility for financial losses or decisions made based on published content.
CoinsProbe may publish sponsored articles, affiliate links, or promotional collaborations. All sponsored material is clearly labeled to maintain transparency with our audience. Our editorial decisions remain fully independent, and advertising partnerships do not influence reviews, rankings, or published opinions.
Since 2023, CoinsProbe has delivered reliable insights on cryptocurrency, blockchain, and digital assets. Our content is created by experienced researchers and analysts who follow strict editorial standards focused on accuracy, transparency, and credibility. Every article is carefully reviewed and verified using trusted sources and current market data. We provide unbiased analysis and timely updates covering everything from emerging crypto projects to major industry developments.