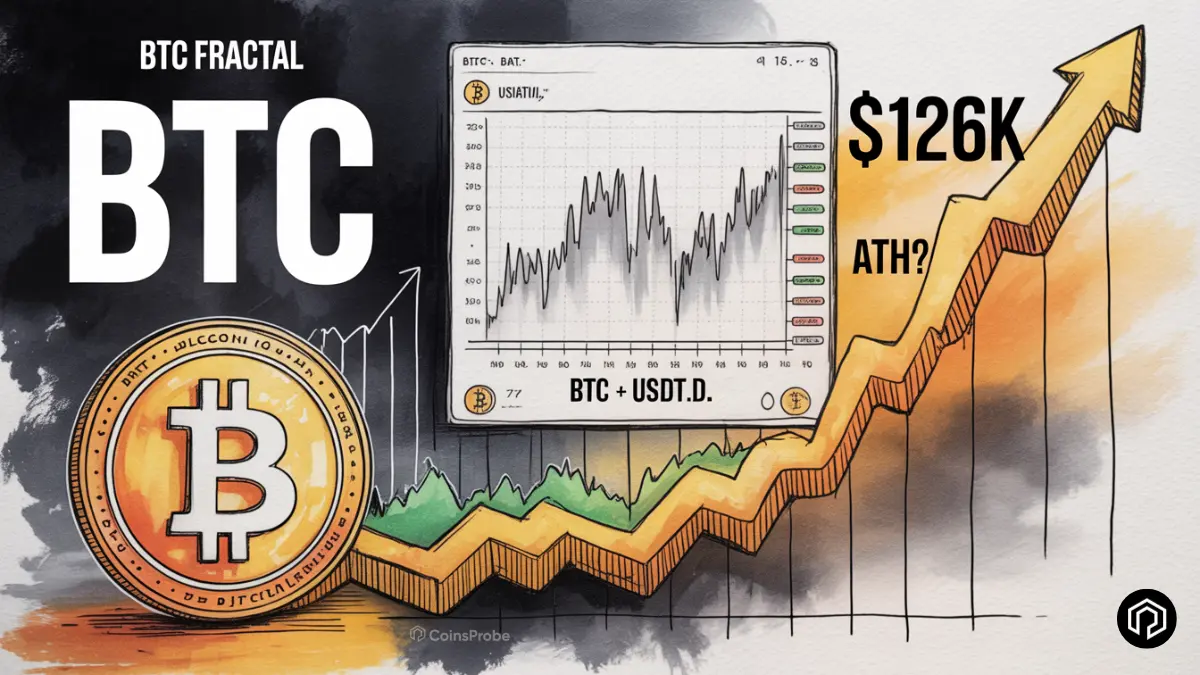

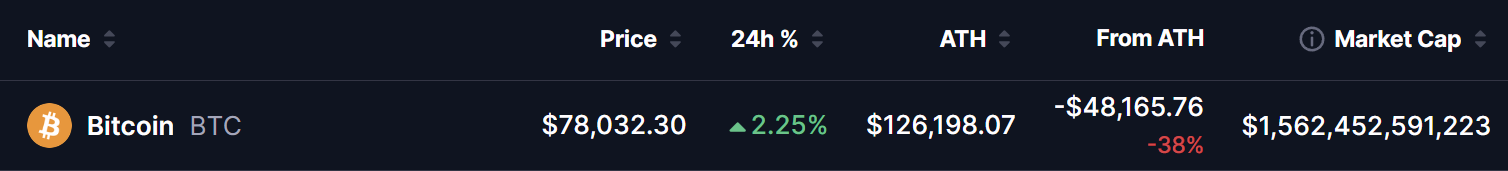
- Bitcoin (BTC) is currently trading near $78,032 — down 38% from its all-time high of $126,198 reached in mid-October 2025.
- After bouncing from a $60K low in February 2026, BTC is showing resilience in the $73K–$79K range with an emerging fractal pattern hinting at a potential bullish rebound.
- A fractal analysis by @i_am_jackis shows USDT Dominance (USDT.D) is following a pattern strikingly similar to Bitcoin's 2019 correction structure.
- A breakdown in USDT.D below the 7.0% horizontal support would confirm the fractal — potentially triggering a BTC rally back toward the $126K ATH.
- Bearish invalidation: a weekly close above 8.27% USDT.D resistance would invalidate the bullish setup entirely.
Bitcoin has had a rough ride since its historic peak. After reaching an all-time high of $126,198 in mid-October 2025, BTC has endured a sharp and sustained downtrend — shedding 38% of its value and pulling back to a February 2026 low near $60,000 before stabilising. As of today, BTC is trading at $78,032 with a $1.56 trillion market cap — holding ground but still sitting uncomfortably far from its peak.
The question on every Bitcoin trader’s mind is the same: is this correction over — or is there more pain ahead before the next leg up? A compelling new fractal analysis is now offering one of the cleaner frameworks for answering that question — and the key indicator is not Bitcoin itself. It is USDT Dominance.
The BTC and USDT.D Fractal — What the Chart Is Saying
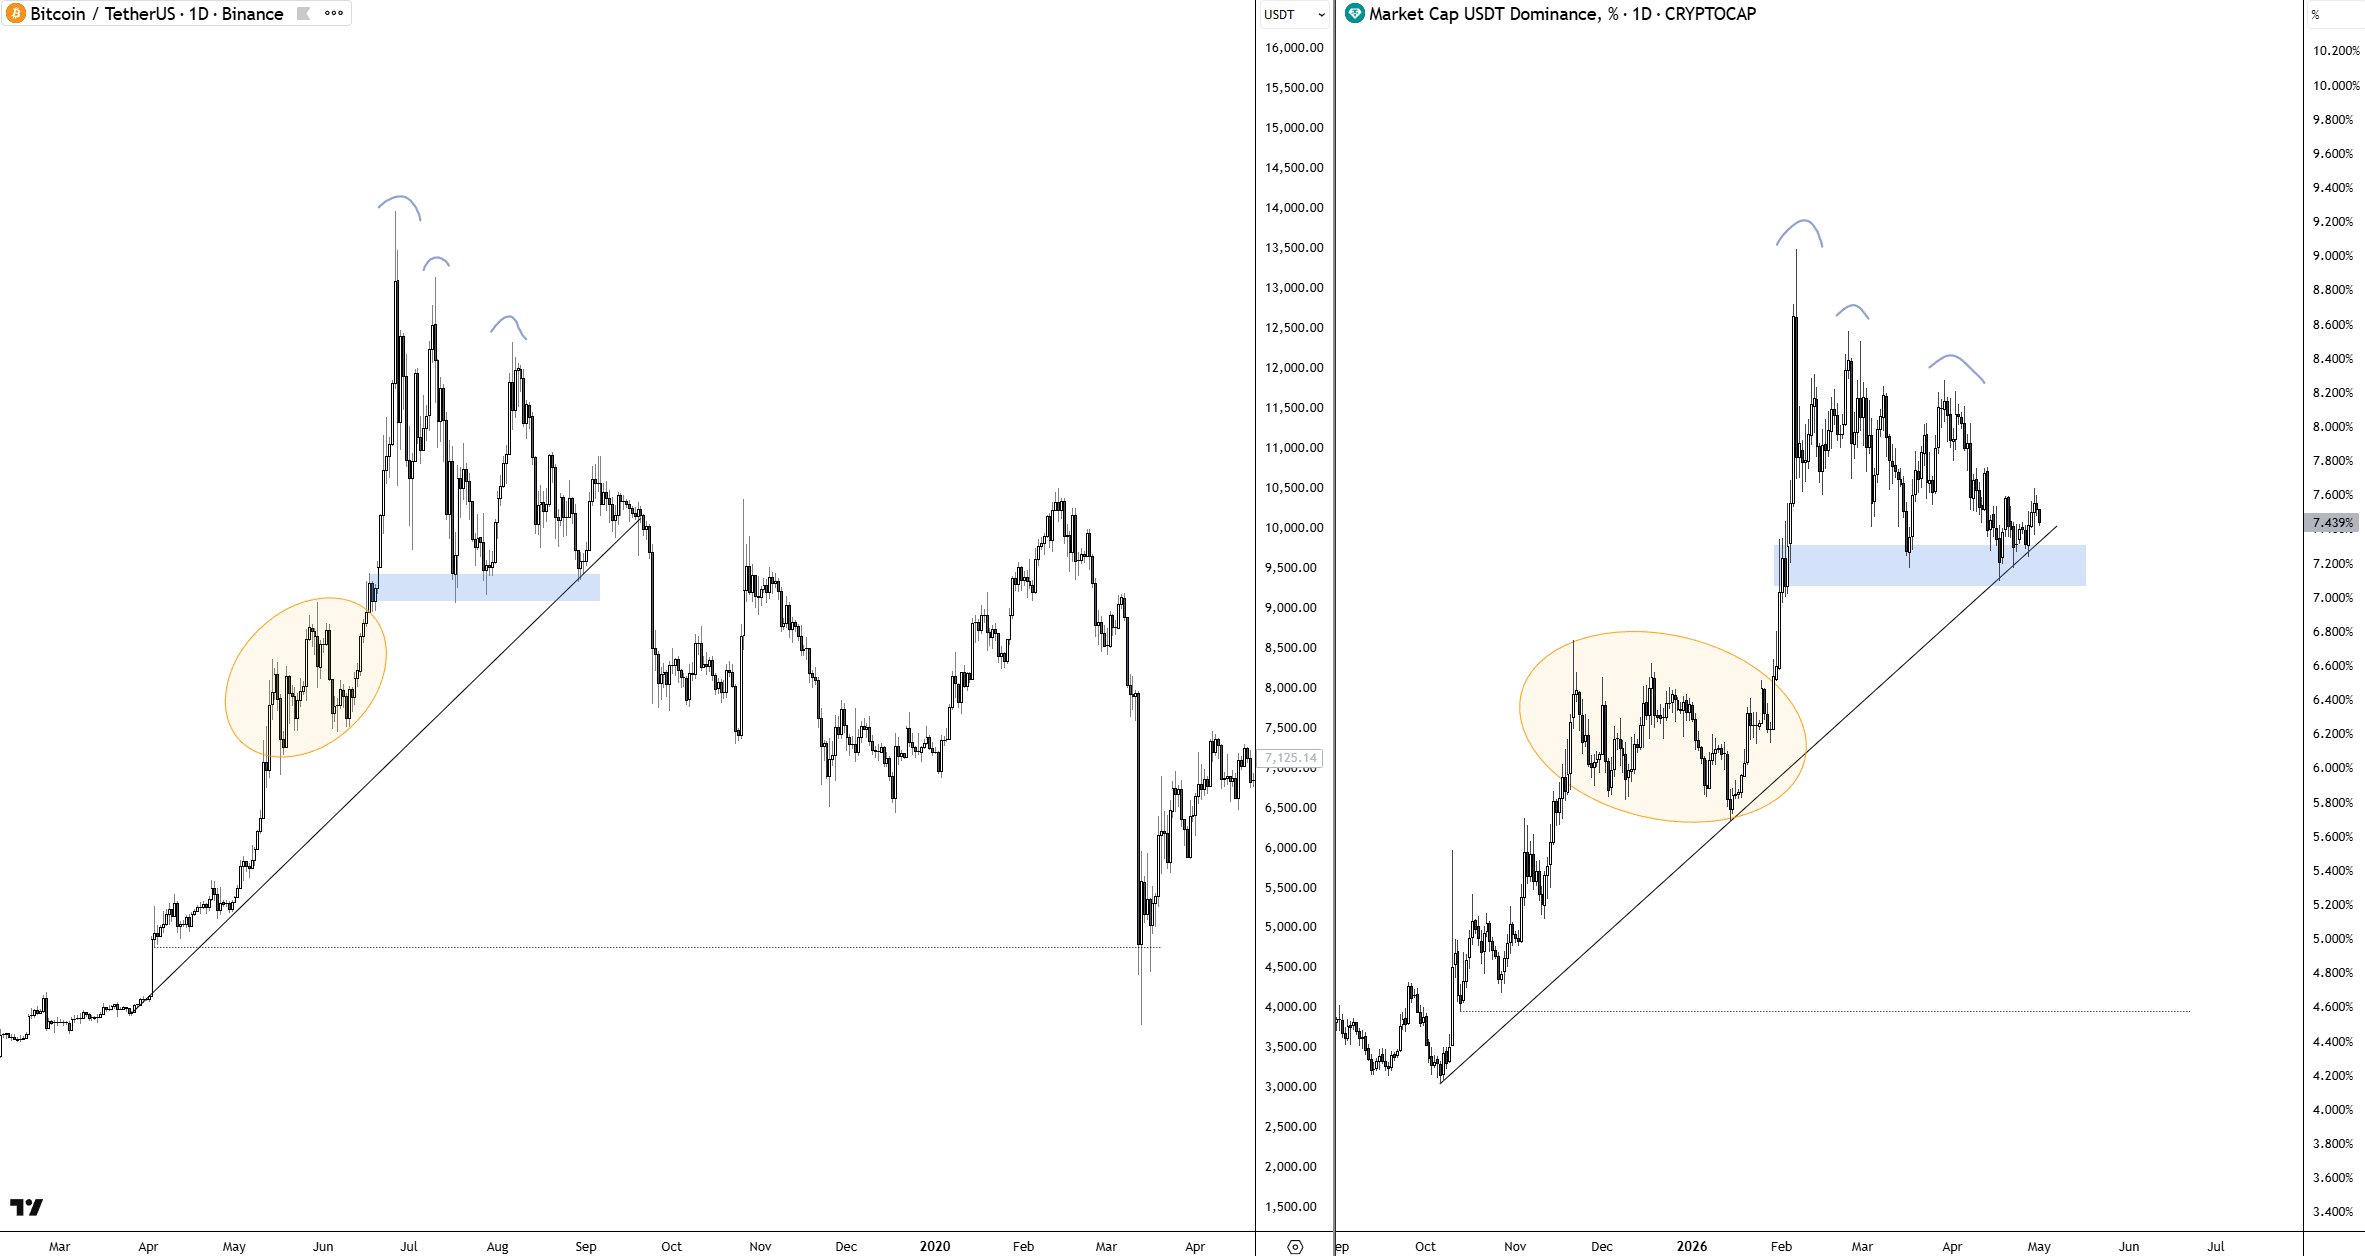
The latest analysis shared by crypto analyst @i_am_jackis draws a striking structural parallel between two charts separated by years but telling the same story: Bitcoin’s 2019 correction and USDT Dominance’s current structure in 2025–2026.
The logic of the fractal works as follows — when investors are fearful and rotating out of crypto, capital flows into stablecoins like USDT, pushing USDT Dominance higher. Conversely, when confidence returns and capital rotates back into risk assets, USDT Dominance falls — and Bitcoin tends to rally. The fractal suggests that USDT.D is now approaching the same structural breakdown point that preceded Bitcoin’s major recovery in late 2019 and early 2020.
The 2019 Bitcoin Setup — The Template
To understand what the fractal is pointing to, it helps to revisit what happened to Bitcoin in 2019.
After BTC reached a local peak near $14,000 in mid-2019, it entered a significant correction — breaking below an ascending resistance trendline and sliding all the way down to approximately $4,000 by early 2020. The correction was brutal and sustained — wiping out a large portion of the prior rally’s gains and shaking out overleveraged long positions across the market.
But critically — as BTC was correcting, USDT Dominance was rising, reflecting the fear-driven rotation into stablecoins. Once USDT.D peaked and began its own breakdown below key support, BTC found its floor and began its historic recovery — eventually leading into the 2020–2021 bull run.
The highlighted orange circles on the fractal chart mark the key accumulation zones in each cycle — the messy, volatile consolidation period where smart money accumulates before the next directional move.
The 2025–2026 USDT.D Structure — The Fractal in Play
Now look at the right side of the chart — USDT.D’s structure since Bitcoin’s $126K ATH in October 2025.
Since BTC peaked at $126K, USDT Dominance surged from approximately 4.10% all the way to 9.0% — a massive rotation into stablecoins that directly corresponded with the sharp BTC correction from $126K to $60K. This is the fear trade in action — exactly the same dynamic seen in 2019, just at a different scale.
The current USDT.D structure now shows:
- A rising ascending trendline from the 2024 lows — mirroring BTC’s 2019 ascending trendline before its breakdown
- A horizontal support zone near 7.0–7.2% — highlighted in blue on the chart — which has been tested multiple times and is now the critical breakdown level to watch
- USDT.D currently sitting at approximately 7.44% — right at the edge of the key support zone
The structural similarity between the two charts is difficult to dismiss. If USDT.D follows the 2019 BTC template and breaks down through current support levels, the fractal points to a rotation back into risk assets — with Bitcoin the primary beneficiary.
What’s Next — Two Scenarios
Bullish Scenario — USDT.D Breaks Down
If USDT.D continues to follow the fractal and breaks decisively below the ascending trendline resistance it has been riding since 2024, the next key confirmation level to watch is a close below the 7.0% horizontal support zone. A sustained daily or weekly close below 7.0% would confirm the fractal breakdown is underway — signalling that capital is rotating out of stablecoins and back into risk assets.
In this scenario, the fractal points to USDT.D declining toward its prior range near 4.0–4.10% — the level it held before the BTC ATH cycle began. That kind of move in USDT.D would represent an enormous influx of capital back into the crypto market — and based on historical precedent and the fractal’s template, Bitcoin would be the primary destination for that rotating capital, potentially driving a recovery rally toward and possibly beyond the $126K all-time high.
Bearish Scenario — USDT.D Holds and Climbs
If the fractal fails to play out and USDT.D finds support at current levels rather than breaking down, the bearish invalidation level is a daily or weekly close above 8.27% USDT.D resistance. A move back above this level would signal that fear and risk-off sentiment are returning — putting renewed downside pressure on BTC and invalidating the bullish fractal thesis. In this scenario Bitcoin’s $73–$79K support range would face another serious test.
Why USDT Dominance Matters for Bitcoin
For traders unfamiliar with using USDT Dominance as a Bitcoin indicator, the relationship is straightforward. USDT.D measures what percentage of the total crypto market cap is sitting in USDT — essentially measuring how much of the market is parked in safety rather than deployed in risk assets.
When USDT.D rises — as it did from 4.10% to 9.0% following Bitcoin’s $126K peak — it means investors are pulling capital out of crypto assets and parking it in stablecoins. This is the fear trade. When USDT.D falls — as the fractal suggests may be approaching — it means that parked capital is coming back off the sidelines and flowing back into risk assets like Bitcoin.
The fractal @i_am_jackis has identified suggests that USDT.D may now be at the same structural point it was in 2019 BTC’s chart — right before the breakdown that preceded the next major bull run. Whether it plays out exactly the same way remains to be seen — but the structural similarity is one of the cleaner setups in the current market.
Bottom Line
Bitcoin is sitting 38% below its all-time high — but the USDT Dominance fractal is building a case that the worst of the correction may be nearing its end. A breakdown in USDT.D below the 7.0% support zone would be the clearest on-chain signal yet that capital is rotating back into risk — and if the 2019 fractal holds, Bitcoin’s $126K ATH would move from a memory back into a target.
Frequently Asked Questions (FAQ)
What is the BTC and USDT.D fractal showing?
The fractal shows that USDT Dominance’s current structure — rising from 4.10% to 9.0% following Bitcoin’s $126K ATH — closely mirrors Bitcoin’s own 2019 correction structure. If USDT.D follows the same path and breaks down, it could signal a major capital rotation back into Bitcoin.
What is the key USDT.D level to watch?
The critical level is the 7.0–7.2% horizontal support zone. A sustained close below this level would confirm the fractal breakdown is underway and signal that capital is rotating out of stablecoins back into risk assets like Bitcoin.
What is Bitcoin’s fractal target if USDT.D breaks down?
Based on the fractal, USDT.D declining to its prior range near 4.0–4.10% would correspond with Bitcoin recovering toward its $126,198 all-time high — representing a potential +61% move from current levels.
What invalidates the bullish Bitcoin fractal?
A daily or weekly close in USDT.D above 8.27% resistance would invalidate the setup — signalling that fear and risk-off sentiment are returning and putting renewed downside pressure on BTC.
Why does USDT Dominance matter for Bitcoin?
USDT.D measures what percentage of the total crypto market cap is parked in USDT. When it rises, capital is leaving risk assets. When it falls, that capital rotates back — historically benefiting Bitcoin first and most significantly.
The opinions and market insights shared on CoinsProbe represent the views of individual authors based on prevailing market conditions at the time of publication. Cryptocurrency investments carry significant risk and volatility. Readers are encouraged to conduct their own research and seek professional financial advice before making investment decisions. CoinsProbe and its contributors do not accept responsibility for financial losses or decisions made based on published content.
CoinsProbe may publish sponsored articles, affiliate links, or promotional collaborations. All sponsored material is clearly labeled to maintain transparency with our audience. Our editorial decisions remain fully independent, and advertising partnerships do not influence reviews, rankings, or published opinions.
Since 2023, CoinsProbe has delivered reliable insights on cryptocurrency, blockchain, and digital assets. Our content is created by experienced researchers and analysts who follow strict editorial standards focused on accuracy, transparency, and credibility. Every article is carefully reviewed and verified using trusted sources and current market data. We provide unbiased analysis and timely updates covering everything from emerging crypto projects to major industry developments.