
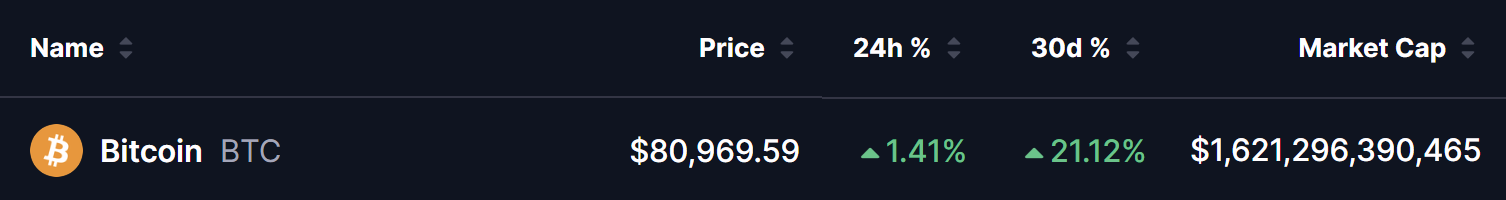
- Bitcoin is trading at $80,969 — up +1.41% in 24 hours and a strong +21.12% over 30 days — with a market cap of $1.62 trillion.
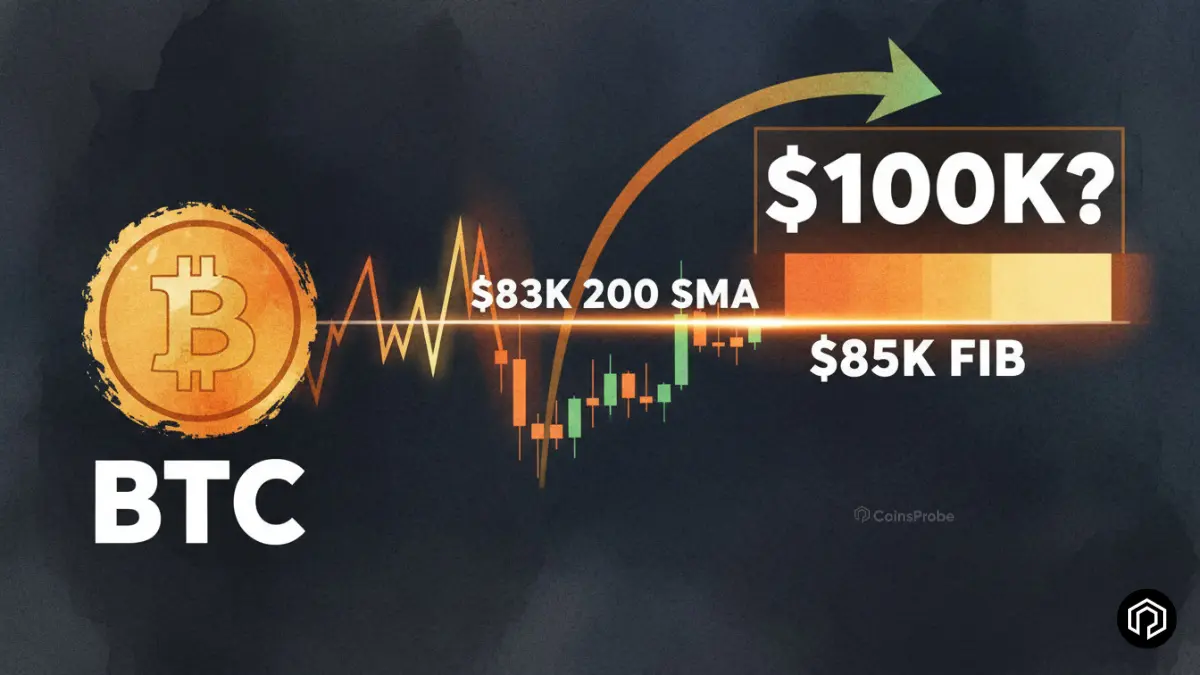
- Two critical resistance levels are directly ahead: the 200-day SMA at $83,000 and the 0.618 Fibonacci retracement at $85,000 — the barriers that will define Bitcoin's next major directional move.
- Analyst warns that a break above $85,000 would invalidate all bearish swing setups — noting it would be "something we rarely see in a strong downtrend."
- Analyst highlights a weekly MACD crossover on April 13 that has historically triggered rallies of +146%, +75%, and +35% in prior cycles — pointing to targets of $89,000, $94,000, and potentially $100,000.
Bitcoin is approaching one of the most consequential technical decision points of its entire 2026 recovery. After decisively reclaiming $80,000 — as we detailed in our Bitcoin $80K reclaim and historic trendline analysis — BTC is now trading at $80,969 and pressing directly toward two major resistance barriers that analysts say will determine whether the current rally is the start of a sustained new uptrend or a high-level bull trap in an ongoing consolidation phase.
The two levels in focus: the 200-day Simple Moving Average at $83,000 and the 0.618 Fibonacci retracement at $85,000. Break both cleanly and the path to $89,000–$100,000 opens. Fail at either — and a retest of the $78,000–$80,000 range becomes the more likely near-term outcome.
Two prominent analysts have weighed in with detailed frameworks for exactly how these levels should be traded — and their analysis tells a compelling and consistent story.
The $85K Fibonacci Threshold
Prominent quantitative trader @KillaXBT highlighted the critical significance of the $85,000 level in a post on May 4, 2026 — reacting to Kalshi Crypto’s forecast that traders are pricing a Bitcoin move to $85K this month:
“Well, that is interesting. If $BTC reaches 85K, it would break above the 0.618. Something we rarely see in a strong downtrend. We’re at a critical point in terms of trend and a move above 85K would stop my swing short out. I wouldn’t look to short again until there’s a clear shift back.”
The statement carries significant weight for several reasons. @KillaXBT is a quantitative trader — not a permabull. The fact that he is explicitly flagging $85,000 as the level that would force him to close his swing short and step away from the bear side entirely is a meaningful signal about where professional traders are positioned and what would force a repositioning.
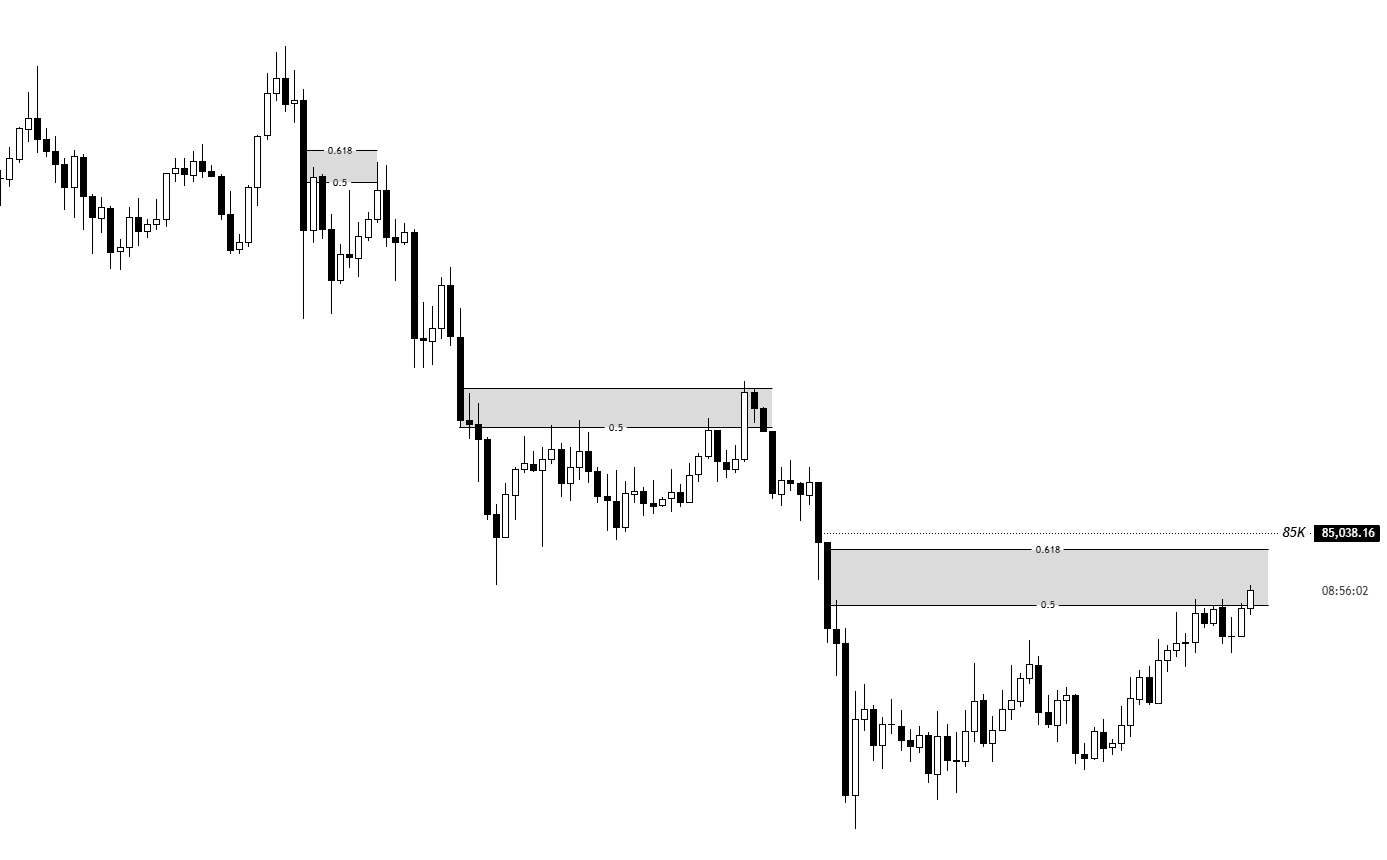
The 0.618 Fibonacci retracement — the golden ratio level — is one of the most watched technical levels in any asset’s recovery from a major decline. In strong downtrends, price typically fails at or below this level — which is exactly why @KillaXBT describes a break above it as something “we rarely see.” A clean daily close above $85,000 would not just be a technical breakout — it would force a mass repositioning among traders who have been positioned short on the assumption that the downtrend remains intact.
The resulting short squeeze could be one of the most powerful accelerants for a rapid move toward $89,000 and beyond.
Weekly MACD Crossover Points to $100K
On May 5, 2026, analyst @alicharts added a second and equally compelling layer to the Bitcoin analysis — this time focusing on the weekly timeframe and a signal that has been quietly building since mid-April:
“Is Bitcoin heading to $100,000? $BTC continues to show structural strength. Following a bullish MACD crossover on the weekly chart on April 13, we have already seen a steady 15% price increase. Historically, this specific weekly crossover has been a premier signal for defining multi-month trends… On the daily chart, Bitcoin is approaching the 200SMA at $83,000, which is the most significant psychological and structural barrier. A clean daily close above this hurdle could clear the path for a macro expansion toward $89,000, with a secondary target at $94,000.”
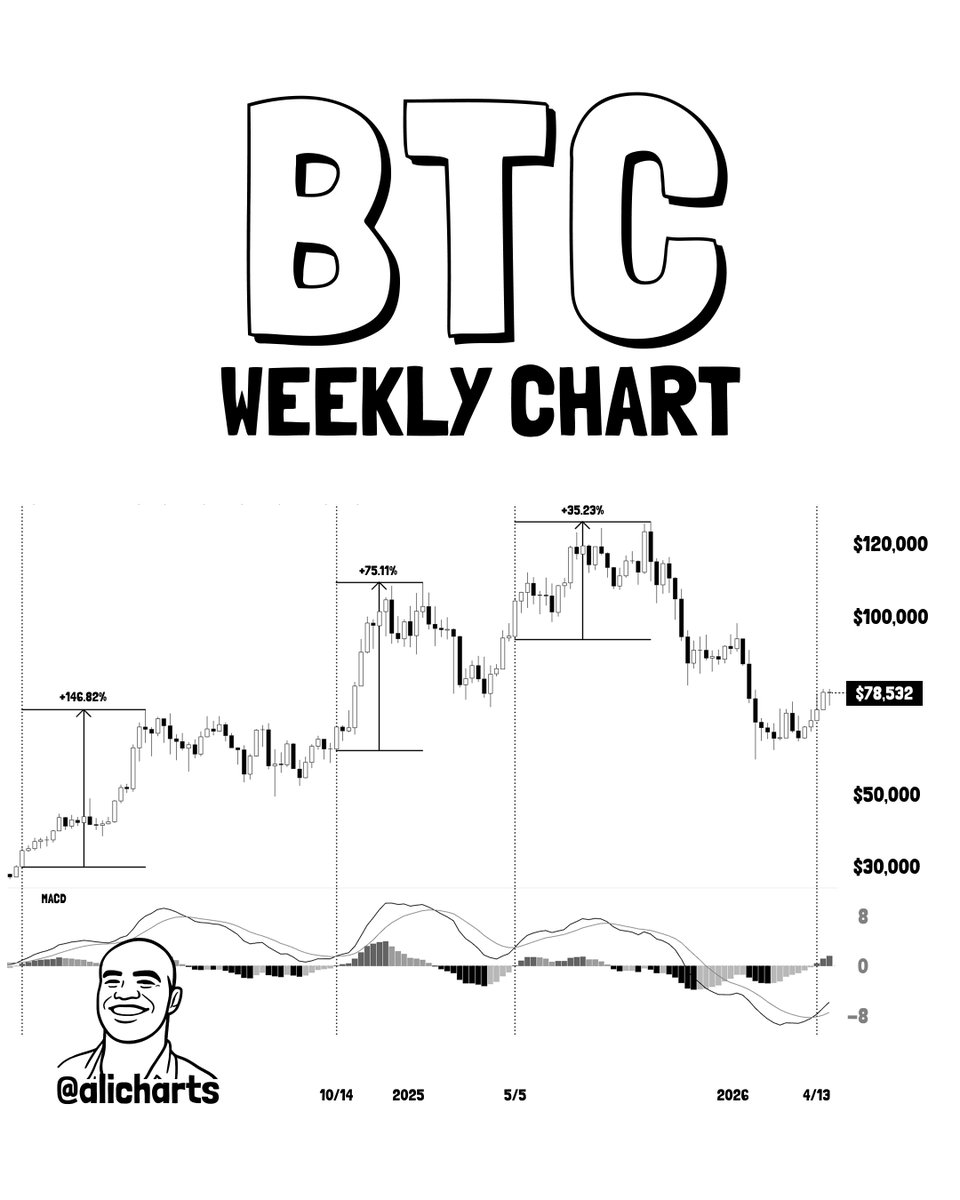
The weekly MACD crossover that occurred on April 13, 2026 is the signal at the centre of this analysis — and its historical track record is difficult to dismiss. @alicharts’ chart shows that this specific weekly MACD crossover has preceded three of Bitcoin’s most powerful multi-month trends in recent history:
| Signal | Subsequent Rally |
|---|---|
| Prior Cycle 1 | +146.82% |
| Prior Cycle 2 | +75.11% |
| Prior Cycle 3 | +35.23% |
Since the April 13 crossover, Bitcoin has already posted a +15% gain — entirely consistent with the early-stage progression seen in each prior instance. If the historical pattern holds and the weekly MACD crossover is confirmed as a genuine multi-month trend signal, the targets @alicharts identifies — $89,000 as the primary macro expansion target and $94,000 as the secondary level — become credible near-term destinations rather than speculative projections.
And $100,000 — once those levels clear — moves from a round-number fantasy back into a realistic conversation.
The Two Barriers — What a Break Means and What a Rejection Means
The confluence of the 200-day SMA at $83,000 and the 0.618 Fibonacci retracement at $85,000 creates a defined two-level resistance gauntlet that Bitcoin must navigate in the coming days. Here is what each scenario means:
Bullish Scenario — Break and Hold Above Both Levels
A clean daily close above $83,000 would be the first confirmation — clearing the 200-day SMA, which is the most watched structural indicator for determining whether an asset is in a macro uptrend or downtrend. Most institutional trading models treat a sustained hold above the 200 SMA as a trend-positive signal.
From there, a push through $85,000 would trigger the short squeeze @KillaXBT described — forcing traders positioned short on the 0.618 Fibonacci level to cover, adding fuel to the upside momentum. With that pressure released and both major barriers cleared, the path to $89,000 opens as the primary target — followed by $94,000 as the secondary objective and $100,000 as the macro expansion target if the weekly MACD crossover fully plays out.
As we noted in our USDT Dominance fractal analysis, a continued decline in USDT.D from its 9.0% peak would serve as the macro tailwind that accelerates this scenario — with capital rotating out of stablecoins and into risk assets providing the sustained buying pressure needed to clear both resistance levels decisively.
Bearish Scenario — Rejection at $83K or $85K
If Bitcoin fails to close cleanly above the 200-day SMA at $83,000 — or briefly breaks $85,000 and then reverses — the immediate risk is a retest of the $78,000–$80,000 support zone established following the channel breakout. A deeper failure could bring the $74,000–$76,000 defensive liquidity zone back into focus.
In this scenario the bull trap thesis — where the current rally is a high-level bounce within an ongoing downtrend rather than a genuine reversal — gains credibility. @KillaXBT’s framing is useful here: as long as BTC is below $85,000, his swing short remains active. That positioning represents a significant body of professional trader sentiment that is not yet convinced the downtrend is over.
Bottom Line
Bitcoin is at its most consequential technical juncture since the $126K all-time high. The 200-day SMA at $83,000 and the 0.618 Fibonacci at $85,000 are the two barriers standing between the current $81,000 level and a potential run toward $89,000–$100,000. The weekly MACD crossover signal — with a historical track record of triggering rallies between 35% and 146% — is already 15% into its progression. The short positioning that would be forced to cover above $85,000 represents significant latent buying pressure.
The next few daily candles will be decisive. A clean close above $83,000 is the first gate. $85,000 is the gate that changes everything.
Frequently Asked Questions (FAQ)
What are the key resistance levels for Bitcoin right now?
The two critical resistance levels are the 200-day SMA at $83,000 — the most significant structural barrier — and the 0.618 Fibonacci retracement at $85,000 — the golden ratio level that typically caps recoveries in strong downtrends. Clearing both would validate a major trend reversal.
What did analyst say about Bitcoin’s $85K level?
Analyst stated that a break above $85,000 would force him to close his swing short — noting it would be “something we rarely see in a strong downtrend.” He would not look to short again until a clear shift back below that level — signalling that $85K is the line professional bearish traders are watching most closely.
What is the weekly MACD crossover signal identified?
A bullish MACD crossover occurred on Bitcoin’s weekly chart on April 13, 2026. @alicharts notes this specific signal has historically preceded multi-month rallies of +146.82%, +75.11%, and +35.23% in prior cycles — with BTC already up 15% since the crossover.
What are Bitcoin’s price targets if it breaks above $85K?
A confirmed break above $85,000 opens the path to $89,000 as the primary macro expansion target, $94,000 as the secondary level, and $100,000 as the full weekly MACD crossover projection if the historical pattern plays out completely.
What happens if Bitcoin is rejected at $83K or $85K?
A rejection at either level would likely trigger a retest of the $78,000–$80,000 support zone. A deeper rejection could bring the $74,000–$76,000 defensive liquidity zone back into focus — and would strengthen the bull trap thesis that the current rally is a high-level bounce rather than a genuine trend reversal.
The opinions and market insights shared on CoinsProbe represent the views of individual authors based on prevailing market conditions at the time of publication. Cryptocurrency investments carry significant risk and volatility. Readers are encouraged to conduct their own research and seek professional financial advice before making investment decisions. CoinsProbe and its contributors do not accept responsibility for financial losses or decisions made based on published content.
CoinsProbe may publish sponsored articles, affiliate links, or promotional collaborations. All sponsored material is clearly labeled to maintain transparency with our audience. Our editorial decisions remain fully independent, and advertising partnerships do not influence reviews, rankings, or published opinions.
Since 2023, CoinsProbe has delivered reliable insights on cryptocurrency, blockchain, and digital assets. Our content is created by experienced researchers and analysts who follow strict editorial standards focused on accuracy, transparency, and credibility. Every article is carefully reviewed and verified using trusted sources and current market data. We provide unbiased analysis and timely updates covering everything from emerging crypto projects to major industry developments.