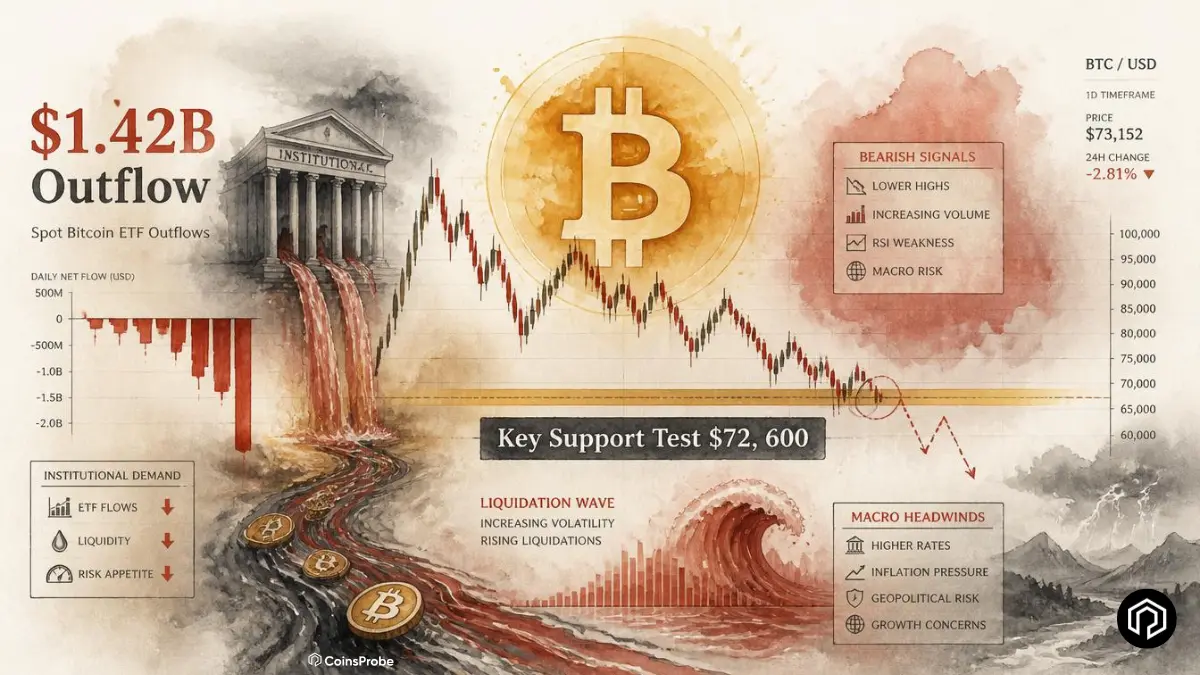

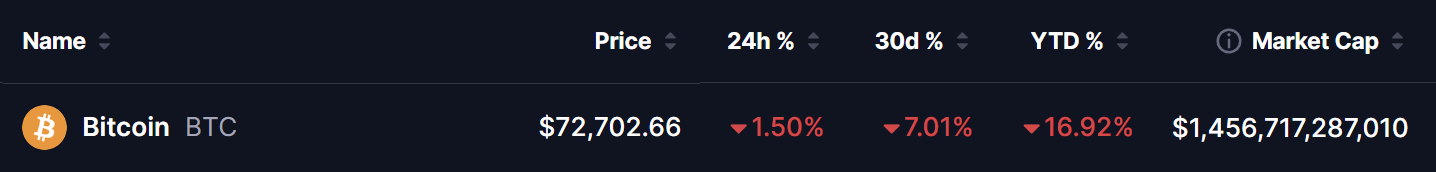
- Bitcoin is trading at $72,702 — down -1.50% in 24 hours, -7.01% over 30 days, and -16.92% year-to-date — with a market cap of approximately $1.456 trillion.
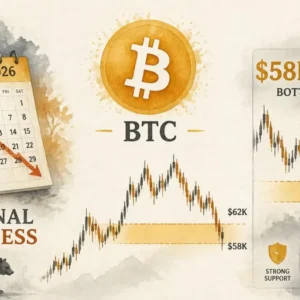
- The 200-day SMA at ~$82,000 has acted as a strong resistance ceiling — with multiple failed reclaim attempts confirming it as a significant supply zone and the technical turning point of the current decline.
- Spot Bitcoin ETFs recorded $1.42 billion in net outflows during the week of May 25–29 — the third-highest weekly outflow on record — removing a key institutional demand pillar that supported prior rallies.
- Analyst identifies $72,650 as a critical MVRV Pricing Band support level — with a break below opening the path toward the $54,300–$51,000 zone as the next major support cluster.
Bitcoin is entering June 2026 under sustained pressure — and the technical, institutional, and on-chain picture is telling a consistent story of weakening demand following the failure to reclaim the 200-day SMA. Trading at $72,702, BTC has now shed approximately $9,300 from the May high near $82,000 — and the key question for the weeks ahead is whether the MVRV support level at $72,650 holds or becomes the next level to give way.
As we covered in our Bitcoin 200 SMA bearish fractal analysis and our Bitcoin $74,654 crash article, the 200-day SMA has been the decisive level separating the bullish recovery thesis from the 2022-style bearish fractal scenario throughout 2026. The repeated failure to reclaim it is the most important technical development of the current period.
The 200 SMA Rejection — The Technical Turning Point
Bitcoin’s inability to sustain momentum above the $82,000 region has been the dominant technical theme since early May. The May high coincided closely with the 200-day Simple Moving Average — a level we have consistently identified as the most critical resistance in the current cycle — and the market’s reaction confirmed every concern about what failure to reclaim it would mean.
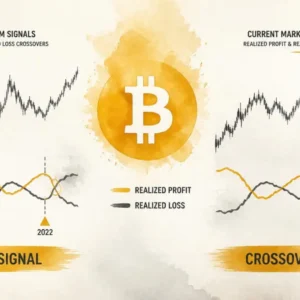
Multiple attempts to break and hold above the 200 SMA all failed — each rejection adding to the supply accumulation at the level and reducing the buying pressure available for the next attempt. The pattern is familiar from our 2022 bearish fractal comparison: in 2022, Bitcoin also tested the 200 SMA multiple times, failed to reclaim it, and subsequently declined significantly. The 2026 structure is tracking that template with uncomfortable precision.
Since the May high rejection, BTC has steadily drifted lower — posting negative 30-day and year-to-date performance — and has yet to find the conviction buying needed to reverse the trend. The price action reflects a market where sellers are in control above $82,000 and buyers have not yet established a floor below it.
ETF Outflows — The Institutional Pillar Weakening
The technical weakness is being compounded by a significant deterioration in institutional flows. According to on-chain data shared by Wu Blockchain, spot Bitcoin ETFs recorded $1.42 billion in net outflows during the week of May 25–29 — the third-highest weekly outflow on record.
The weekly ETF flow picture:
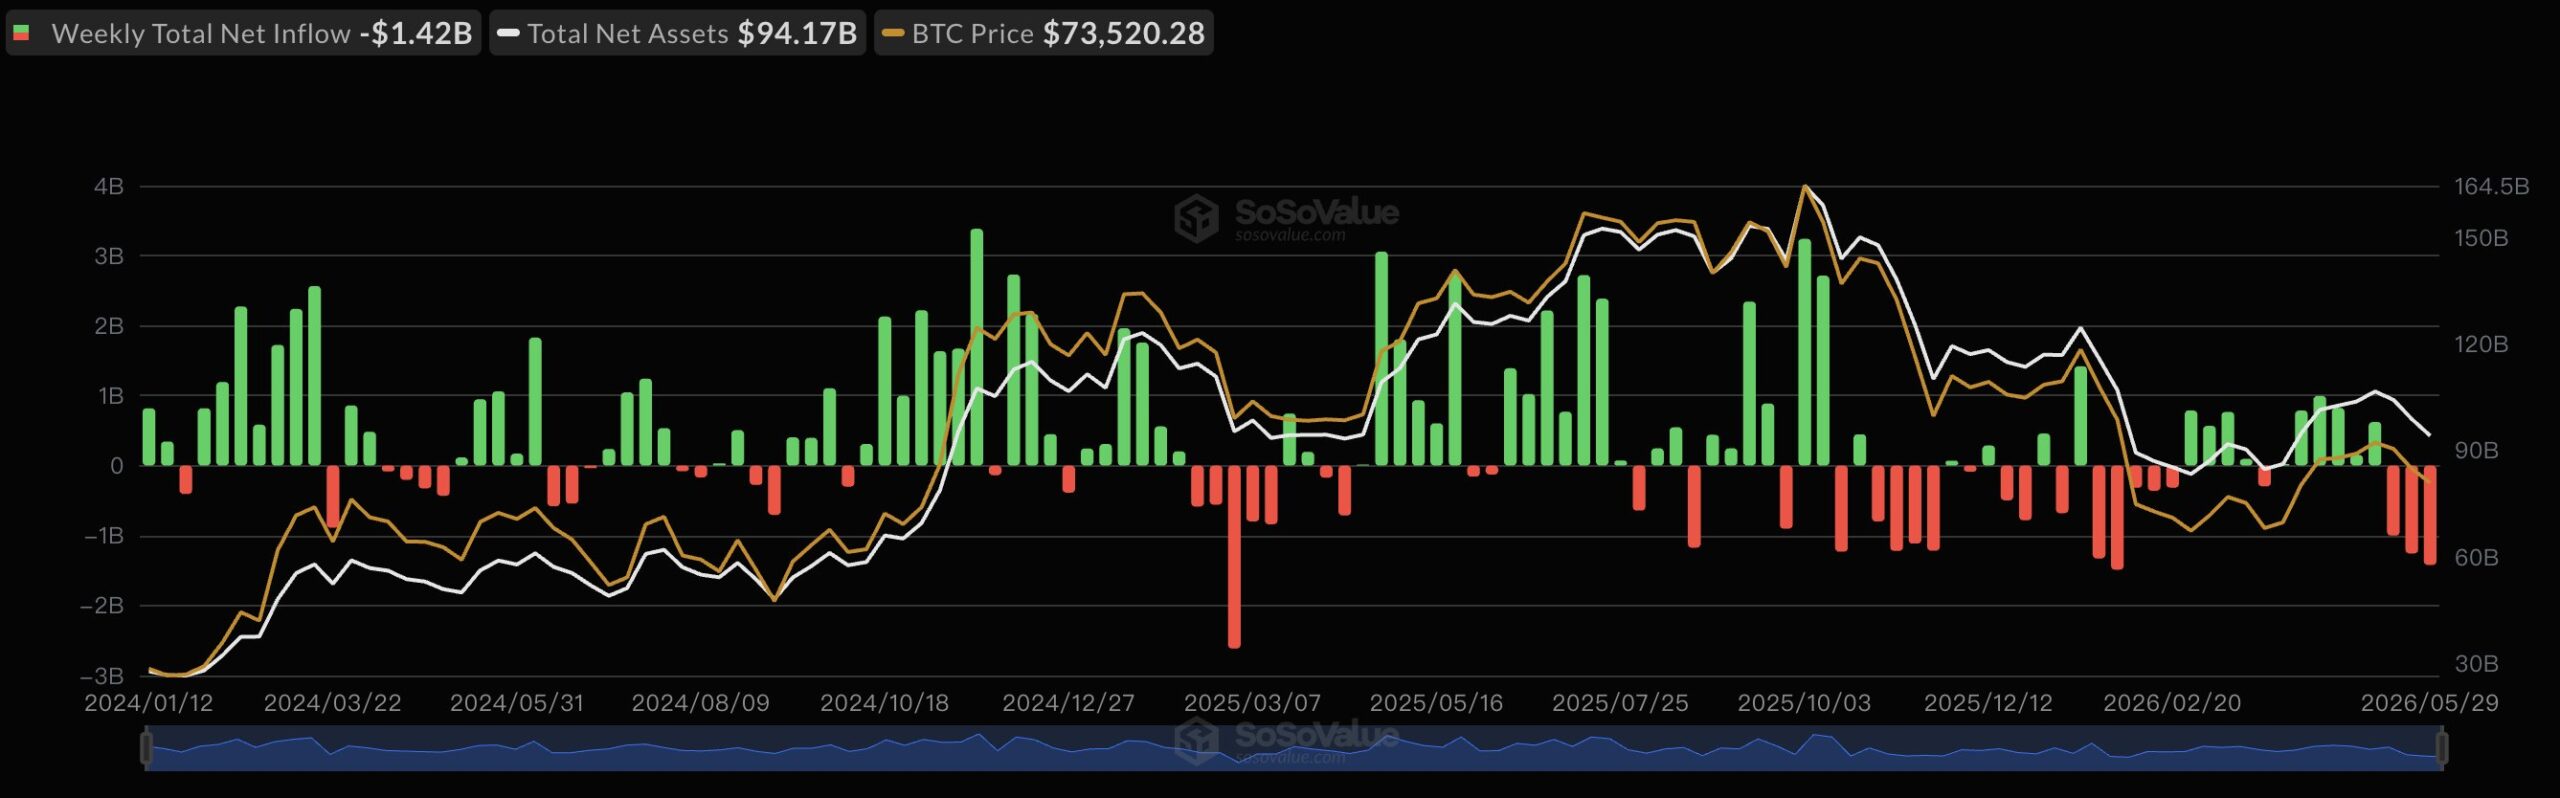
The significance of this data point is hard to overstate. As we detailed in our Bitcoin ETF flows and fractal analysis, the sustained ETF inflow momentum was one of the primary fundamental supports for Bitcoin’s recovery from the $60,061 February low. Weekly inflows averaging $10B+ at the peak provided the institutional demand floor that absorbed macro-driven selling and geopolitical shock events.
The shift to $1.42B in weekly outflows — the third-highest on record — signals that institutional participants are reducing rather than building exposure at current prices. This is not a one-week anomaly. It is the third significant outflow week in a sequence that suggests the institutional demand dynamic has fundamentally shifted since the 200 SMA rejection.
Ethereum ETFs seeing -$241M and altcoin products managing only modest inflows confirms this is a broad institutional risk reduction — not selective rotation.
On-Chain Support — The MVRV Level at $72,650
Against the technical and institutional headwinds, analyst @alicharts has identified a specific and historically significant support level that Bitcoin is now testing:
$72,650 — the MVRV Pricing Band support zone.
The Market Value to Realized Value (MVRV) ratio is one of the most respected on-chain valuation frameworks in Bitcoin analysis — measuring the relationship between Bitcoin’s current market price and the average price at which all coins last moved on-chain. MVRV Pricing Bands define specific price levels where the ratio reaches historically significant thresholds — levels where on-chain data suggests the market is at a high-conviction demand zone.
At $72,650, Bitcoin is testing an MVRV support band that has historically attracted significant buying activity. This is the level @alicharts identifies as critical — not because of a moving average or trendline, but because of what it represents in terms of where long-term holders and on-chain participants are likely to defend.

The current price at $72,702 is essentially at this level right now — making the next few daily closes the most important data point for the near-term direction.
What’s Next — Key Scenarios
Bullish Scenario
The $72,650 MVRV support holds on a sustained daily closing basis — attracting the on-chain buyer conviction that the level historically represents. The $73,000–$71,300 confluence zone — where the 100-day SMA, ascending channel floor, and 23.6% Fibonacci retracement converge — acts as the broader support cluster that prevents further downside.
ETF outflows moderate in the first week of June — with the third-highest weekly outflow potentially marking a local peak in institutional de-risking. Any resolution in the US-Iran geopolitical tensions — as we covered in our Bitcoin recovery and US-Iran de-escalation article — would provide the macro tailwind needed to stabilise flows and support a recovery attempt toward $78,000–$80,000.
Bearish Scenario
A sustained daily close below $72,650 would break the MVRV support band — eliminating the on-chain defence and opening the path toward the next major support cluster at $54,300–$51,000. This scenario aligns with the 2022 bearish fractal playing out — where the 200 SMA rejection was followed by a sustained multi-month decline well below the initial breakdown level.
The combination of persistent ETF outflows, macro headwinds, and technical breakdown would create a self-reinforcing negative feedback loop — with each lower price attracting more institutional de-risking.
Frequently Asked Questions (FAQ)
Why is Bitcoin dipped in May 2026?
Bitcoin is under pressure from three converging forces — the confirmed 200-day SMA rejection at $82,000 acting as a resistance ceiling, record-level spot ETF outflows of $1.42B in a single week, and broader macro headwinds from ongoing geopolitical tensions.
What is the MVRV support level for Bitcoin?
The MVRV Pricing Band at $72,650 is an on-chain valuation support level based on the Market Value to Realized Value ratio — identifying price zones where on-chain data suggests high-conviction demand historically emerges. Bitcoin is currently testing this level.
How significant are the Bitcoin ETF outflows?
The $1.42B weekly outflow during May 25–29 was the third-highest weekly Bitcoin ETF outflow on record — signalling institutional participants are reducing rather than building exposure at current prices.
What is Bitcoin’s next support if $72,650 breaks?
A sustained break below $72,650 would open the path toward the $54,300–$51,000 zone — the next major support cluster identified by @alicharts and consistent with the 2022 bearish fractal scenario we have been tracking.
The opinions and market insights shared on CoinsProbe represent the views of individual authors based on prevailing market conditions at the time of publication. Cryptocurrency investments carry significant risk and volatility. Readers are encouraged to conduct their own research and seek professional financial advice before making investment decisions. CoinsProbe and its contributors do not accept responsibility for financial losses or decisions made based on published content.
CoinsProbe may publish sponsored articles, affiliate links, or promotional collaborations. All sponsored material is clearly labeled to maintain transparency with our audience. Our editorial decisions remain fully independent, and advertising partnerships do not influence reviews, rankings, or published opinions.
Since 2023, CoinsProbe has delivered reliable insights on cryptocurrency, blockchain, and digital assets. Our content is created by experienced researchers and analysts who follow strict editorial standards focused on accuracy, transparency, and credibility. Every article is carefully reviewed and verified using trusted sources and current market data. We provide unbiased analysis and timely updates covering everything from emerging crypto projects to major industry developments.