
- Bitcoin trades at $78,270 — down 2.23% in 24 hours — as Alphractal identifies a mass leveraged liquidation event
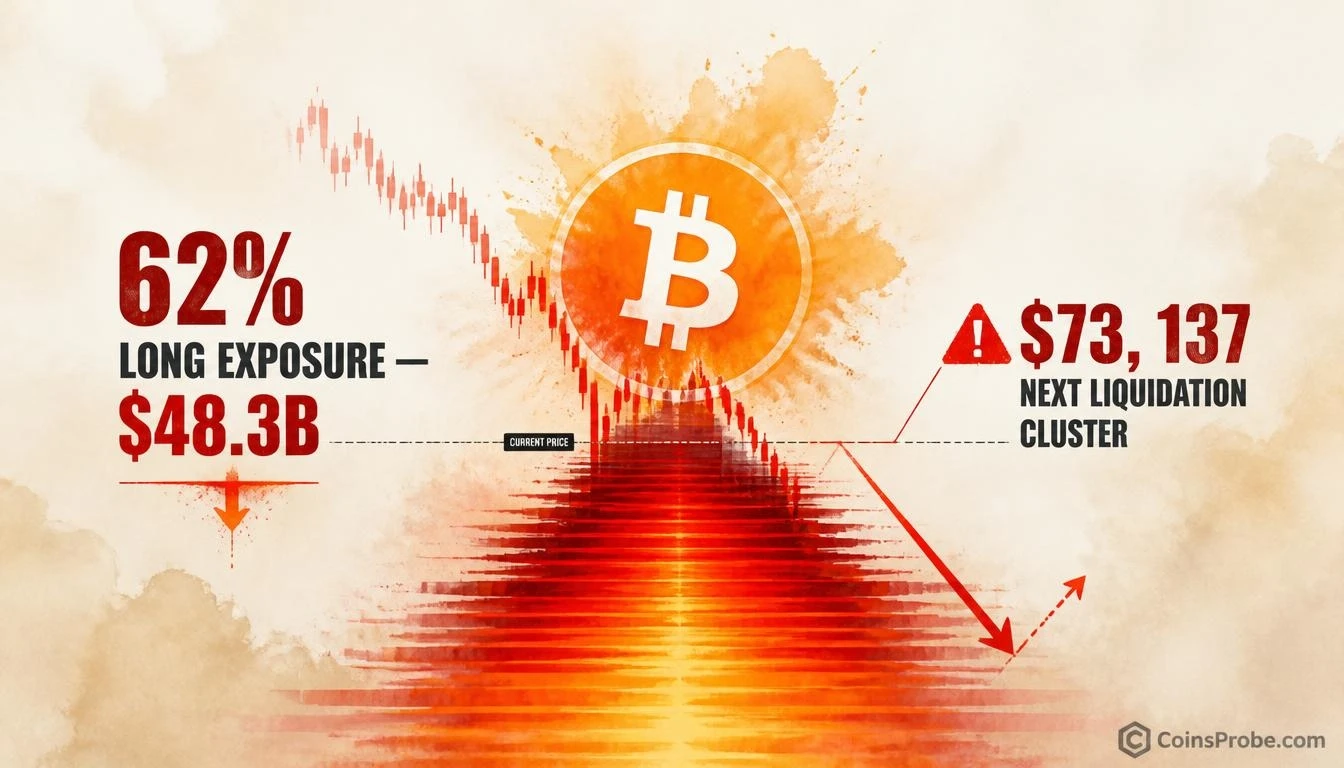
- Liquidation heatmap shows $48.3B long vs $29.1B short exposure — a 62/38 split driving the mechanical cascade
- Key long liquidation clusters at $73,137–$73,627 hold $1.1–1.2B each; short squeeze trigger sits at $78,275–$78,520
Bitcoin is trading at $78,270 — down 2.23% in the past 24 hours, with $1.57 trillion in market cap evaporating intraday — and the dominant explanation circulating across crypto social media is wrong. This is not a macro event. This is not a regulatory shock. This is a leveraged liquidation cascade, and the data makes that distinction unambiguous.
That is the direct assessment from market intelligence platform Alphractal (@Alphractal), posted on October 30, 2026. Their exact words: “Today’s sell-off is simply a mass liquidation event! News and narratives are flying in every direction, but the reality is that the crypto market is heavily leveraged.” No hedging. No conditional framing. A declarative conclusion backed by liquidation heatmap data.
What the Liquidation Heatmap Actually Shows
Alphractal’s proprietary liquidation distribution chart — visualizing accumulated long and short positions across the Bitcoin price spectrum — tells the structural story behind today’s move. The chart covers October 1–30, 2026, on a monthly timeframe.
The total liquidation distribution reads $48.3 billion in accumulated longs against $29.1 billion in accumulated shorts — a 62% long / 38% short split. This is the foundational imbalance. When leverage skews this heavily to the long side, a sustained downward move does not merely hurt traders — it mechanically forces their positions to close, which in turn pushes price lower, which triggers the next tier of long liquidations. This is the cascade structure Alphractal is identifying.
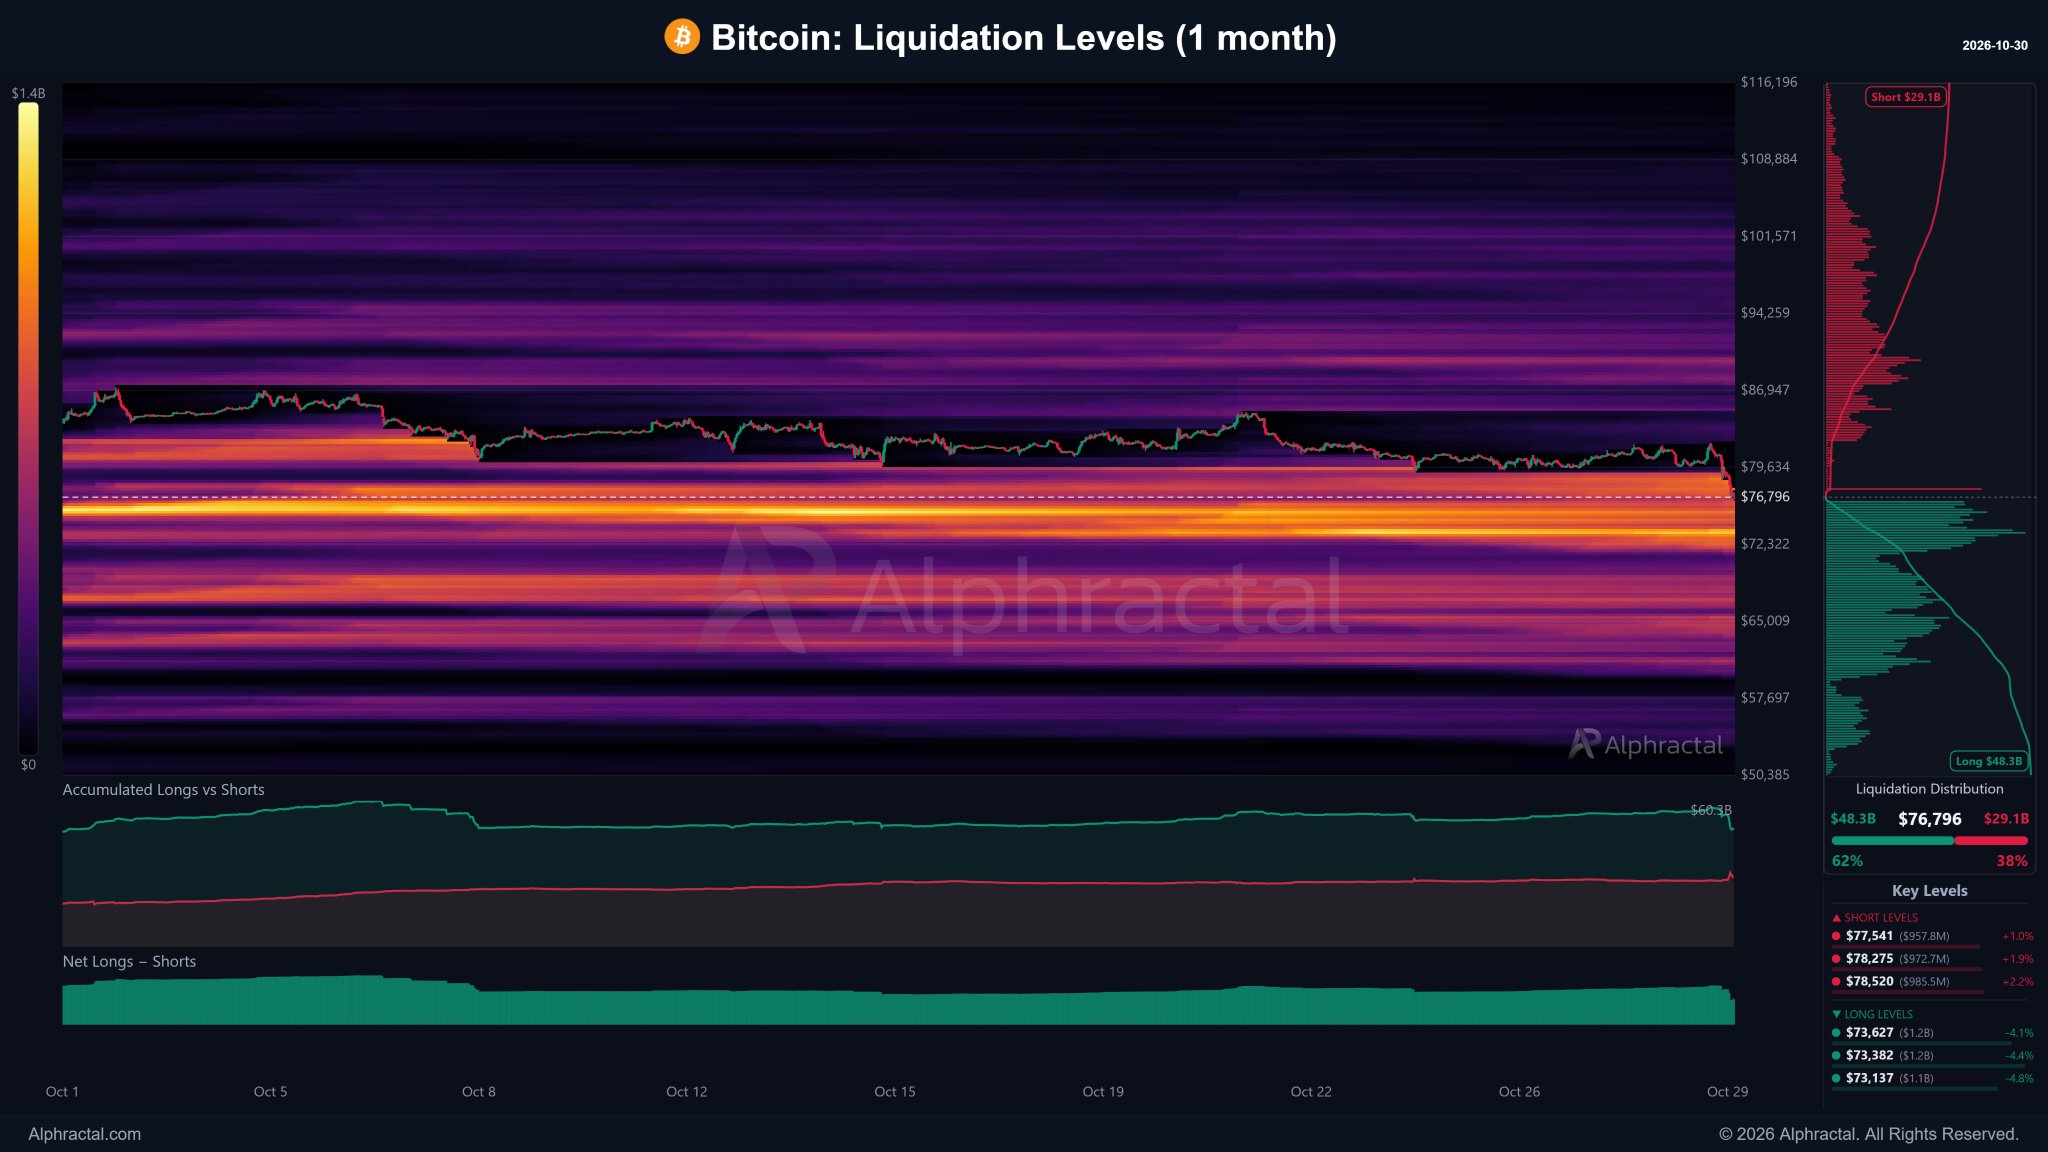
The chart’s liquidation density — visualized as orange and yellow heat bands — shows the brightest concentration sitting directly below current price. As of October 30, Bitcoin’s price was sitting at approximately $76,796 on the chart’s annotated price axis, with the densest liquidation cluster immediately beneath. Key long liquidation levels flagged on the chart include $73,627 (carrying $1.2 billion in exposure, representing a 4.1% drop from the annotated level), $73,382 ($1.2 billion, -4.5%), and $73,137 ($1.1 billion, -4.8%). These are not support levels in any technical sense — they are concentrations of forced selling that activate automatically if price reaches them.
On the short side, the chart identifies key short liquidation levels at $77,541 ($957.8 million, +1.0% from annotated price), $78,275 ($972.7 million, +1.0%), and $78,520 ($985.5 million, +2.2%). These represent the upside triggers — levels where a recovery would mechanically squeeze short positions and could produce a sharp bounce. At time of writing, Bitcoin’s live price of $78,270 sits almost precisely at the $78,275 short liquidation cluster flagged on the chart.
Why the Narrative Framing Is Noise
Liquidation-driven moves generate enormous narrative noise. Every sell-off of meaningful magnitude produces post-hoc explanations — macro fear, regulatory rumors, exchange instability, geopolitical triggers. Alphractal’s analytical point is that none of those explanations are the mechanism here. The mechanism is mechanical position unwinding triggered by price hitting a liquidation threshold.
This distinction matters for how traders should respond. A fundamental breakdown requires re-evaluation of Bitcoin’s long-term investment case. A liquidation cascade does not — it requires understanding where the liquidation clusters are concentrated, what positions remain at risk, and whether the cascade has run its course. The Alphractal chart is designed to answer exactly those questions.
Notably, Bitcoin’s exchange netflow had already turned positive for the first time since September 21 in the days preceding this move — a structural signal that selling pressure was building before today’s liquidation event materialized.
The Leverage Structure Behind the Move
The 62/38 long-short split in accumulated liquidation exposure — $60.3 billion total, with $48.3 billion long-side versus $29.1 billion short-side — quantifies why this particular sell-off carries the mechanical signature it does. The market entered October heavily positioned long. When price began declining, the long-side liquidation clusters activated in sequence.
The cascade dynamic works as follows: price drops to the first liquidation tier → leveraged longs are force-closed → those closures add sell pressure → price drops to the next tier → the process repeats. It continues until either the liquidation clusters are exhausted or a structural buyer absorbs the forced selling. The heatmap shows $1.1–1.2 billion in long exposure concentrated in the $73,137–$73,627 range — meaning significant mechanical sell pressure remains if price continues lower.
On the 24-hour volume reading of $51.1 billion — significantly elevated — the volume spike itself is consistent with a liquidation event, not with organic selling driven by fundamental reassessment. High volume on a liquidation cascade reflects forced position closes, not deliberate exit decisions.
Bullish Scenario
A recovery through the $78,275–$78,520 short liquidation cluster — where $957.8 million to $985.5 million in short exposure is concentrated — would mechanically trigger short covering and could produce a sharp relief rally. The short squeeze dynamic above $78,520 has the potential to rapidly reverse intraday losses, given the density of short positions sitting at that level. This is a mechanical condition, not a fundamental one.
Bearish Scenario
If Bitcoin fails to reclaim the $78,275 cluster and price continues lower, the next concentrated liquidation zone sits at $73,627–$73,137, carrying $1.1–1.2 billion in long exposure at each tier. Reaching those levels would activate another leg of the cascade, extending the sell-off mechanically. The $73,137 level represents approximately a 4.8% further decline from the chart’s annotated price position.
Cutting Through the Noise
Alphractal’s core analytical framework — using liquidation heatmaps to distinguish mechanical price action from narrative-driven moves — is precisely the tool this market environment demands. October 30, 2026 is producing exactly the scenario the heatmap was built to identify: a market in which news is abundant, explanations are plentiful, and the actual driver is leverage structure. The 62% long dominance in accumulated exposure, the $48.3 billion long-side liquidation pool, and the cascade pattern visible in the heat-band concentration all point to the same conclusion Alphractal stated directly — this is a liquidation event, not a fundamental one.
Watch $73,137 as the level where the next major long liquidation cluster activates — and $78,520 as the short-side trigger that could mechanically reverse the move if reclaimed with sustained buying pressure.
Frequently Asked Questions
What is a liquidation cascade and why does it cause sudden Bitcoin price drops?
What are the key Bitcoin liquidation levels to watch after today’s sell-off?
Why does Alphractal say the news and narratives explaining today’s Bitcoin drop are wrong?
How does the $51 billion in 24-hour Bitcoin trading volume fit into the liquidation cascade narrative?
Source: Alphractal · Published by CoinsProbe Markets Desk
The opinions and market insights shared on CoinsProbe represent the views of individual authors based on prevailing market conditions at the time of publication. Cryptocurrency investments carry significant risk and volatility. Readers are encouraged to conduct their own research and seek professional financial advice before making investment decisions. CoinsProbe and its contributors do not accept responsibility for financial losses or decisions made based on published content.
CoinsProbe may publish sponsored articles, affiliate links, or promotional collaborations. All sponsored material is clearly labeled to maintain transparency with our audience. Our editorial decisions remain fully independent, and advertising partnerships do not influence reviews, rankings, or published opinions.
Since 2023, CoinsProbe has delivered reliable insights on cryptocurrency, blockchain, and digital assets. Our content is created by experienced researchers and analysts who follow strict editorial standards focused on accuracy, transparency, and credibility. Every article is carefully reviewed and verified using trusted sources and current market data. We provide unbiased analysis and timely updates covering everything from emerging crypto projects to major industry developments.