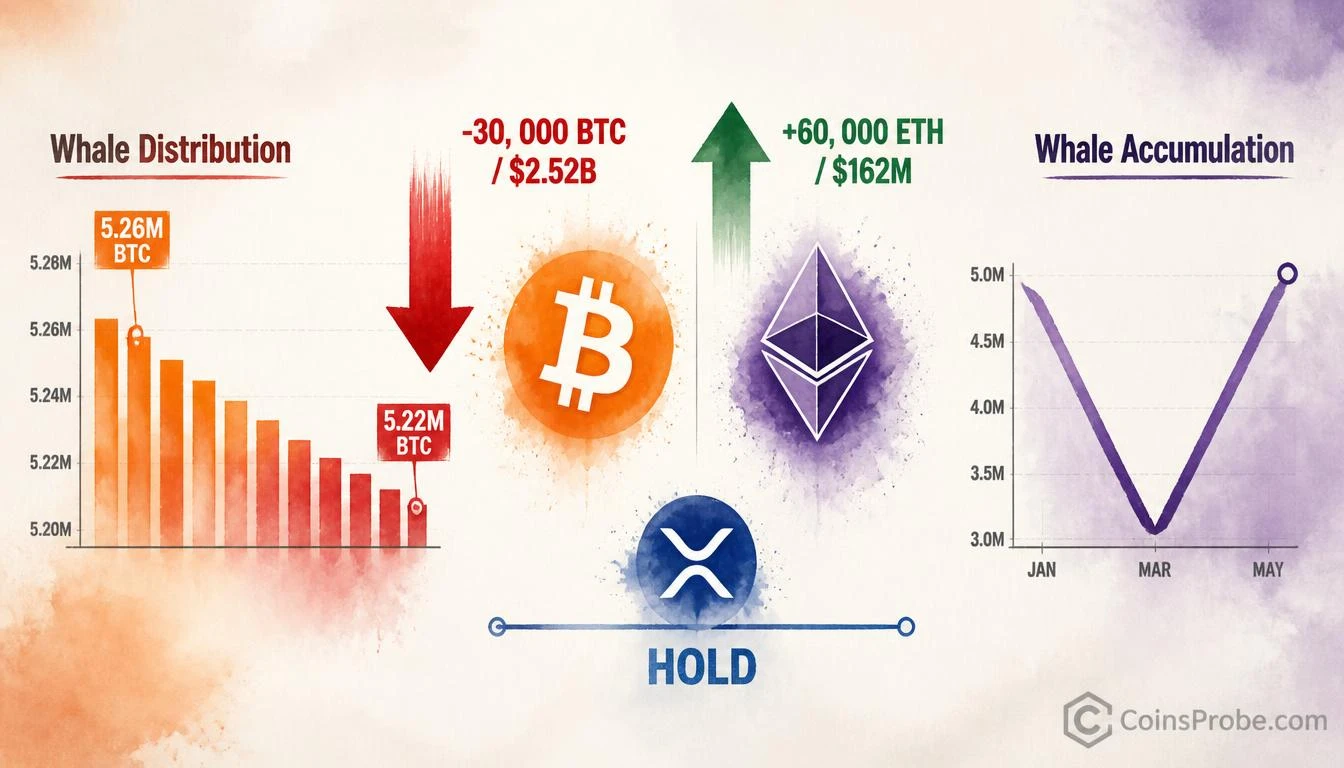
- BTC whales dumped 30,000 BTC — worth $2.52B — during the September 27–October 1 sideways market, per Santiment via @alicharts
- ETH whales moved in the opposite direction, adding 60,000 ETH (~$162M) in a V-shaped accumulation pattern over the same five days
- XRP whale holdings held near 3.90–3.91B XRP with no sustained distribution — buy-the-dip behavior confirmed
- Watch BTC whale holdings at the 5.22M BTC stabilization floor — a break below it signals distribution is resuming
Bitcoin is trading at approximately $84,080 — up just 0.26% in the last 24 hours — while the broader market has spent the past week grinding sideways. Beneath that surface calm, one group has been quietly moving: whales. And the direction they moved in was not the same across assets.
Crypto analyst Ali Martinez (@alicharts) published a four-part Santiment data thread on October 1 documenting what large holders did during the consolidation. The finding is a split-screen moment: Bitcoin whales distributed aggressively, Ethereum whales accumulated, and XRP whales barely moved. Three assets. Three completely different behavioral profiles — during the same low-volatility window.
Signal 1 — Bitcoin Whale Distribution: 30,000 BTC Off the Table
During the stretch from approximately September 27 to October 1, wallets holding between 1,000 and 10,000 BTC — the institutional-grade whale cohort tracked by Santiment — reduced their aggregate holdings by roughly 30,000 BTC. At current prices, that is approximately $2.52 billion in exposure removed from the market.
The timing is the critical detail. This distribution did not occur during a sharp price decline or a high-volume sell-off. It occurred during a period of suppressed volatility, when retail attention was minimal and price action offered no obvious reason to exit. That pattern — offloading during dull markets — is textbook quiet distribution: large holders reducing position size before the next directional move, without triggering price-discovery on the way out.
The Santiment chart shared by @alicharts shows the mechanism clearly: peak whale holdings of approximately 5.26M BTC on September 27–28, followed by a steep decline to a stabilization level around 5.22–5.23M BTC by October 1. The two tall accumulation bars at the peak represent the high-water mark — and the subsequent decline represents the outflow.
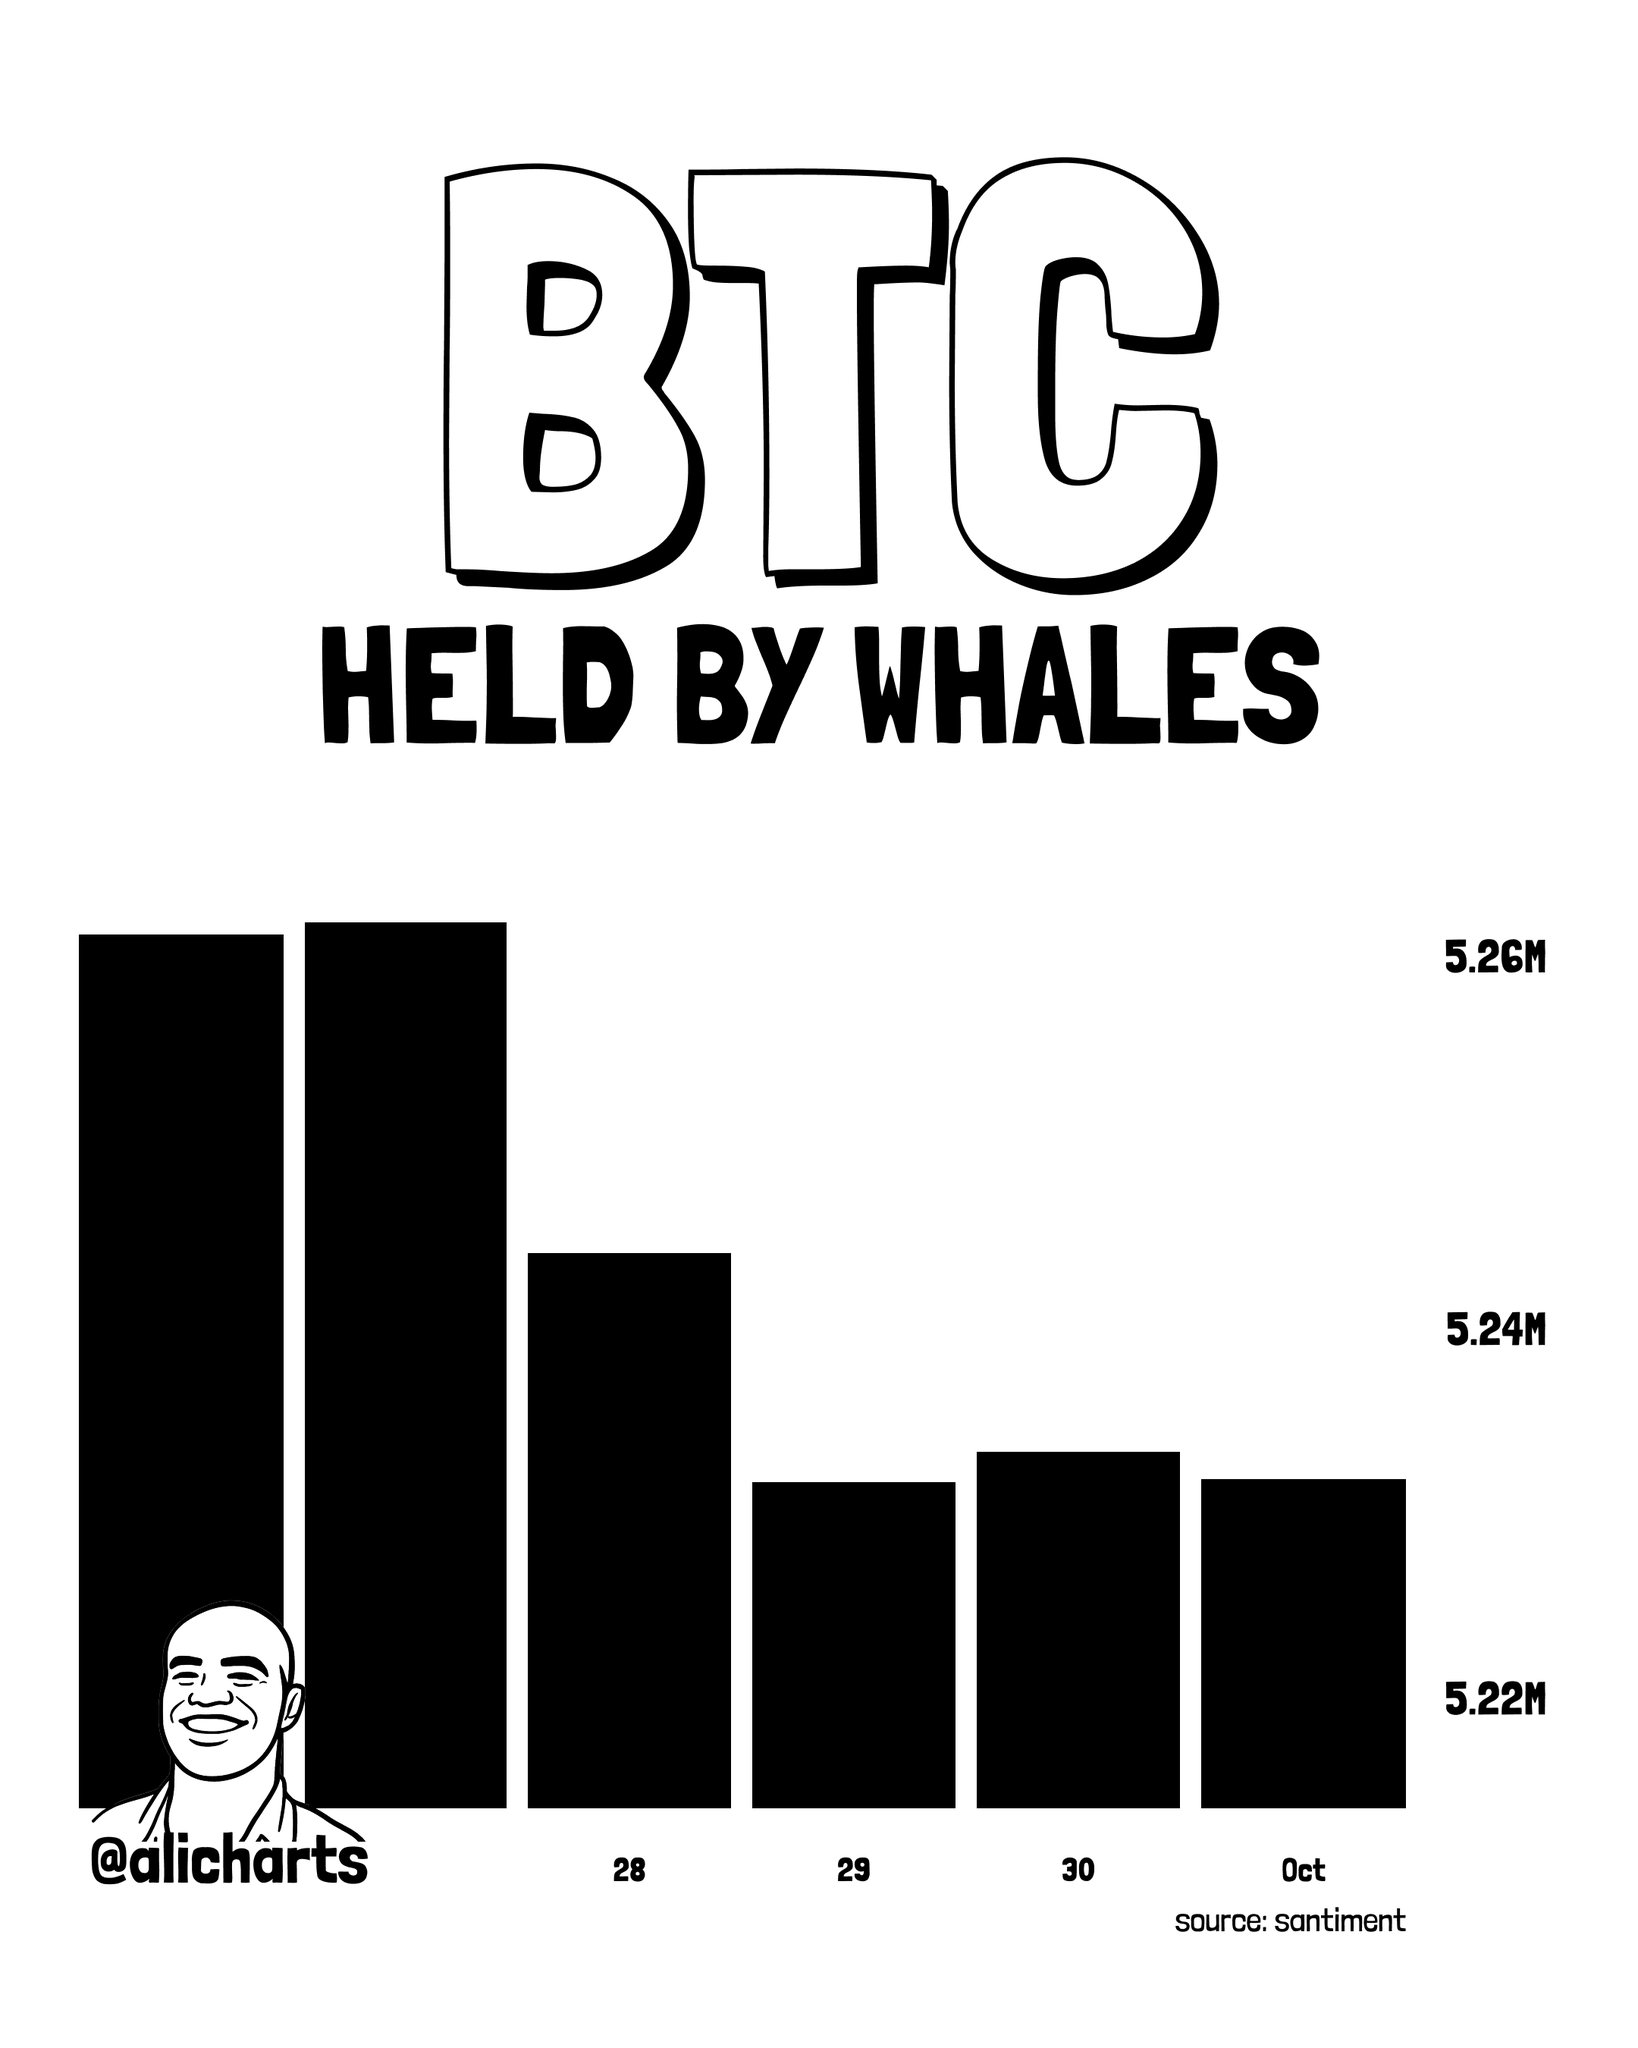
Stabilization near 5.22M BTC suggests the distribution may have paused temporarily. It does not confirm reversal. Until whale holdings resume a sustained upward trend, the signal remains directionally bearish at the large-holder level. The on-chain context here aligns with the broader distribution thesis flagged in the Bitcoin Fractal Cycle analysis projecting an October 2026 distribution phase.
Signal 2 — Ethereum Whales: 60,000 ETH Added, V-Shaped Accumulation
Ethereum tells a structurally different story over the same five-day window. Whale holdings in ETH began the period at approximately 10.47M ETH on September 27, surged to a peak of 10.72M ETH on September 28, dipped briefly to around 10.55M ETH on September 29–30, then recovered back toward 10.68M ETH by October 1.
The net result: an addition of roughly 60,000 ETH over the period — worth approximately $162 million. The pattern is a textbook V-shaped accumulation: an initial aggressive buy, a brief shakeout, and then a resumption of buying near the weekly high. Whales did not panic on the September 29–30 pullback. They bought it.
The behavioral implication is unambiguous. When large holders re-accumulate near recent highs — rather than taking profit — it signals that they regard current prices as an attractive entry, not a distribution zone. The September 29–30 dip was a temporary shakeout, not a trend change. Recovery to 10.68M ETH with the net 60,000 ETH addition intact confirms sustained buying pressure from strong hands.
Signal 3 — XRP Whales: Quiet Hold, No Distribution
XRP whale behavior during the same window was the most static of the three. Holdings ranged between approximately 3.87B XRP at the low (September 28–29) and 3.91B XRP at the range high — a spread of roughly 40 million XRP, or less than 1% variance across the full five-day period.
The dip on September 28–29 was followed by a recovery back to approximately 3.90B XRP by October 1 — buy-the-dip behavior at the whale level, not distribution. No sustained outflows. No significant reduction in aggregate holdings. XRP whales absorbed the mid-week volatility and rebuilt positions back toward weekly highs.
For traders, the read is straightforward: the absence of large-holder selling is a neutral-to-bullish on-chain signal. When top holders are not exiting despite price volatility, it removes one of the primary downside catalysts — forced or strategic selling from large positions. This quiet accumulation pattern is worth watching in the context of the broader altcoin market breaking monthly resistance with $500B–$650B now in play.
The Divergence — What It Means When BTC Whales Sell and ETH Whales Buy
The most analytically significant element of this data is not any single asset’s reading in isolation — it is the simultaneous divergence between Bitcoin and Ethereum whale behavior.
BTC whales removed $2.52 billion in exposure during a low-volatility window. ETH whales added $162 million during the exact same window. These are not independent signals. They suggest a potential rotation dynamic: large capital moving out of Bitcoin positioning and into Ethereum — or at minimum, large holders expressing structurally different conviction levels about near-term price direction in each asset.
| Asset | Whale Action | Quantity | USD Value | Signal Type | |——-|————-|———-|———–|————-| | BTC | Distribution | −30,000 BTC | −$2.52B | Bearish | | ETH | Accumulation | +60,000 ETH | +$162M | Bullish | | XRP | Hold / Recovery | ~Flat | Neutral | Bullish Neutral |Source: Santiment data via @alicharts (X), October 1, 2026
The asymmetry in dollar terms is notable: Bitcoin whales moved fifteen times more capital out ($2.52B) than Ethereum whales moved in ($162M). That does not necessarily mean the capital went into ETH — it may have moved to stablecoins, off-exchange cold storage, or other assets entirely. But the directional divergence between the two leading assets is a signal worth tracking. The broader macro context — with gold at a potential cycle inflection point — adds another layer to why large holders may be repositioning now.
Bullish Scenario
Bitcoin whale holdings stabilize at 5.22–5.23M BTC and begin recovering toward the 5.26M BTC September 27–28 peak. A resumption of whale accumulation in BTC — confirmed by Santiment data showing net additions over 48–72 hours — would neutralize the distribution signal and restore the bullish on-chain structure. ETH and XRP continuing to hold or add would confirm broad large-holder conviction.
Bearish Scenario
Bitcoin whale holdings resume declining below the 5.22M BTC stabilization floor. Renewed distribution after a brief pause — particularly if it coincides with a breakdown below $84,000 on the price chart — would confirm that the September 27–October 1 distribution was not completed but merely interrupted. In that scenario, the $80,000 psychological level becomes the next structural test.
The data from @alicharts covers a single five-day window. One distribution event does not establish a trend. What it establishes is a behavioral shift at the large-holder level that warrants monitoring. Watch BTC whale holdings at the 5.22M BTC floor — a sustained break below it is the signal that distribution is resuming. A recovery above 5.25M BTC is the signal that large holders are back in accumulation mode.
Source: x.comFrequently Asked Questions
What does Bitcoin whale distribution during a sideways market typically signal?
Does ETH whale accumulation of 60,000 ETH offset the BTC whale selling?
At what level would BTC whale behavior flip back to bullish on-chain?
Why are XRP whale holdings considered a bullish neutral signal despite no major accumulation?
Source: Ali Charts · Published by CoinsProbe Markets Desk
The opinions and market insights shared on CoinsProbe represent the views of individual authors based on prevailing market conditions at the time of publication. Cryptocurrency investments carry significant risk and volatility. Readers are encouraged to conduct their own research and seek professional financial advice before making investment decisions. CoinsProbe and its contributors do not accept responsibility for financial losses or decisions made based on published content.
CoinsProbe may publish sponsored articles, affiliate links, or promotional collaborations. All sponsored material is clearly labeled to maintain transparency with our audience. Our editorial decisions remain fully independent, and advertising partnerships do not influence reviews, rankings, or published opinions.
Since 2023, CoinsProbe has delivered reliable insights on cryptocurrency, blockchain, and digital assets. Our content is created by experienced researchers and analysts who follow strict editorial standards focused on accuracy, transparency, and credibility. Every article is carefully reviewed and verified using trusted sources and current market data. We provide unbiased analysis and timely updates covering everything from emerging crypto projects to major industry developments.