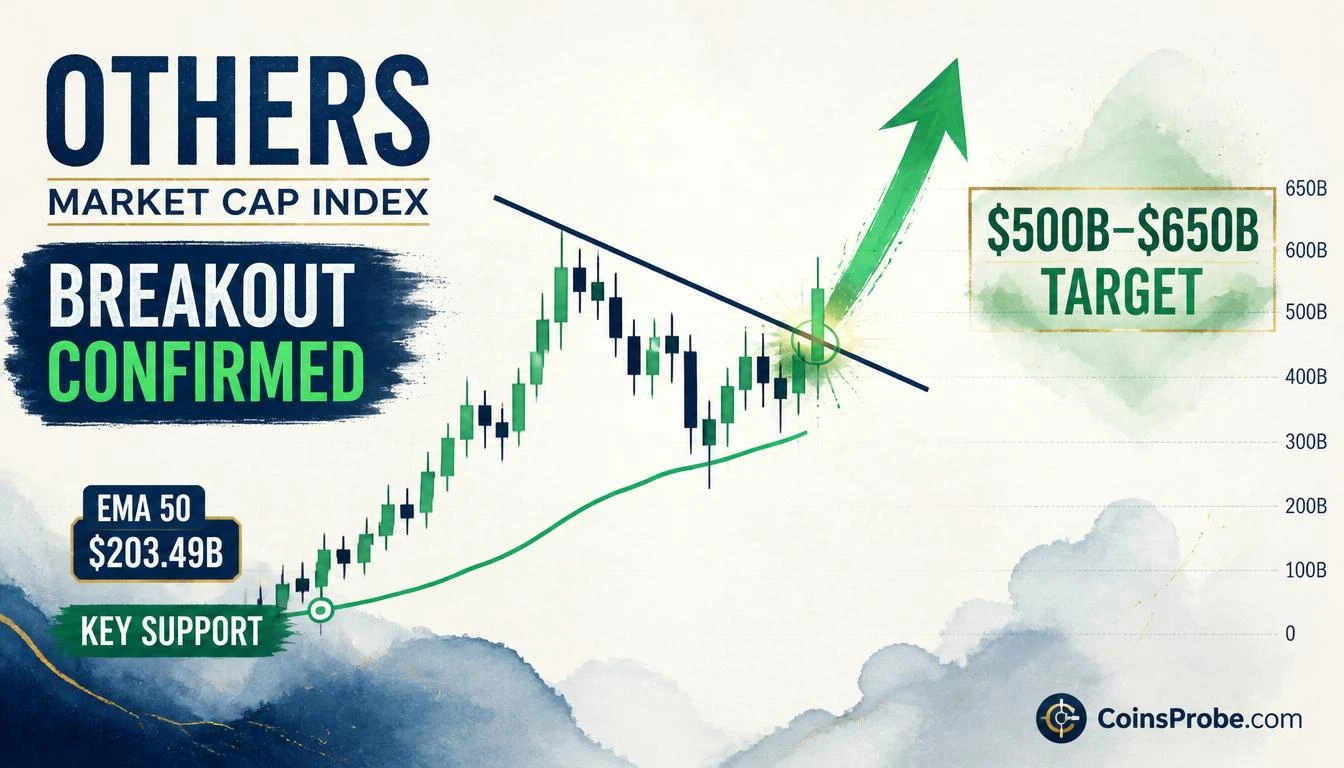
- OTHERS trades at $245.48B — up +58% from ~$155B cycle lows after monthly close above EMA 50 ($203.49B) and descending resistance
- @CryptoBullet1 flags retest of broken resistance at $230B before continuation — Morning Star pattern confirmed on monthly chart
- Breakout target: $500B–$650B range — representing +104% to +165% remaining upside from $245.48B
- Invalidation: monthly close back below EMA 50 at $203.49B negates entire breakout structure
The crypto market’s broadest altcoin gauge — OTHERS, which tracks total market capitalization excluding the top 10 coins — is trading at $245.48B after recovering from cycle lows near $155B, a +58% recovery already printed. But the move that matters most happened at the monthly close: OTHERS broke above its descending resistance trendline and reclaimed the 50-month EMA simultaneously — two structural thresholds that, together, represent the most significant technical development in the altcoin market in this cycle.
That dual breakout is what analyst @CryptoBullet1 flagged in his October 1 monthly update, stating: “$OTHERS broke above the EMA50 and closed the monthly above the Resistance line. September was bullish for Alts as expected. Now we could see a retest of the Resistance line ($230B) and then more upside. I doubt we’ll break below the EMA50 anytime soon.” A monthly close above a descending resistance line is not a daytrader event — it is a structural regime change confirmed on the highest-conviction timeframe available.
The Breakout — What the Monthly Chart Actually Shows
The monthly OTHERS chart shared by @CryptoBullet1 reveals a structure that traders should read carefully. Three data points define the setup: the EMA 50 sitting at $203.49B, the descending resistance trendline running through approximately $230B–$240B, and the current print at $245.48B — above both. Alongside the breakout candle, the chart identifies a Morning Star candlestick pattern, a three-candle bullish reversal formation that preceded the September monthly close with conviction.
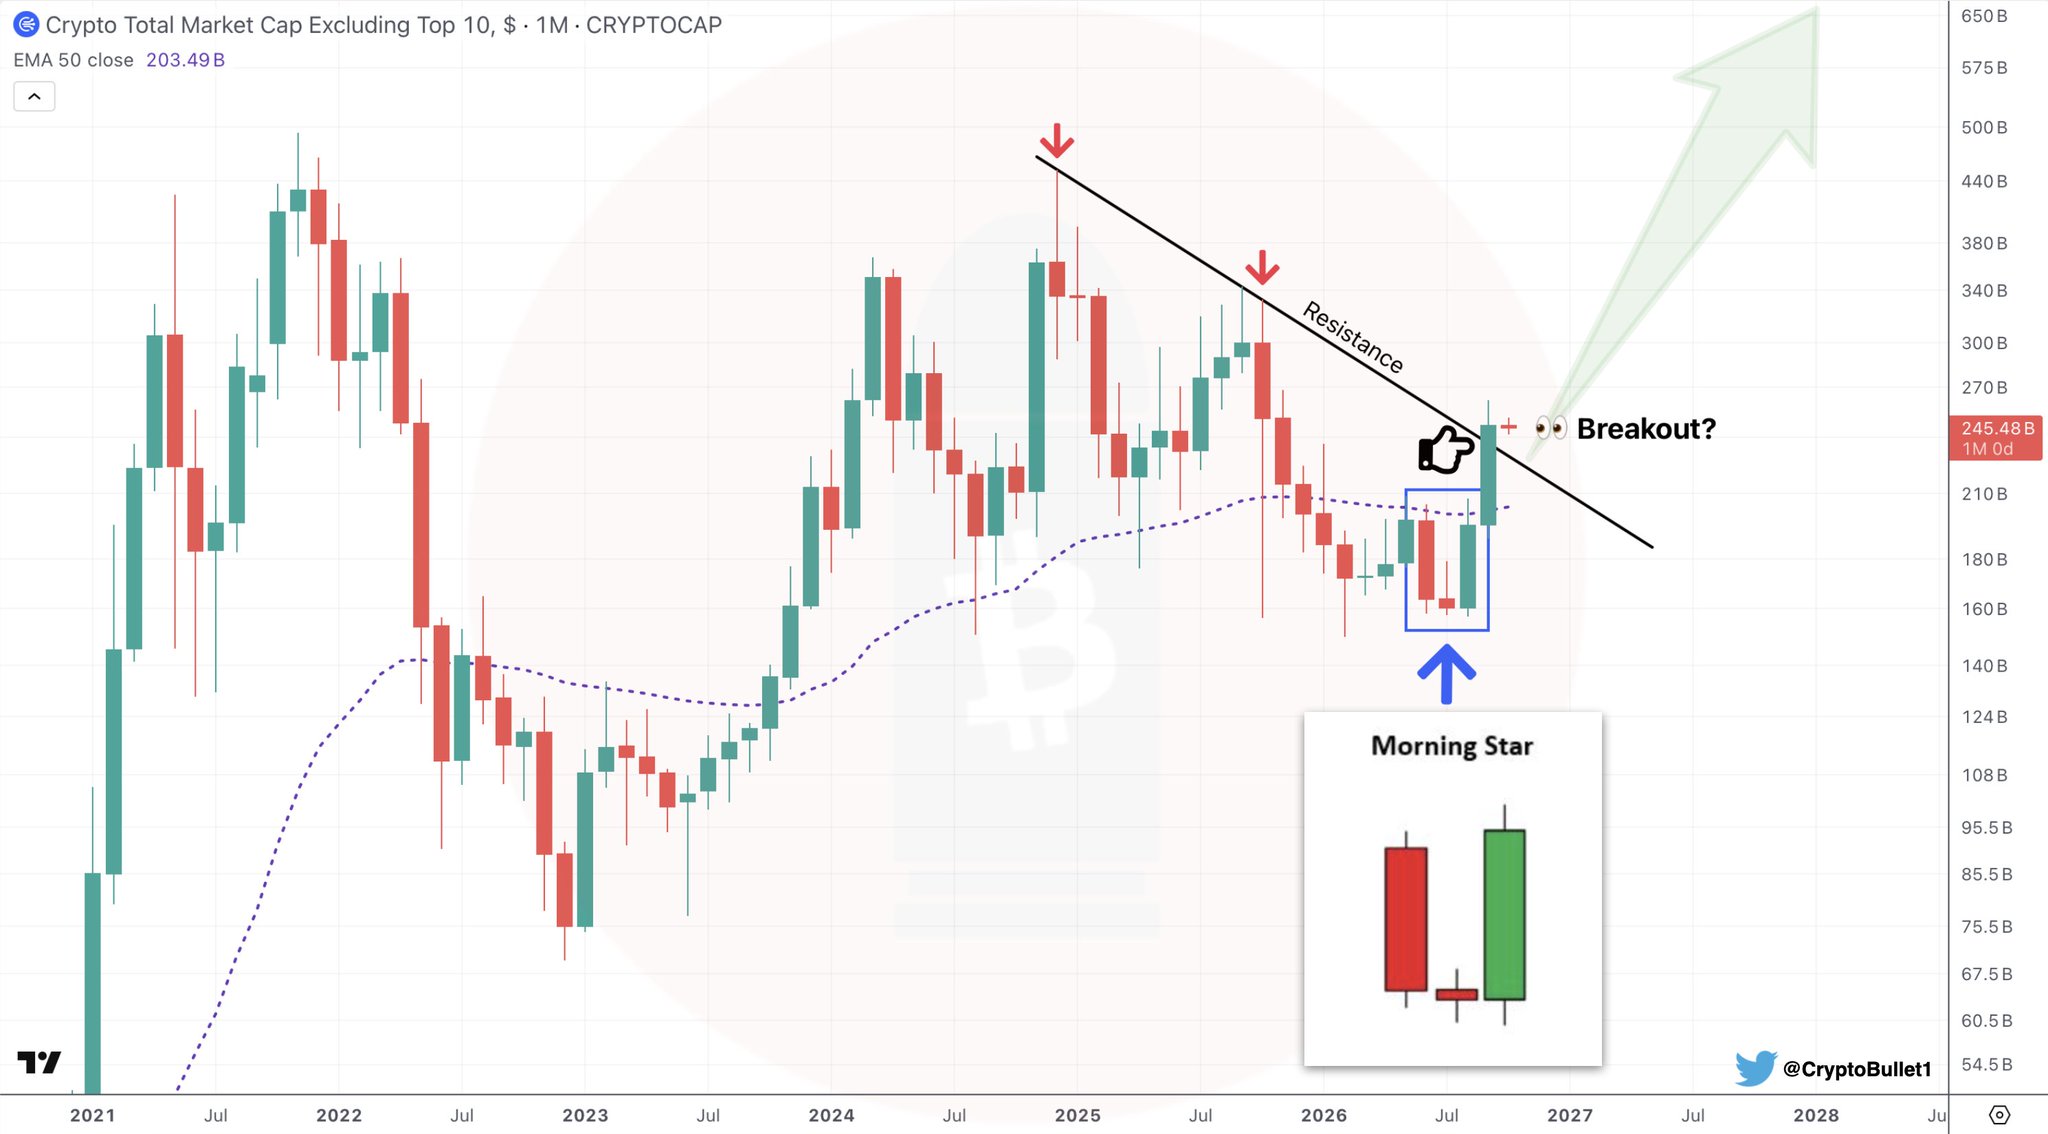
The Morning Star is not a minor pattern on a monthly chart. It marks the exhaustion of sellers across an entire calendar month, followed by indecision, followed by a decisive bullish close. When that three-candle sequence appears at the base of a descending trendline — and then the subsequent monthly candle closes above that trendline — the signal is high-conviction by construction. OTHERS produced exactly that sequence, recovering from ~$155B lows before closing October’s monthly bar at $245.48B, well above both the EMA 50 and the resistance trendline.
EMA 50 Reclaim — Why This Level Is the Structural Line
The 50-month EMA at $203.49B is not an arbitrary smoothing line. On a monthly chart, it represents the average realized trend across four-plus years of market behavior. Reclaiming it from below — and closing a full monthly bar above it — shifts the structural bias from bearish to bullish by definition. @CryptoBullet1’s assessment that he “doubts we’ll break below the EMA 50 anytime soon” is not sentiment — it is based on the fact that monthly EMA 50 reclaims on the OTHERS index have historically preceded multi-month altcoin expansion phases.
The invalidation level for this entire thesis is a monthly close back below $203.49B. Not an intraday wick. Not a weekly close. A sustained monthly closing price below the EMA 50 would negate the breakout structure and reset the analysis. That level is currently $42B below the present print — approximately 17% downside — which reinforces @CryptoBullet1’s confidence that the EMA acts as a durable floor rather than a near-term risk.
The Retest Scenario — $220B–$230B as Potential Entry Zone
@CryptoBullet1 explicitly flags a retest of the broken resistance, now turned support, at approximately $230B before further upside. This is standard breakout mechanics: a level that acted as resistance for months or years becomes support once cleanly broken with a monthly close. The expected retest range sits between $220B and $230B — representing roughly 6%–10% pullback from current levels before the continuation leg begins.
For altcoin investors, this retest zone — if it materializes — represents the technically cleaner entry point. The breakout itself has already occurred. The confirmation is already printed. A pullback to $220B–$230B would offer exposure to the next leg without chasing the initial breakout candle. The structure only breaks down if that retest fails and OTHERS closes a monthly bar below $203.49B.
The Target Range — $500B to $650B
The chart’s measured move projection points to a $500B–$650B target range. From current levels of $245.48B, that implies a remaining upside of +104% to +165%. This is not a short-term price target — it is the full breakout projection derived from the depth of the prior consolidation range and the width of the descending channel that OTHERS has now exited.
To put the range in context: $500B on the OTHERS index would represent a broad altcoin market capitalization roughly equivalent to the peak conditions seen in prior mid-cycle expansion phases, when capital rotated from Bitcoin dominance into the altcoin long tail. $650B would represent a full cycle expansion comparable to 2021 altcoin season peaks in the non-top-10 segment. Historically, OTHERS breakouts at the monthly timeframe have preceded exactly this type of broad alt rally — the index acts as a leading signal because it captures the aggregate behavior of thousands of tokens simultaneously. This also connects directly to broader cycle distribution dynamics — see our analysis of the Bitcoin fractal cycle flagging a distribution phase with an October 2026 bottom projected for the macro context in which this OTHERS breakout is occurring.
Bullish Scenario — Retest Holds, Continuation to $500B+
If OTHERS pulls back to the $220B–$230B retest zone and holds on a monthly closing basis, the next leg targets $500B as the first major measured-move objective, with $650B as the full cycle target. This scenario assumes the EMA 50 at $203.49B continues to act as structural support and no monthly close below it occurs. A confirmed hold at the retest zone — especially with volume expansion — would be the highest-conviction entry signal for broad altcoin exposure.
Bearish Scenario — Monthly Close Below $203.49B
A monthly close back below the EMA 50 at $203.49B would invalidate the breakout entirely. That outcome would imply the September close above resistance was a false breakout — a bull trap on the monthly timeframe. In that case, OTHERS would likely revisit the $155B–$170B range that formed the recent cycle low. This scenario is assessed by @CryptoBullet1 as unlikely given the momentum and structure, but it remains the defined invalidation.
What This Means for Altcoin Positioning
The OTHERS index is not a tradable asset — it is a diagnostic. When OTHERS breaks out on a monthly chart, it means that the aggregate market capitalization of thousands of altcoins outside the top 10 is expanding in a structurally confirmed way. That expansion, historically, is what drives individual altcoin outperformance versus Bitcoin and Ethereum. The current reading — EMA 50 reclaimed, descending resistance broken, Morning Star reversal confirmed, and $245.48B print above both thresholds — represents the most complete technical setup OTHERS has produced since the prior cycle’s altcoin expansion. For context on how capital is already moving at the institutional level, Bitcoin whales sold $2.52B while ETH whales bought — a rotation signal consistent with this OTHERS breakout thesis.
The setup is confirmed. The retest is anticipated. The range is $500B to $650B. What remains is either a clean retest entry at $220B–$230B or a direct continuation — with the monthly EMA 50 at $203.49B as the only level that, if lost on a monthly close, would change the entire structural picture. Watch that level above all others.
Frequently Asked Questions
What is the OTHERS index and why does a monthly breakout matter?
What is the retest level to watch before OTHERS continues higher?
What would invalidate the OTHERS breakout thesis?
Does an OTHERS breakout predict which specific altcoins will rally?
Source: Cryptobullet1 · Published by CoinsProbe Markets Desk
The opinions and market insights shared on CoinsProbe represent the views of individual authors based on prevailing market conditions at the time of publication. Cryptocurrency investments carry significant risk and volatility. Readers are encouraged to conduct their own research and seek professional financial advice before making investment decisions. CoinsProbe and its contributors do not accept responsibility for financial losses or decisions made based on published content.
CoinsProbe may publish sponsored articles, affiliate links, or promotional collaborations. All sponsored material is clearly labeled to maintain transparency with our audience. Our editorial decisions remain fully independent, and advertising partnerships do not influence reviews, rankings, or published opinions.
Since 2023, CoinsProbe has delivered reliable insights on cryptocurrency, blockchain, and digital assets. Our content is created by experienced researchers and analysts who follow strict editorial standards focused on accuracy, transparency, and credibility. Every article is carefully reviewed and verified using trusted sources and current market data. We provide unbiased analysis and timely updates covering everything from emerging crypto projects to major industry developments.