
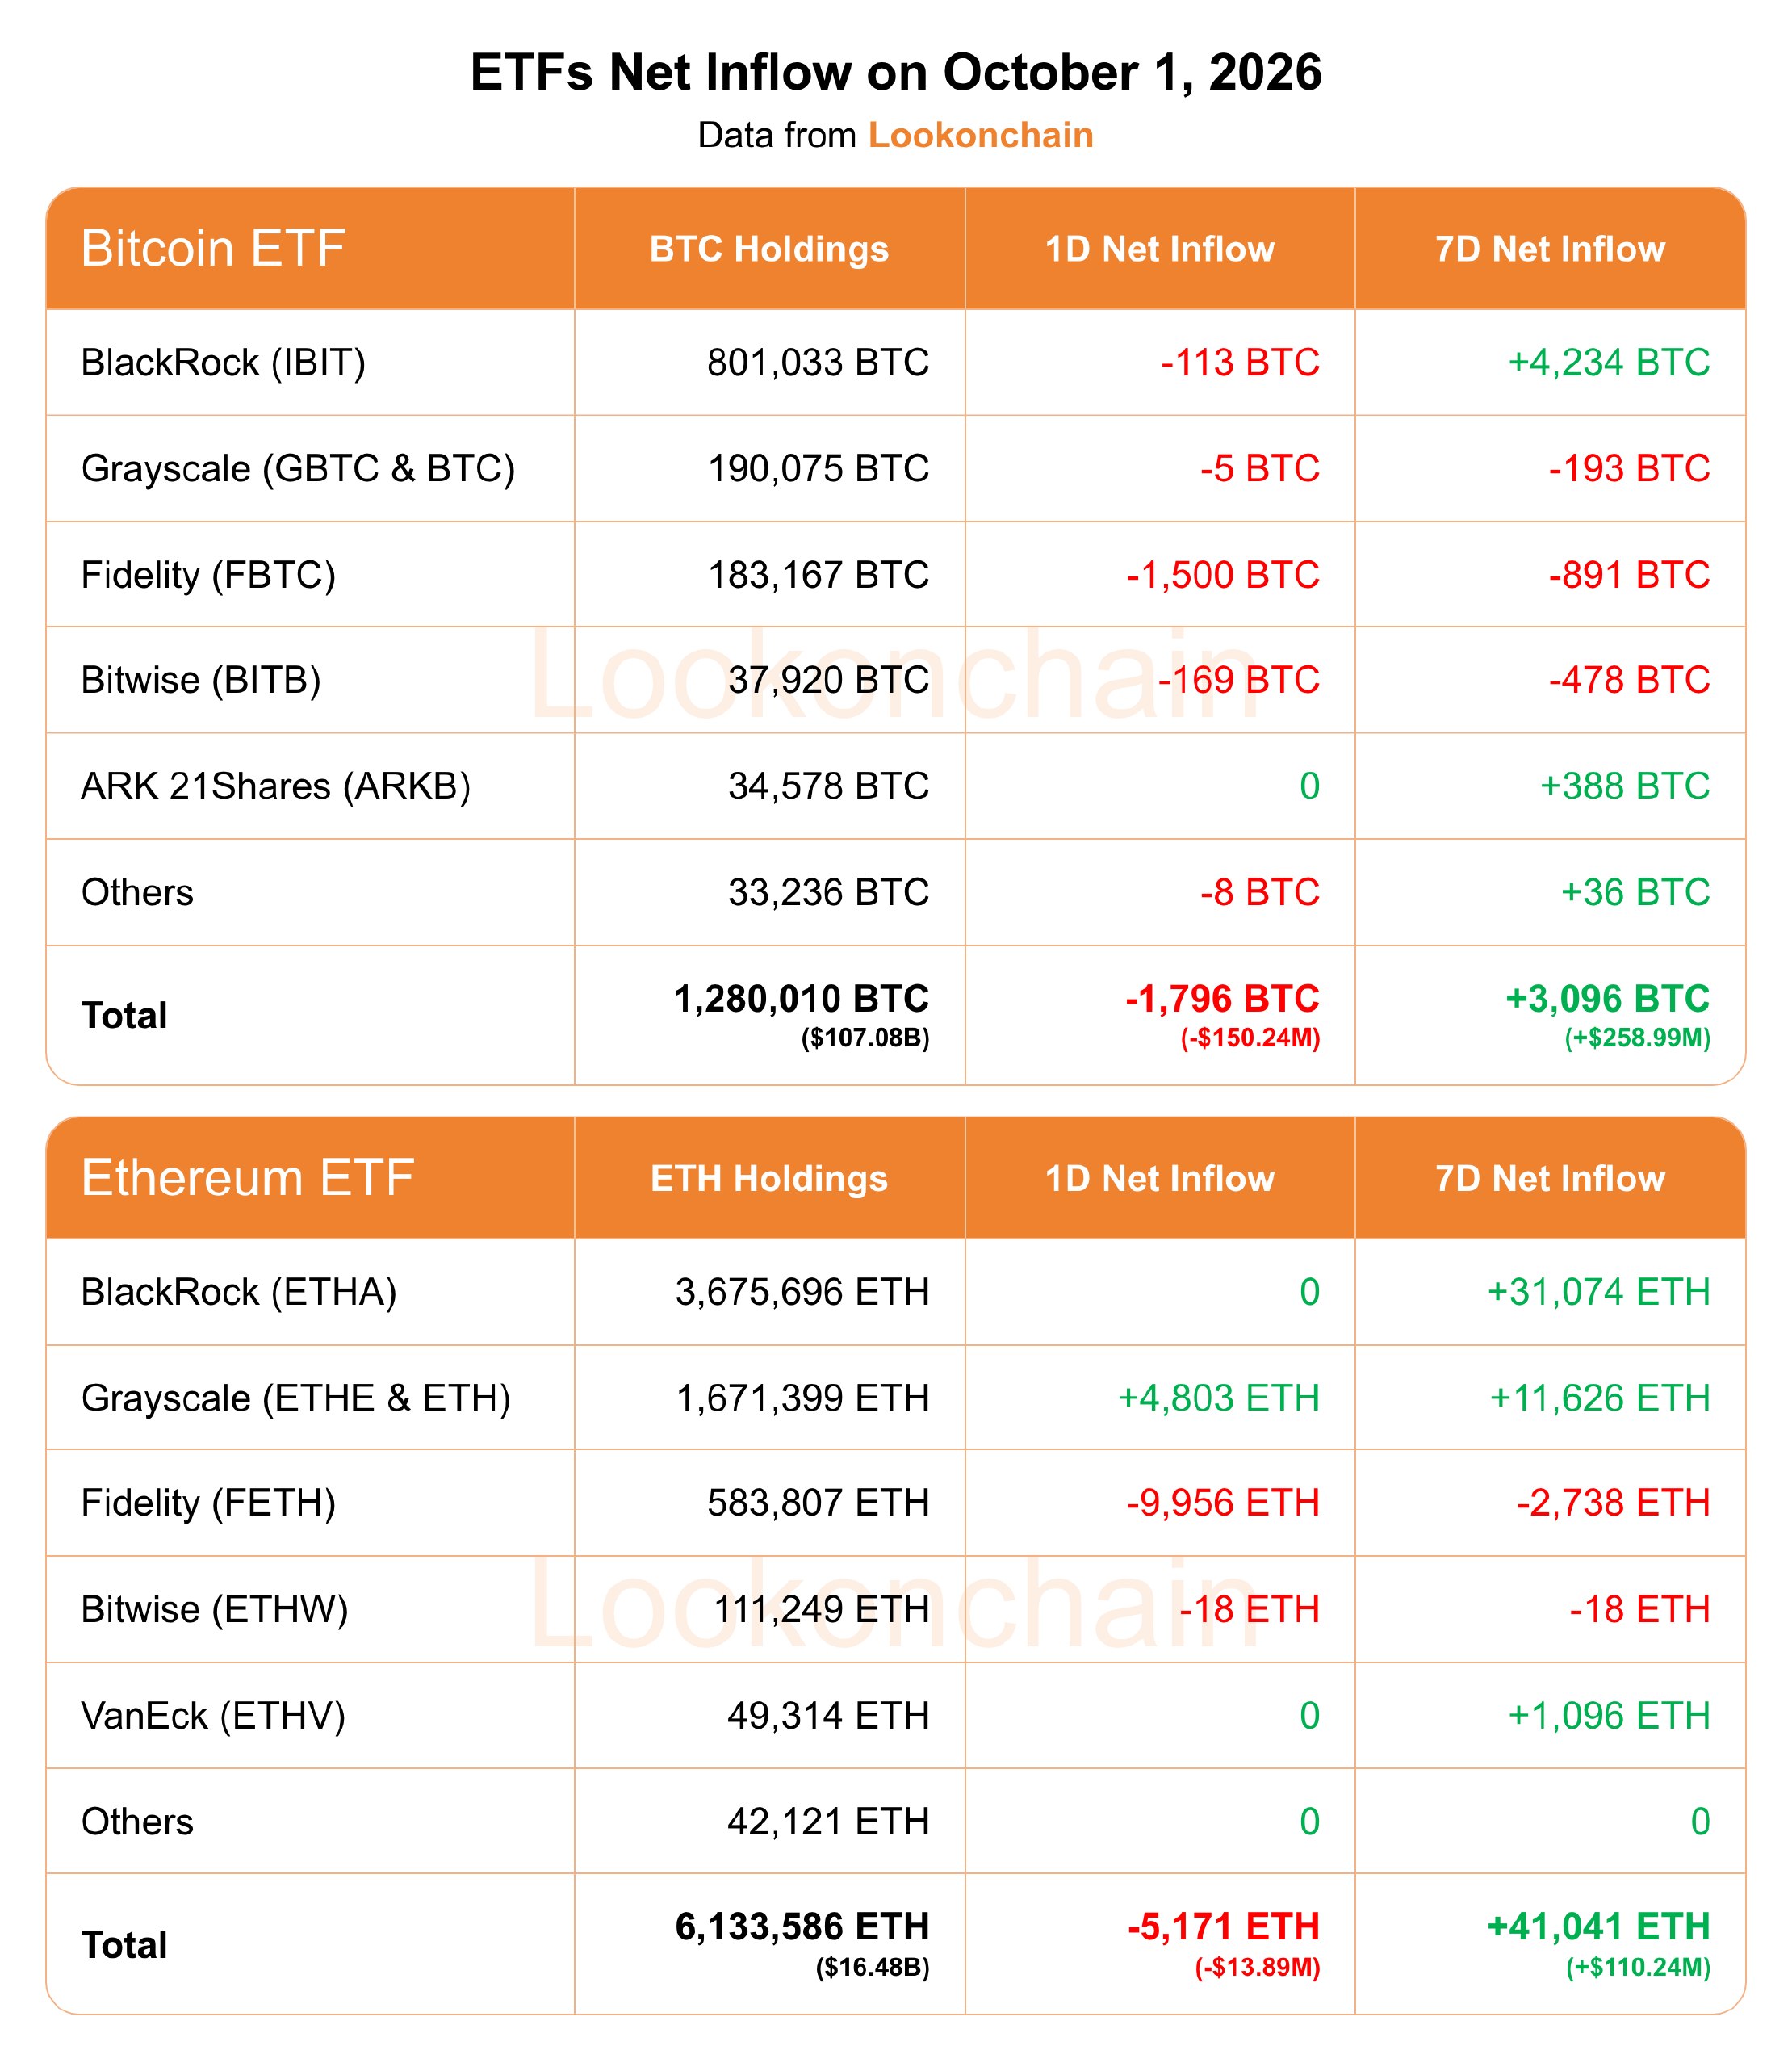
- Bitcoin ETFs: -1,796 BTC (-$150.24M) on Oct 1; 7-day net remains +3,096 BTC (+$258.99M) per Lookonchain
- Ethereum ETFs: -5,171 ETH (-$13.89M) on Oct 1; 7-day net holds +41,041 ETH (+$110.24M)
- Oct 1 BTC outflow erased 58.0% of the 7-day inflow in dollar terms; ETH daily outflow reversed only 12.6%
- Combined 7-day net inflows across BTC + ETH ETFs: ~$369.23M; Bitcoin accounts for 70.1% of the total
BREAKING
U.S. spot Bitcoin and Ethereum ETFs both recorded net outflows on October 1, 2026 — but the single-day redemptions have not erased the positive weekly momentum that built over the prior six sessions, according to data published by Lookonchain.
Bitcoin ETFs posted a one-day net outflow of 1,796 BTC, equivalent to $150.24 million. Ethereum ETFs recorded a one-day net outflow of 5,171 ETH, equivalent to $13.89 million. Both figures are red on the day. Both asset classes, however, remain net positive over the rolling seven-day window — and the divergence between the daily and weekly readings is where the structurally relevant signal sits.
Seven-Day Picture Holds Despite October 1 Reversal
Over the trailing seven days ending October 1, Bitcoin ETFs absorbed a net +3,096 BTC (+$258.99 million). Ethereum ETFs absorbed a net +41,041 ETH (+$110.24 million) over the same window, per Lookonchain.
Combined seven-day net inflows across both asset classes total approximately $369.23 million — with Bitcoin accounting for 70.1% of that figure and Ethereum accounting for 29.9%.
The October 1 single-day outflows represent a reversal of 58.0% of the seven-day Bitcoin ETF inflow in dollar terms ($150.24M against $258.99M). For Ethereum, the single-day outflow of $13.89M represents only 12.6% of the $110.24M seven-day inflow — a proportionally smaller drawback, though Ethereum’s daily outflow in coin terms (5,171 ETH) is notable given smaller overall AUM in spot Ethereum products.
Concentration and Magnitude — CoinsProbe Calculations
The combined total BTC referenced across both timeframes in the facts (1,796 BTC outflow + 3,096 BTC inflow) amounts to 4,892 BTC in gross activity. At Bitcoin’s current price of $84,304 (down 0.13% on the 24-hour window), 4,892 BTC represents approximately $412.5 million in gross two-directional flow — a volume reading that confirms institutional participation remains active even on a net-outflow session.
For Ethereum, the asymmetry is more pronounced: 5,171 ETH in single-day outflows against 41,041 ETH in seven-day inflows means the October 1 session unwound only 12.6% of the weekly build. This suggests the Ethereum ETF trend remains more intact on a relative basis than the Bitcoin ETF trend, despite both posting red on the day.
What the Data Confirms — and What It Does Not
A single-day net outflow does not reverse a weekly inflow trend. What October 1’s data confirms is that some portion of institutional holders chose to reduce exposure on that specific session — whether for end-of-month rebalancing, profit-taking, or macro-related repositioning is not determinable from flow data alone.
What the seven-day figures do confirm: both Bitcoin and Ethereum ETFs attracted net new capital over the rolling week ending October 1. The $258.99M seven-day Bitcoin ETF inflow and the $110.24M Ethereum ETF inflow are realized, aggregated net figures — not open interest or derivatives positioning. They represent actual share creation minus actual share redemption in spot ETF wrappers.
Traders watching Bitcoin’s technical structure alongside this flow data can reference the Bitcoin heatmap levels and bottom signal analysis for on-chain context that complements the ETF flow picture.
The key ratio to track going forward: if daily outflows begin to cumulatively exceed 50% of the prior seven-day inflow on consecutive sessions, the weekly trend line will compress toward flat. That threshold for Bitcoin ETFs sits at approximately $129.5M per day in net outflows (50% of $258.99M ÷ 2 remaining sessions in the week). Today’s $150.24M single-day outflow already crossed that marker — making tomorrow’s flow reading the deciding data point for whether the seven-day positive trend holds through the week.
Frequently Asked Questions
Does a single day of Bitcoin ETF outflows signal an end to the weekly inflow trend?
Why did Ethereum ETFs lose more coins (5,171 ETH) but less dollars ($13.89M) than Bitcoin ETFs on October 1?
What does the 70.1% Bitcoin versus 29.9% Ethereum split in seven-day inflows indicate?
What is the key flow metric to watch to determine if the positive weekly trend holds?
Source: Lookonchain · Published by CoinsProbe Markets Desk
The opinions and market insights shared on CoinsProbe represent the views of individual authors based on prevailing market conditions at the time of publication. Cryptocurrency investments carry significant risk and volatility. Readers are encouraged to conduct their own research and seek professional financial advice before making investment decisions. CoinsProbe and its contributors do not accept responsibility for financial losses or decisions made based on published content.
CoinsProbe may publish sponsored articles, affiliate links, or promotional collaborations. All sponsored material is clearly labeled to maintain transparency with our audience. Our editorial decisions remain fully independent, and advertising partnerships do not influence reviews, rankings, or published opinions.
Since 2023, CoinsProbe has delivered reliable insights on cryptocurrency, blockchain, and digital assets. Our content is created by experienced researchers and analysts who follow strict editorial standards focused on accuracy, transparency, and credibility. Every article is carefully reviewed and verified using trusted sources and current market data. We provide unbiased analysis and timely updates covering everything from emerging crypto projects to major industry developments.