
- Bitcoin trades at $83,823 (+0.09%) as Alphractal's 4-year fractal places BTC in Distribution phase
- Cycle peak marked October 2025 — fractal projects bear market bottom in October 2026, 12 months peak-to-trough
- Prior cycles: 2017–2018 saw -84% over 12 months; 2021–2022 saw -78% over 12 months from peak
- Key levels: $78,000 weekly close is the near-term invalidation floor; $95,000 monthly close would void the bearish fractal
Bitcoin is trading at $83,823 — up just 0.09% over the past 24 hours — with a market cap of $1.68 trillion. Beneath that flat surface, a multi-year fractal model from on-chain analytics platform Alphractal (@Alphractal) is issuing one of the more sobering cycle warnings seen this year: Bitcoin may have already printed its cycle top in October 2025 and is now tracking through a distribution phase that historically ends in a bear market bottom — projected around October 2026.
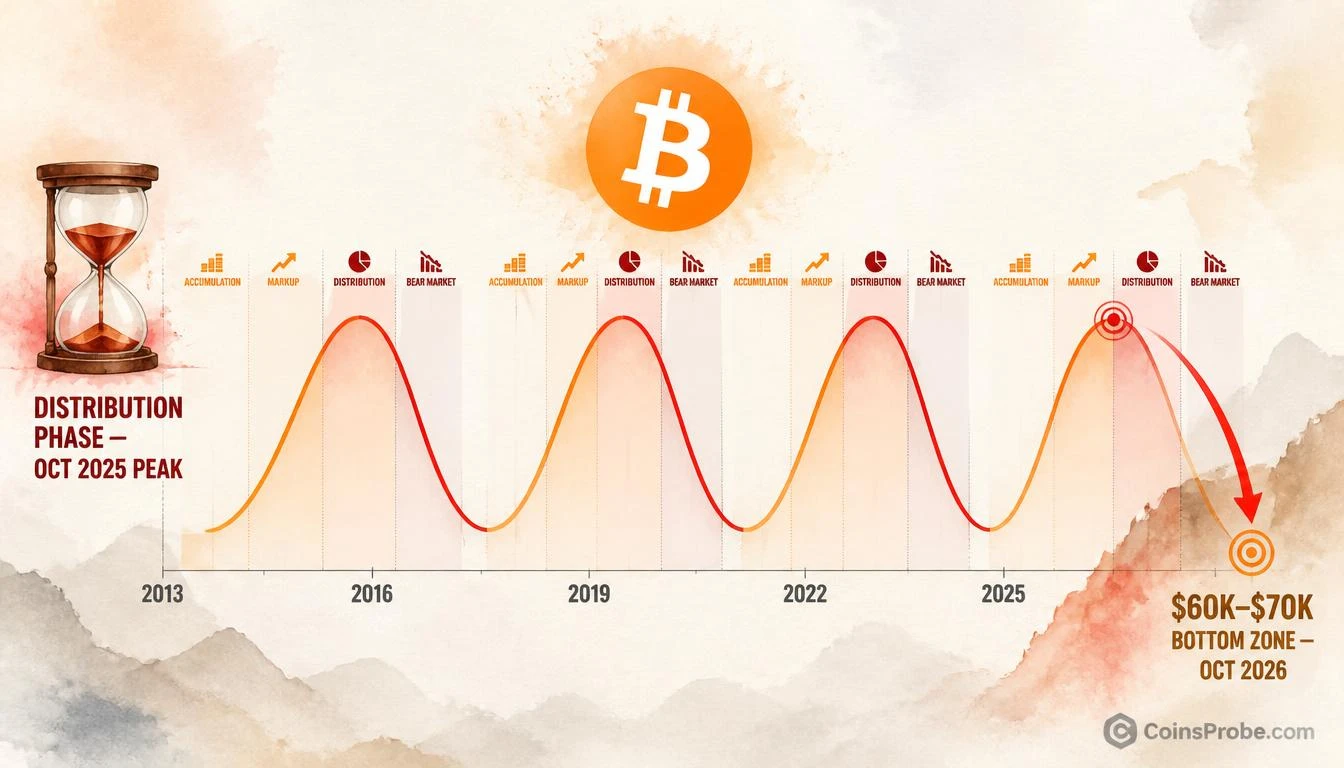
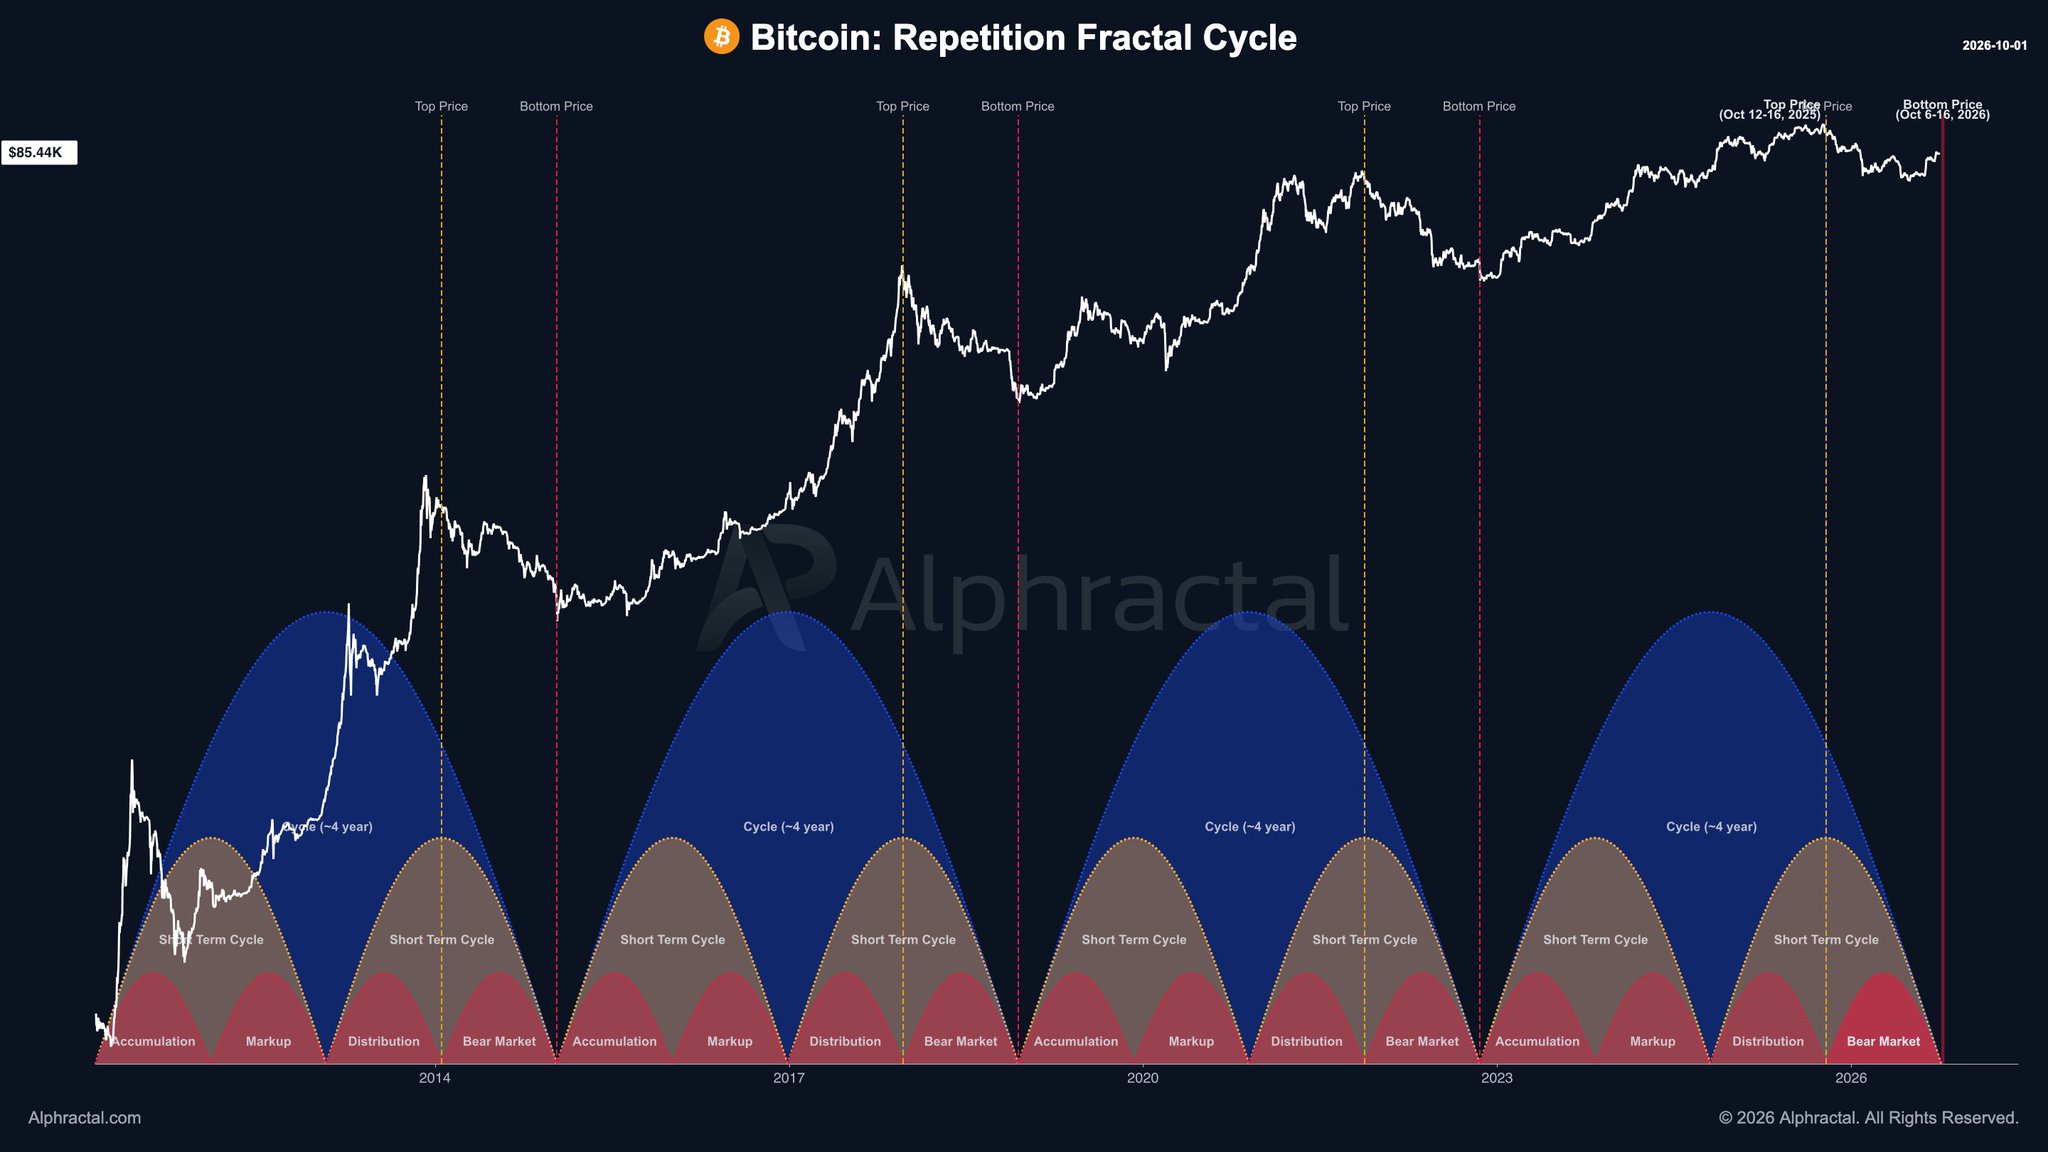
Alphractal’s team, which specializes in cycle repetition models and on-chain oscillators, flagged the chart on October 1, 2026 with a pair of hourglass emojis — a deliberate signal that time before the bear market deepens is narrowing. The framework is not based on sentiment or price momentum alone. It maps Bitcoin’s current structure against an identical four-phase cycle that has repeated across every major Bitcoin epoch since 2013: Accumulation → Markup → Distribution → Bear Market.
The 4-Year Repetition Fractal — What It Actually Measures
A repetition fractal cycle model does not predict price by extrapolating trend lines. It overlays Bitcoin’s historical market structure — phase-by-phase — onto the current cycle and identifies where, temporally and structurally, Bitcoin sits today. The model spans Bitcoin’s full documented history from 2013 to 2026, incorporating three complete four-year cycles as its reference set.
Each cycle in the dataset follows the same architecture. Accumulation is characterized by low volatility and compressed price action near the cycle low. Markup is the explosive rally phase — the period that captures most public attention. Distribution follows the markup peak: price remains elevated but momentum deteriorates, volume thins, and long-term holders begin reducing exposure. Bear Market is the final phase — the capitulation and price compression that resets the cycle for the next accumulation.
According to Alphractal’s model, Bitcoin entered the Distribution phase following its cycle peak, which the chart marks as occurring in the window of October 12–18, 2025. At $83,823 today — roughly 2% below the $85,440 reference level shown on the chart — Bitcoin is tracking in the early stages of the bear phase, not the markup. The model’s forward projection places the cycle bottom in the October 6–16, 2026 window, with a historical support zone between $60,000–$70,000 based on prior cycle trough structures.
Alphractal shared the multi-year chart showing these phase demarcations, with a red vertical line marking the projected 2026 bottom date and clear phase labels mapped against price history back to 2013.
Why the October 2025 Top Matters as a Reference Point
The credibility of any fractal model rests on the precision of its reference peak. Alphractal anchors the current cycle’s top at the October 2025 window. If that marking is accurate, it means Bitcoin at $83,823 is not consolidating before a new leg higher — it is declining from a cycle peak that has already been printed, consistent with how prior distribution phases looked in 2013–2014, 2017–2018, and 2021–2022.
In the 2021–2022 cycle, Bitcoin peaked in November 2021 near $69,000. The distribution phase was not immediately obvious — price remained elevated and volatile for months while on-chain metrics deteriorated. The bear market bottom arrived in November 2022 near $15,500, roughly 12 months after the cycle peak and representing a -78% drawdown. If the current model’s October 2025 peak holds as the reference, and the bottom is projected for October 2026, the timeline maps almost identically — approximately 12 months peak-to-trough.
The prior 2017–2018 cycle followed a similar structure. Bitcoin peaked in December 2017 near $20,000 and bottomed in December 2018 near $3,200 — again approximately 12 months and a -84% drawdown from peak. The 2013–2014 cycle compressed slightly, peak-to-trough over roughly 13 months.
Three cycles. Three peak-to-trough durations of 12–13 months. Alphractal’s current projection — October 2025 peak to October 2026 bottom — sits squarely inside that historical range. That consistency is what gives the fractal model its structural weight, rather than being a simple price extrapolation.
The $60,000–$70,000 Support Zone — What Prior Cycles Suggest
The fractal model identifies a support zone of approximately $60,000–$70,000 as the candidate bottom range, derived from the structural relationship between prior cycle peaks and troughs. In the 2021–2022 cycle, the trough represented roughly 22% of the prior cycle’s peak. Applied to an October 2025 peak, that ratio would suggest a bottom in the $15,000–$20,000 range — which would represent a severe outcome. However, Alphractal’s $60,000–$70,000 range appears to reflect a more moderate scenario anchored to the realized price of long-term holders and key on-chain cost basis clusters — a structurally supported floor rather than a worst-case capitulation low.
This distinction matters. Bitcoin’s growing institutional base — including spot ETF holders, corporate treasury buyers, and sovereign-level accumulation — compresses the magnitude of potential drawdowns compared to earlier cycles. As covered in our analysis of Bitcoin’s MVRV Z-Score holding above its 365-day average, on-chain cost basis structures are considerably higher in this cycle than in 2018 or 2022 — providing a credible floor well above prior bear market lows expressed as a percentage of peak.
It is also worth contextualizing the current whale behavior. Recent data showed Bitcoin whales sold $2.52B while ETH whales bought — a divergence consistent with the distribution phase Alphractal’s model identifies. Distribution does not require a sudden crash. It proceeds through sustained, gradual reduction of exposure by large holders while price maintains a deceptively stable appearance.
Bullish and Bearish Scenarios
Bullish Scenario — Fractal Invalidation at $95,000+
If Bitcoin reclaims and sustains a monthly close above $95,000 — materially above the October 2025 peak reference level — the fractal model’s phase mapping would be invalidated. A new markup leg would be confirmed, and the distribution label would need to be reassigned to the current consolidation zone. In that scenario, prior cycle logic would project continuation toward the $120,000–$150,000 range before a true distribution top is set. The key condition is a sustained monthly close, not an intraday spike.
Bearish Scenario — Loss of $78,000 Accelerates the Bear Timeline
Loss of the $78,000 level on a weekly closing basis would eliminate the final structural support above the $60,000–$70,000 projected bottom zone. At that point, the fractal timeline would be running as modeled, with the October 2026 bottom date still the projected trough. A sustained breakdown below $78,000 would set up a measured move targeting the $60,000 floor — representing approximately -28% downside from current levels.
What the Model Says — And What It Doesn’t
The Alphractal fractal is a temporal and structural model, not a deterministic price prediction. It identifies where Bitcoin sits within a repeating cycle architecture and projects the approximate timing and zone of the next major low. It does not specify the exact bottom price to the dollar, nor does it account for macro shocks — regulatory developments, ETF flow reversals, or Fed policy pivots — that could accelerate or delay the projected timeline.
What it does confirm with documented historical consistency across three prior cycles: Bitcoin’s four-phase structure has repeated with striking regularity over 13 years, and the current phase mapping places the asset in distribution — not markup. That framing carries direct implications for risk management at current levels.
The hourglass signal from Alphractal is not decorative. It is a framework-consistent warning that the window for distribution-phase positioning is narrowing, and the bear market’s more acute downside phase may be approaching. Watch $78,000 on weekly closes as the near-term line between managed distribution and accelerated decline — and watch $95,000 on monthly closes as the level that would force a complete reassessment of the fractal’s phase labels.
Source: x.comFrequently Asked Questions
What is a 4-year repetition fractal cycle in Bitcoin analysis?
When does Alphractal project the Bitcoin bear market bottom?
What price level would invalidate the bearish fractal model?
What is the immediate downside risk if Bitcoin loses $78,000?
Source: Alphractal · Published by CoinsProbe Markets Desk
The opinions and market insights shared on CoinsProbe represent the views of individual authors based on prevailing market conditions at the time of publication. Cryptocurrency investments carry significant risk and volatility. Readers are encouraged to conduct their own research and seek professional financial advice before making investment decisions. CoinsProbe and its contributors do not accept responsibility for financial losses or decisions made based on published content.
CoinsProbe may publish sponsored articles, affiliate links, or promotional collaborations. All sponsored material is clearly labeled to maintain transparency with our audience. Our editorial decisions remain fully independent, and advertising partnerships do not influence reviews, rankings, or published opinions.
Since 2023, CoinsProbe has delivered reliable insights on cryptocurrency, blockchain, and digital assets. Our content is created by experienced researchers and analysts who follow strict editorial standards focused on accuracy, transparency, and credibility. Every article is carefully reviewed and verified using trusted sources and current market data. We provide unbiased analysis and timely updates covering everything from emerging crypto projects to major industry developments.