- Bitcoin holds $83K–$84K as 3,326 BTC (~$276M) exits Bitget in 60 minutes after withdrawal reopening
- Single-hour outflow equals ~12 days of normal Bitget daily BTC withdrawals, per @IT_Tech_PL via CryptoQuant
- Price reaction: flat — demand absorption at $83K–$84K absorbs full distressed sell event without breakdown
- Key levels: $82K invalidation (bearish) vs. $87K–$87.5K resistance (bull confirmation target)
Bitcoin is trading at approximately $83,203 — down just 0.10% over the past 24 hours — with a market capitalization of $1.67 trillion. That near-flat performance is the story. Not because nothing happened, but because something extraordinary happened and the price barely flinched.
On-chain analyst @IT_Tech_PL, writing via CryptoQuant, put it plainly: “In the first hour, 3,326 BTC (~$276M) left the exchange… That first hour alone moved about 12 days’ worth of normal outflows. Price barely moved and held 83–84K.” That is not a routine data point. It is a structural signal about who is absorbing supply right now.
What Happened — The Bitget Withdrawal Event
Bitget reopened BTC withdrawals following the exchange’s $388 million hack that forced a temporary suspension. The moment the gates opened, pent-up withdrawal demand was released in a single compressed burst.
The numbers: 3,326 BTC — approximately $276 million at current prices — left Bitget in the first 60 minutes after reopening. To put that in context, @IT_Tech_PL’s data shows that this single hour represented roughly 12 days’ worth of normal daily outflow from the exchange, compressed into one window.
| Metric | Value |
|---|---|
| BTC withdrawn (1 hour) | 3,326 BTC (~$276M) |
| Normal daily outflow (estimate) | ~277 BTC/day |
| Compression factor | ~12× normal daily outflow |
| BTC price during event | $83,000–$84,000 |
| Price reaction | Essentially flat |
Source: @IT_Tech_PL via CryptoQuant
Under normal market conditions, a forced exit of this scale — concentrated into a single hour — would be expected to generate meaningful sell-side pressure on spot markets. Holders withdrawing from an exchange that just suffered a $388M exploit are, rationally, motivated sellers. The fact that Bitcoin absorbed every dollar of that potential supply without breaking $83K is the signal.
Why Price Resilience During Forced Selling Matters
This is not about Bitget specifically. It is about what the price response reveals about the current demand structure underneath Bitcoin.
When a large, concentrated outflow event — driven by fear, not conviction — fails to suppress price, the market is communicating that buy-side liquidity at this level is deep enough to absorb distressed selling. This is the mechanical definition of accumulation: sellers exist, buyers match them, and price does not clear lower.
CryptoQuant’s chart for the August 30–September 29 window shows the September 28–29 withdrawal spike as the single largest outflow event on the 30-day chart — a vertical green bar with no comparable precedent in the prior month. Bitcoin’s price line across that same window holds $83K–$84K without a meaningful breakdown.
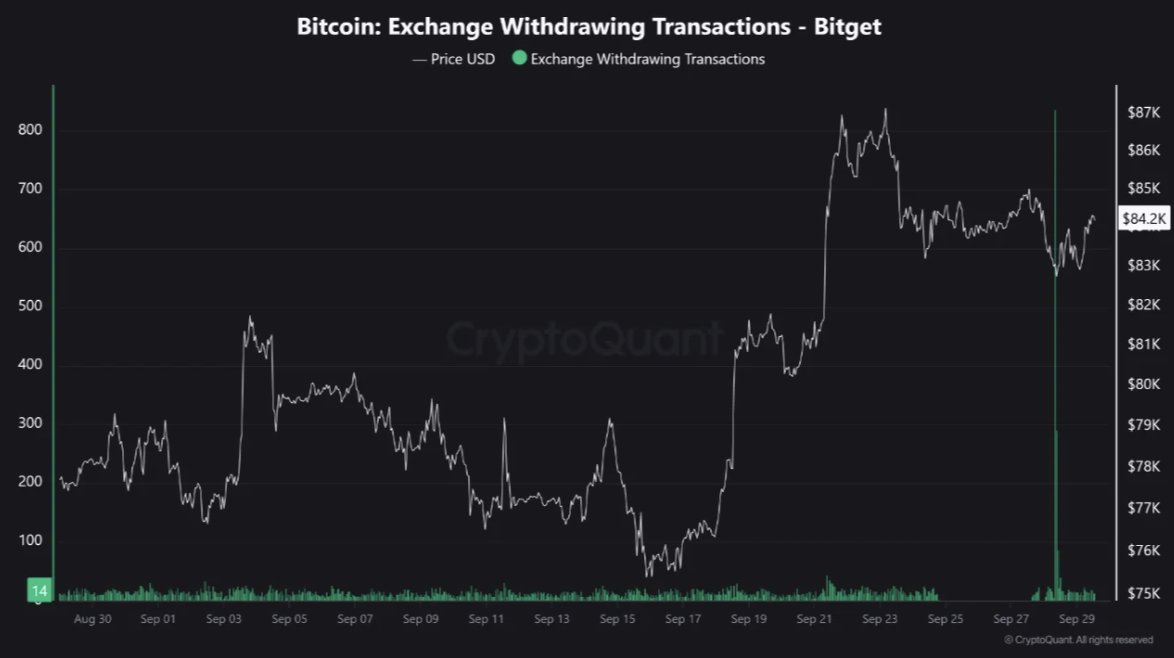
Bitcoin Exchange Withdrawals — Bitget | Aug 30–Sep 29 | Source: @cryptoquant_com (X)
The prior context matters here too. The Bitget hacker moved $351.6M — swapping ETH for BTC via THORChain — creating a separate but related supply-side event in the weeks prior. Bitcoin absorbed that as well. Two significant forced supply events. Price is still above $83K.
The Key Levels — Support, Resistance, and Invalidation
Per the CryptoQuant chart analysis, three levels define the current structure:
- $83K–$84K — Current support zone. This is where price held during the withdrawal event. Holding here is the baseline bull case.
- $82K — Invalidation. A sustained close below $82K would signal that the demand absorption documented above was not sufficient to maintain the trend. This is the level to watch for regime change.
- $87K–$87.5K — Resistance, per the late-September chart peak. Reclaiming this zone on volume would confirm the accumulation thesis and open the next leg.
Bullish Scenario — Hold Above $83K
Bitcoin continues to hold $83K–$84K as support. The demand absorption documented in the withdrawal event proves durable. Price grinds toward $87K–$87.5K resistance. A weekly close above $87.5K would be the first confirmation that the post-hack supply overhang has been fully cleared and the market is structurally ready for expansion.
Bearish Scenario — Break Below $82K
A clean daily close below $82K would indicate the demand that absorbed the Bitget outflow was short-term arbitrage rather than structural accumulation. In that scenario, mid-September’s $76K–$77K low becomes the next logical support test — a roughly 8–9% drawdown from current levels. This outcome would require a re-evaluation of the accumulation thesis entirely.
What This Is — And What It Isn’t
This is not a guarantee of upside. One hour of price resilience does not define a bull market. What it does confirm, with precision, is that at $83K–$84K, there exists sufficient buy-side demand to absorb 3,326 BTC of concentrated selling without price dislocation. That is a measurable, documented fact — not an interpretation.
The Bitget situation also carries an important caveat: withdrawal events from hacked exchanges are structurally different from normal exchange outflows. Users withdrawing post-hack may move coins to cold storage rather than sell immediately. The full impact on spot supply may be lagged. However, the price response — or lack thereof — is real-time and unambiguous.
Bitcoin’s $276M absorption test returned a passing grade. The market printed it in one hour at $83K–$84K. Whether the demand that absorbed that supply sustains at these levels is the only question that matters now. Watch $82K as the invalidation line and $87.5K as the confirmation target. One of those levels will answer the question.
Frequently Asked Questions
Why did Bitget users withdraw so much BTC in one hour?
Does a large exchange outflow mean Bitcoin’s price will drop?
What price level would invalidate Bitcoin’s current accumulation thesis?
What is the upside target if Bitcoin holds $83K–$84K support?
Source: CryptoQuant · Published by CoinsProbe Markets Desk
The opinions and market insights shared on CoinsProbe represent the views of individual authors based on prevailing market conditions at the time of publication. Cryptocurrency investments carry significant risk and volatility. Readers are encouraged to conduct their own research and seek professional financial advice before making investment decisions. CoinsProbe and its contributors do not accept responsibility for financial losses or decisions made based on published content.
CoinsProbe may publish sponsored articles, affiliate links, or promotional collaborations. All sponsored material is clearly labeled to maintain transparency with our audience. Our editorial decisions remain fully independent, and advertising partnerships do not influence reviews, rankings, or published opinions.
Since 2023, CoinsProbe has delivered reliable insights on cryptocurrency, blockchain, and digital assets. Our content is created by experienced researchers and analysts who follow strict editorial standards focused on accuracy, transparency, and credibility. Every article is carefully reviewed and verified using trusted sources and current market data. We provide unbiased analysis and timely updates covering everything from emerging crypto projects to major industry developments.