- Bitcoin trades at $80,351 (+0.30% 24h) as CryptoQuant's @TraderGemin flags the Trader Realized Price rising again
- Historically, the Trader Realized Price has acted as dynamic support during bull-phase BTC corrections — per @TraderGemin via CryptoQuant
- U.S. spot ETFs logged a $635.5M single-day outflow on Oct 22 (IBIT: -$110.3M), per SoSoValue — a macro test of support may be near
- Core PCE and FOMC due Oct 28 with 90.6% rate-hold probability — key macro events that could trigger a correction toward the on-chain support level
Bitcoin is trading at $80,351 — up 0.30% in the past 24 hours, with a market cap of approximately $1.61 trillion — and a specific on-chain metric is now drawing institutional attention: the Trader Realized Price is rising again, and its historical behavior during bull market corrections makes it one of the most important levels to track if BTC pulls back from here.
The signal comes from @TraderGemin, a contributor at CryptoQuant, who published the observation via the platform’s official channel on October 26, 2026. His exact conclusion: “Historically, during bullish phases, this realized price has often acted as support when BTC corrected toward it.” The framing is conditional — support if BTC corrects, not a price target or purchase signal — but the pattern behind it is grounded in on-chain data spanning multiple cycles.
What the Trader Realized Price Actually Measures
The Trader Realized Price is not a technical indicator drawn from candlestick data. It is an on-chain metric derived from the average acquisition cost of short-to-medium-term Bitcoin holders — market participants who are actively trading rather than holding long-term. Unlike the broader Realized Price (which weights all coins ever moved), the Trader Realized Price isolates the cohort most likely to react to price changes, making it a live pulse of active-market cost basis.
When Bitcoin trades above this line, active traders are in aggregate profit — reducing sell pressure. When price dips toward it during a bull phase, it historically marks the zone where profit margins compress, traders reassess, and demand reappears. That is the mechanism behind @TraderGemin’s observation: not that the line is magic, but that it represents real-money cost basis for the most reactive participants in the market.
What the Chart Shows — Pattern Still Forming
The CryptoQuant chart shared by @cryptoquant_com covers Bitcoin’s price history from approximately mid-2019 through mid-2026. The Trader Realized Price (blue line) trends upward across the full timeframe — a rising dynamic support. Bitcoin’s price (white) oscillates above and below it cyclically, with an upper band (dotted orange) and max/min dashed lines forming an expanding channel around the blue line.
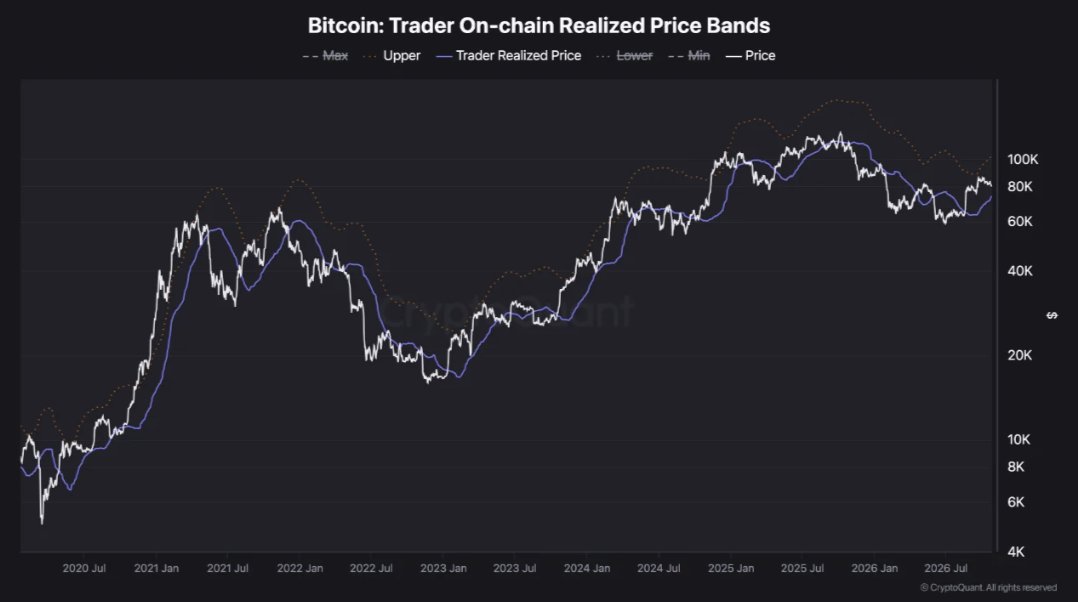
Critically, at the most recent data point visible on the chart, Bitcoin is above the Trader Realized Price (blue line) and below the upper band (dotted orange line). The pattern is still forming — no breakout above the upper band or breakdown below the realized price line has occurred. Price is currently in the middle zone of the channel, trending upward. The rising slope of the Trader Realized Price itself is the signal @TraderGemin flags: it is moving higher again, meaning any correction that brings BTC back toward it would find a cost-basis floor that is itself advancing — not static.
Historical Behavior — Bull Phase Corrections
The value of this metric is most visible across prior bull phases visible in the chart. Across multiple cycle corrections — 2020, 2021, and 2023 — Bitcoin’s price has dipped toward the Trader Realized Price line before recovering. Each instance where BTC corrected to the blue line during a confirmed bull phase was followed by a resumption of the uptrend. The line did not hold during macro bear markets (2018–2019, mid-2022), which is an important caveat: the Trader Realized Price functions as support only when the broader market structure is bullish. It is a contextual tool, not an unconditional floor.
@TraderGemin’s qualifier — “during bullish phases” — is not a hedge. It is a defining condition. The indicator’s support behavior is regime-dependent. In the current context, with Bitcoin above $80,000 and the Trader Realized Price trending upward, the regime condition appears satisfied — but that determination requires ongoing verification against broader on-chain structure.
ETF Flow Context — Institutional Signal Divergence
Against this on-chain backdrop, spot Bitcoin ETF flows present a mixed picture worth noting. On October 22, 2026, U.S. spot ETFs logged a single-day net outflow of $635.5M — the largest recent outflow — with IBIT alone seeing $110.3M exit and FBTC shedding $31.8M, per data via SoSoValue. Total ETF net assets remain substantial at $104.71B, with cumulative net inflows since launch at $57.32B.
The divergence is worth flagging: the four-day window surrounding that outflow also produced $442.7M in net inflows across three positive days, suggesting the $635.5M figure may reflect rotation or single-fund rebalancing rather than structural institutional exit. Strategy (MSTR) added 267 BTC for $22.1M in its latest purchase, bringing total holdings to 848,517 BTC — a data point that sits firmly in the long-term conviction column regardless of short-term ETF mechanics.
That said, a $635.5M daily outflow is not noise. If ETF redemptions persist in the days following this signal, the Trader Realized Price support may face a more acute test than @TraderGemin’s base case anticipates. For context on Bitcoin’s broader technical structure at current levels, see our earlier analysis: Bitcoin Channel Breakdown — $82K Resistance, $72.5K Buy Zone: Analyst.
Macro Events This Week
The timing of this on-chain signal coincides with a dense macro calendar. Core PCE Price Index (MoM and YoY) and GDP (QoQ) data are due on October 28, the same day as the FOMC meeting where markets currently price a 90.6% probability of holding rates at 3.75%–4.00%, per SoSoValue. A surprise in either direction — an upside GDP print or a hotter PCE — could trigger the very BTC correction that would test the Trader Realized Price. The December 9 FOMC carries a 72.4% probability of moving to 4.00%–4.25%, meaning the rate path beyond October is not settled. These macro variables are the most likely near-term trigger for a test of the on-chain support @TraderGemin identifies.
Bullish Scenario
Bitcoin holds above the rising Trader Realized Price on any correction and resumes the uptrend toward the upper band (dotted orange) visible in the CryptoQuant chart. ETF inflows return to the three-day positive trend seen in the $442.7M rolling window, confirming institutional demand absorbs macro-driven selling. The pattern resolves to the upside within the expanding channel.
Bearish Scenario
A macro shock — hotter-than-expected Core PCE or GDP surprise on October 28 — drives BTC through the Trader Realized Price with sustained daily closes below it. @TraderGemin’s own framework conditions support on a bullish phase being intact; a breakdown below the blue line would invalidate that regime read and open the door to deeper correction toward lower realized price bands visible on the chart. Continued ETF outflows beyond the $635.5M single-day print would amplify this risk.
The Trader Realized Price is one tool among many. For a broader view of where altcoin risk sits in the current environment, see: AI Agent Altcoins Losing Momentum — VVV, TRAC, and ARC Face Key Breakdown Levels.
Bitcoin’s Trader Realized Price is rising, BTC is above it, and the historical pattern across bull-phase corrections is consistent: the line has repeatedly absorbed selling pressure when price pulled back toward it during confirmed uptrends. @TraderGemin’s signal from CryptoQuant is conditional — “during bullish phases” — and that condition must remain in force for the support to be meaningful. With $635.5M in single-day ETF outflows logged October 22 and Core PCE plus FOMC due October 28, the test of this support may arrive sooner than the chart’s current calm suggests. The level to watch is the Trader Realized Price itself — its exact value is visible on the CryptoQuant chart and advances with each passing session.
Frequently Asked Questions
What is the Bitcoin Trader Realized Price and how is it different from the standard Realized Price?
Does the Trader Realized Price always hold as support for Bitcoin?
What macro events could trigger Bitcoin to test the Trader Realized Price this week?
How do the $635.5M ETF outflows on October 22 affect the on-chain support signal?
Source: CryptoQuant · Published by CoinsProbe Markets Desk
The opinions and market insights shared on CoinsProbe represent the views of individual authors based on prevailing market conditions at the time of publication. Cryptocurrency investments carry significant risk and volatility. Readers are encouraged to conduct their own research and seek professional financial advice before making investment decisions. CoinsProbe and its contributors do not accept responsibility for financial losses or decisions made based on published content.
CoinsProbe may publish sponsored articles, affiliate links, or promotional collaborations. All sponsored material is clearly labeled to maintain transparency with our audience. Our editorial decisions remain fully independent, and advertising partnerships do not influence reviews, rankings, or published opinions.
Since 2023, CoinsProbe has delivered reliable insights on cryptocurrency, blockchain, and digital assets. Our content is created by experienced researchers and analysts who follow strict editorial standards focused on accuracy, transparency, and credibility. Every article is carefully reviewed and verified using trusted sources and current market data. We provide unbiased analysis and timely updates covering everything from emerging crypto projects to major industry developments.