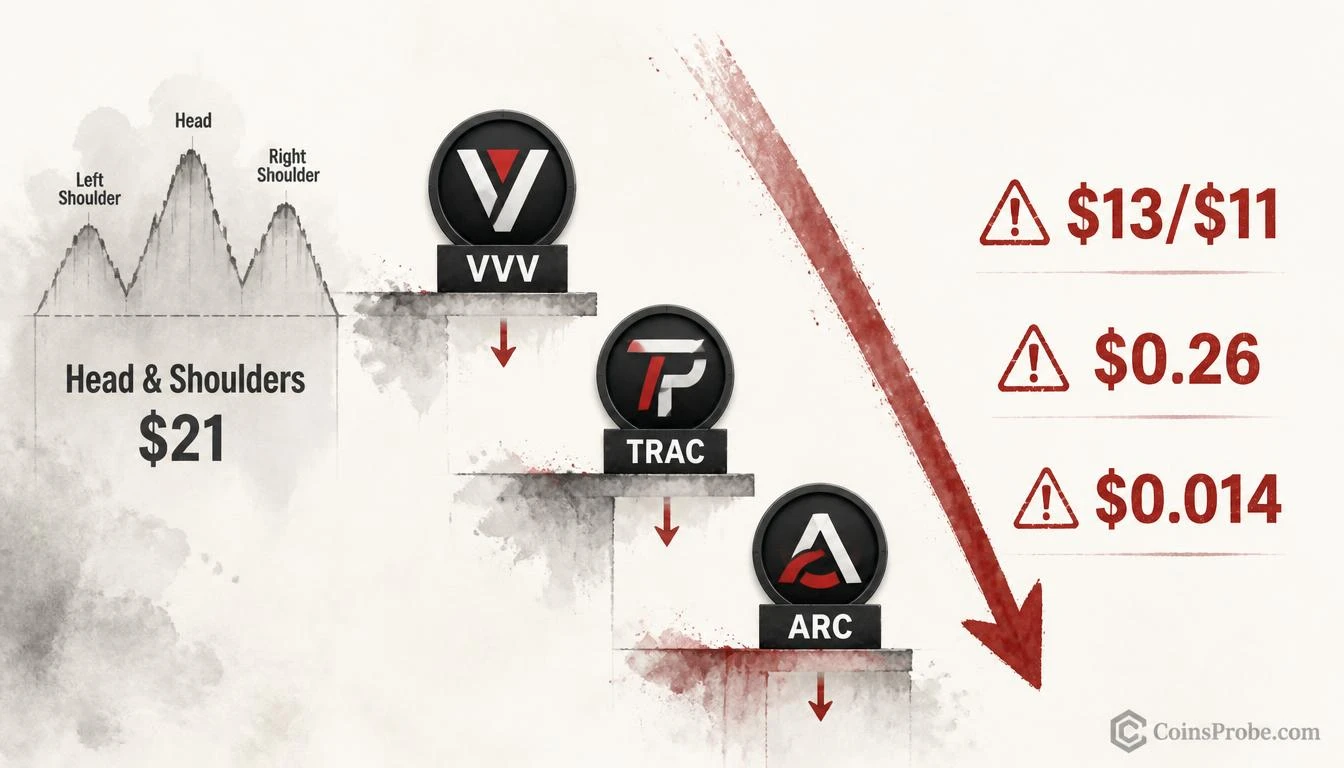

- VVV prints head-and-shoulders with neckline at $21 — 4H close below targets $13 or $11 (-38% to -48%)
- TRAC descending triangle compresses toward $0.38 support — 4H close below targets $0.26 (-32%)
- ARC channel rejection at $0.060 risks return to $0.030 — daily close below opens $0.014–$0.0075 (-53% to -75%)
- Analyst Ali Martinez (@alicharts) flags coordinated momentum loss across AI agent altcoin sector
The AI agent altcoin sector is flashing coordinated warning signals. Across three tokens — VVV, TRAC, and ARC — chart patterns are deteriorating simultaneously, and the levels separating a controlled pullback from a sharp sell-off are well-defined. This is not sector-wide noise. It is a specific, pattern-driven setup with named invalidation levels and named targets for each asset.
Crypto analyst Ali Martinez (@alicharts) flagged the developing deterioration across all three tokens in a detailed thread on October 24, 2026 — warning that “AI agent altcoins are in big trouble” and outlining the price levels that would confirm the next leg lower. The analysis covers distinct timeframes and pattern types for each token, making the combined picture one of the more rigorous multi-asset breakdowns in the AI altcoin space right now. Our prior coverage of the early warning signs is here: AI Agent Altcoins in Trouble: VVV, TRAC, and ARC Flash Warning Signals.
VVV — Head-and-Shoulders Neckline at $21
VVV is printing one of the most classically bearish reversal patterns in technical analysis: a head-and-shoulders formation with the neckline sitting at approximately $21. Martinez identifies a 4H close below $21 as the confirmation trigger — not an intraday wick, not a touch, but a sustained four-hour close beneath that level.
A head-and-shoulders pattern identifies a three-peak structure where the middle peak (head) exceeds the two surrounding peaks (shoulders), with the neckline connecting the lows between those peaks. When price closes below the neckline, it signals that buyers who supported the prior rally have been exhausted — and the pattern projects a downside move roughly equal to the distance from head to neckline.
If the 4H close below $21 confirms, Martinez’s targets are $13 or $11 — representing a decline of approximately 38% to 48% from the neckline. The $11 level constitutes the more extended target if selling pressure accelerates through the initial $13 zone.
Bullish Scenario
VVV holds the $21 neckline on a 4H closing basis. No confirmation of the head-and-shoulders reversal occurs. Price stabilizes above the pattern and AI agent sector sentiment recovers, opening a retest of the right shoulder highs.
Bearish Scenario
A 4H close below $21 confirms the head-and-shoulders reversal. Initial target is $13, with $11 as the extended target if the first support level fails to hold — a 38%–48% drawdown from the breakdown level.
TRAC — Descending Triangle with Support at $0.38
TRAC is forming a descending triangle, a pattern defined by a flat support base and a series of declining highs compressing price toward a forced resolution. The flat floor of the triangle sits at approximately $0.38. Martinez’s trigger, again, requires a 4H close below $0.38 — the same confirmation methodology applied to VVV, prioritizing sustained closes over intraday noise.
Descending triangles are inherently bearish in structure: each rally attempt reaches a lower high, indicating that sellers are progressively more aggressive while buyers exhaust themselves defending the same flat level. When that flat level finally breaks on a closing basis, there is typically no remaining technical support from the pattern itself.
A confirmed 4H close below $0.38 projects TRAC toward $0.26 — a decline of approximately 32% from the support level, and a more severe percentage loss from any entry above the current support zone.
Bullish Scenario
TRAC defends $0.38 on a 4H closing basis. The descending triangle resolves with a breakout to the upside, invalidating the bearish compression and opening a move back toward the pattern’s declining resistance line.
Bearish Scenario
A 4H close below $0.38 confirms descending triangle breakdown. Target is $0.26, a 32% drop from the support level — consistent with the measured move projection of the triangle’s height.
ARC — Channel Rejection Between $0.030 and $0.060
ARC is operating within a defined price channel that has bounded price between $0.030 and $0.060. The token recently bounced from the channel floor at $0.030 toward the upper boundary at $0.060 — and Martinez is watching for rejection at that upper zone.
A rejection at $0.060 without a sustained breakout would send ARC back to the channel floor at $0.030. That in itself is a 50% round-trip from the top of the range. But the more consequential level is below the channel entirely: Martinez notes that a daily close below $0.030 would open downside to $0.014 or $0.0075 — representing a decline of 53% to 75% from the channel floor.
The distinction in timeframe matters here. While VVV and TRAC use 4H closing confirmations, ARC’s breakdown trigger is a daily close below $0.030 — a higher bar for confirmation, appropriate given the more extreme percentage targets below.
Bullish Scenario
ARC holds the channel floor at $0.030 on a daily closing basis. The token consolidates within the $0.030–$0.060 range before eventually breaking higher, invalidating the bearish channel structure.
Bearish Scenario
A daily close below $0.030 confirms a channel breakdown. First target is $0.014, extended target is $0.0075 — a 53% to 75% decline from the breakdown level. This is the most aggressive downside scenario across the three tokens in Martinez’s analysis.
Three Patterns, One Sector Warning
What makes Martinez’s analysis structurally significant is not any single pattern — it is the simultaneous deterioration across three distinct AI agent tokens using three distinct pattern types: a reversal pattern (VVV), a compression pattern (TRAC), and a channel test (ARC). Three different structures arriving at the same conclusion — momentum in AI agent altcoins is exhausted, and the next directional resolution is likely lower.
None of the three tokens have broken their respective confirmation levels yet as of the time of this writing. That is the critical detail. The patterns are warning signals, not completed breakdowns. Each requires a specific close — 4H for VVV and TRAC, daily for ARC — before the bearish thesis is technically confirmed. Traders watching this sector should treat $21 (VVV), $0.38 (TRAC), and $0.030 (ARC) as the exact lines separating a contained technical setup from an accelerating sell-off.
For broader context on demand dynamics in the altcoin sector amid the current macro backdrop, see also: SUI ETF Inflows: Five Weeks of Demand — What the Data Actually Shows.
The AI agent narrative attracted significant capital inflows during its 2025–2026 expansion phase. But narratives do not override technical structure. VVV at $21, TRAC at $0.38, and ARC at $0.030 are the three levels that will determine whether the sector consolidates or capitulates. Watch those closes.
Source: x.comFrequently Asked Questions
What confirmation is required before VVV’s head-and-shoulders breakdown is valid?
Why does ARC use a daily close confirmation instead of a 4H close like VVV and TRAC?
Have VVV, TRAC, or ARC already broken their key support levels?
What does a descending triangle signal for TRAC’s price outlook?
Source: Ali Charts · Published by CoinsProbe Markets Desk
The opinions and market insights shared on CoinsProbe represent the views of individual authors based on prevailing market conditions at the time of publication. Cryptocurrency investments carry significant risk and volatility. Readers are encouraged to conduct their own research and seek professional financial advice before making investment decisions. CoinsProbe and its contributors do not accept responsibility for financial losses or decisions made based on published content.
CoinsProbe may publish sponsored articles, affiliate links, or promotional collaborations. All sponsored material is clearly labeled to maintain transparency with our audience. Our editorial decisions remain fully independent, and advertising partnerships do not influence reviews, rankings, or published opinions.
Since 2023, CoinsProbe has delivered reliable insights on cryptocurrency, blockchain, and digital assets. Our content is created by experienced researchers and analysts who follow strict editorial standards focused on accuracy, transparency, and credibility. Every article is carefully reviewed and verified using trusted sources and current market data. We provide unbiased analysis and timely updates covering everything from emerging crypto projects to major industry developments.