
- Bitcoin trades at $61,623 — down 2.63% — as Buy/Sell Pressure Delta breaks below zero per Alphractal
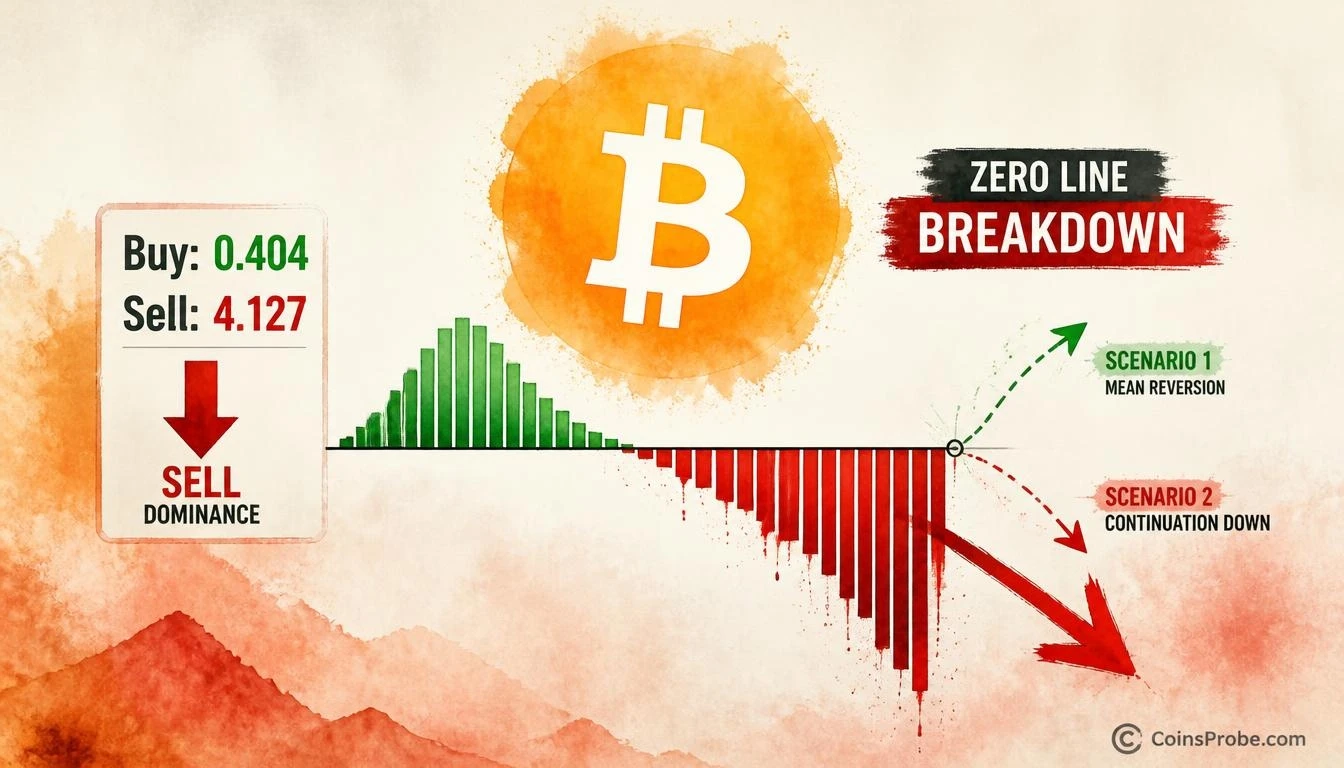
- Sell reading at 4.127 vs buy reading of 0.404; delta structure has crossed the critical zero baseline
- Alphractal flags two historical outcomes: selling accelerates into further downside, or brief bottom forms — monitor 4H and 12H for early reversal
Bitcoin is trading at $61,623 — down 2.63% in the past 24 hours, with a market cap of approximately $1.24 trillion. The move lower arrives with a pointed on-chain warning: the Buy/Sell Pressure Delta has crossed below zero, with sell pressure now visibly overtaking buying activity. The chart confirmation is unambiguous — this is not an approaching signal, it is a confirmed breakdown of the delta below the zero baseline.
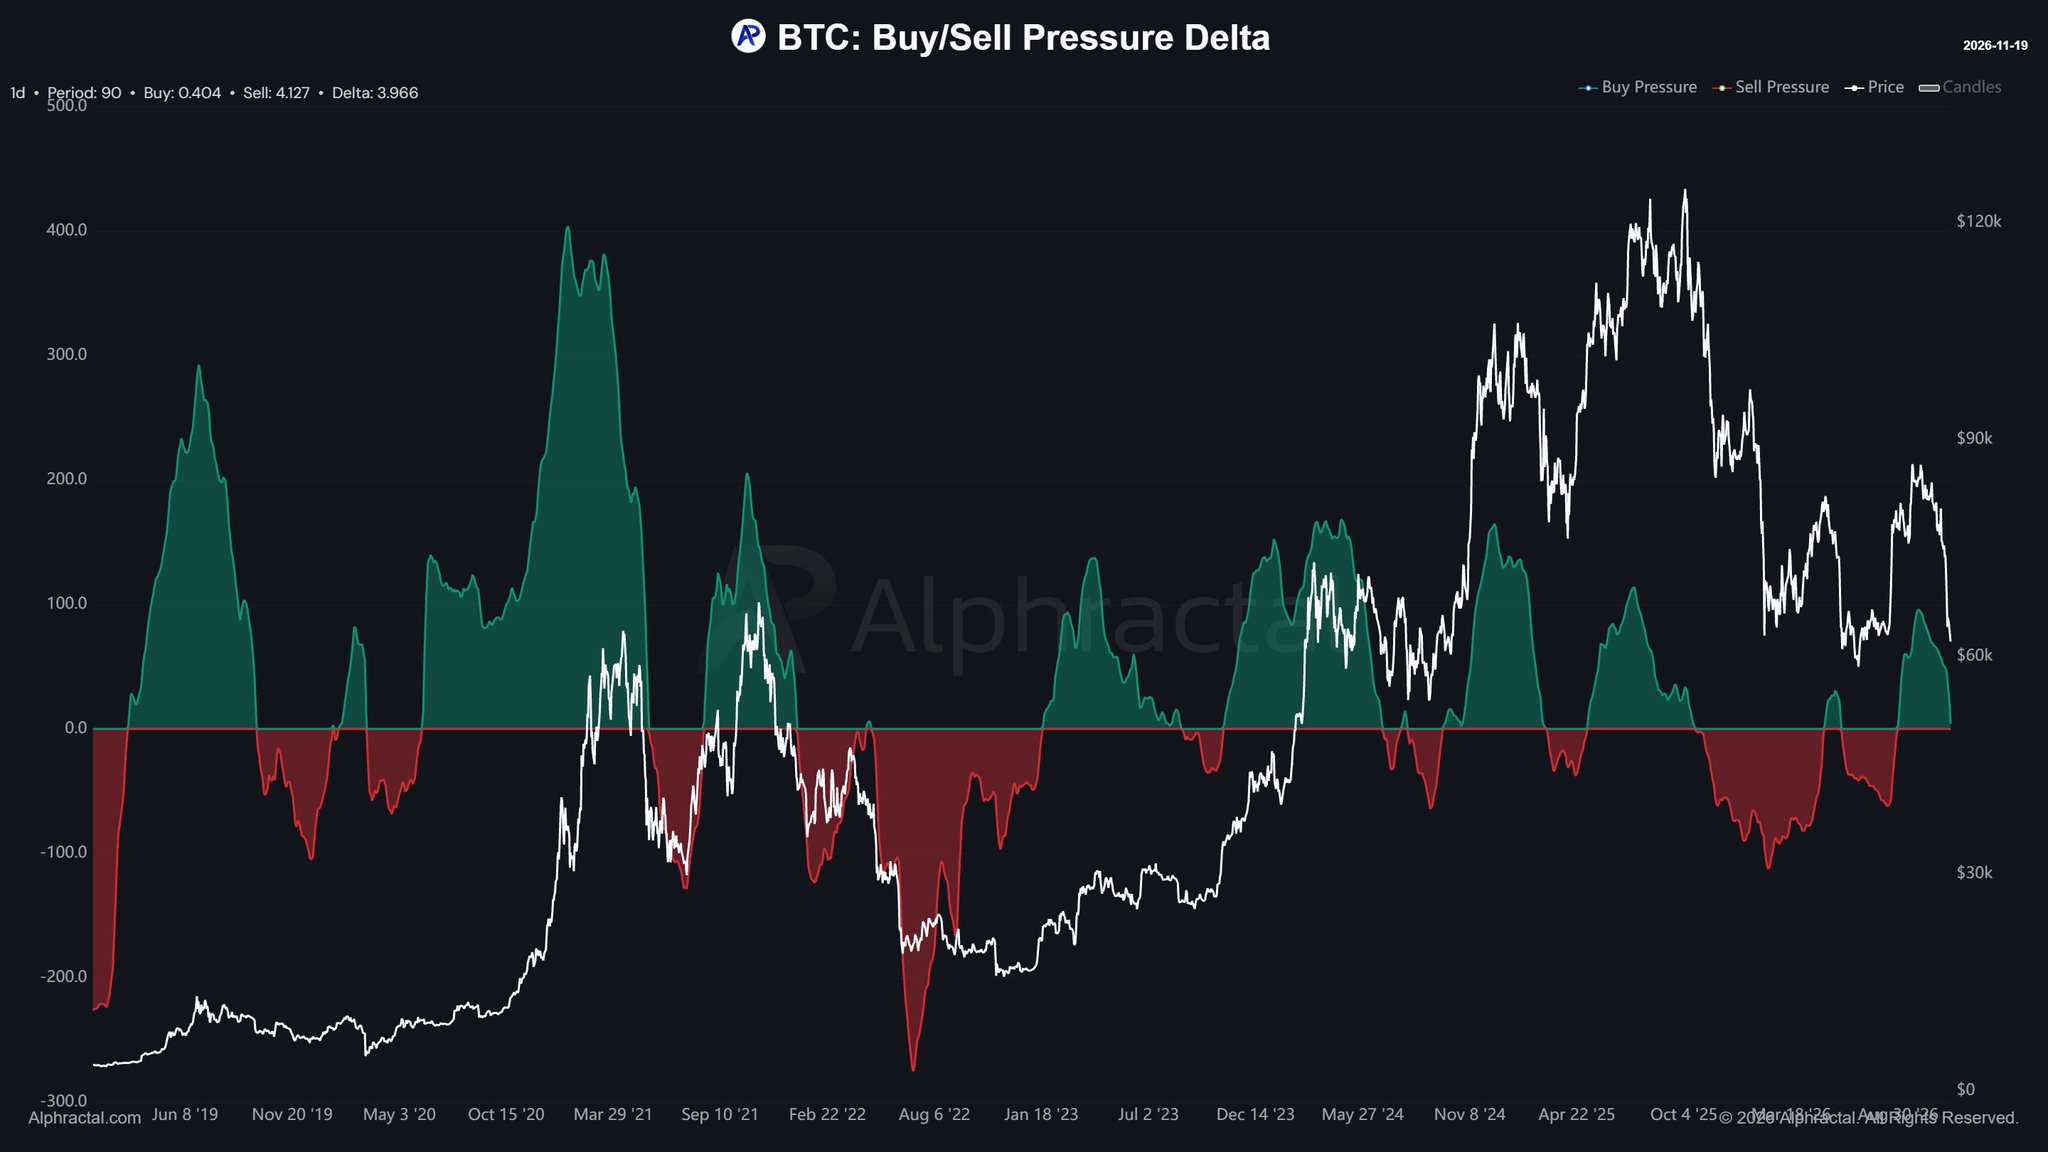
The Alphractal team (@Alphractal) flagged the development across their platform, noting that “selling pressure has intensified over the past few weeks, gradually overtaking buying pressure.” Their chart — spanning a daily timeframe from June 2019 through late 2026 — shows the green buy pressure area collapsing toward zero while the red sell pressure zone has deepened below the baseline in the most recent bars. The header metrics at the time of publication read: Buy: 0.404 · Sell: 4.127 · Delta: 3.966 — with the delta structure at the critical zero line threshold that has historically preceded either capitulation or stabilization.
What the Buy/Sell Pressure Delta Actually Measures
The Buy/Sell Pressure Delta is an Alphractal-native metric that quantifies the net dominance of buying versus selling activity over a rolling 90-period window on the daily chart. When the green (buy) area contracts toward zero and the red (sell) area expands below the baseline, it reflects a structural shift in market aggression — sellers are initiating trades more forcefully than buyers, a condition that persists until either capitulation exhausts sellers or fresh demand absorbs the pressure.
Critically, this is not an RSI-style bounded oscillator. It does not measure price momentum or overbought conditions. It measures the actual pressure dynamic between participants — which is why its zero-line crossings have historically corresponded to directional transitions, not merely short-term noise. The current reading — a confirmed breakdown below zero — mirrors patterns the chart displays preceding prior bear phases dating back to 2019.
Two Historical Scenarios When Delta Enters Negative Territory
Alphractal explicitly identifies two scenarios that have played out when this metric has entered negative territory historically. Neither is guaranteed, and the analyst’s framing is deliberately non-directional. The two scenarios:
Scenario 1 — Selling Accelerates: Negative delta acts as confirmation of an ongoing distribution phase. Sellers remain in control, volume stays skewed to the downside, and price enters a sustained drawdown. In this case, the delta crossing zero is not a bottom signal — it is the beginning of an intensification phase. The 2019 and 2022 bear phase segments visible on the Alphractal chart show extended periods where the red sell zone dominated, with price declining in parallel.
Scenario 2 — Potential Bottom Forms: The delta enters negative territory briefly as late sellers exhaust demand, then stabilizes. Rather than accelerating, sell pressure peaks and reverses — often producing a consolidation base before recovery. Alphractal specifically recommends monitoring the 4-hour and 12-hour timeframes for early reversal signals in this scenario, as shorter timeframes will show the pressure shift before the daily or weekly reading confirms it.
The analyst’s conclusion is explicit: the current outlook is bearish with sellers in control, but the timeframe and magnitude depend on which of these two historical paths the data follows. This is a framework, not a forecast — and that precision matters. As Alphractal notes, the approach is to “follow data, not narrative.”
Where Bitcoin Stands Structurally
At $61,623, Bitcoin has already surrendered the 200-day moving average in recent sessions — a level that, once lost, shifts the technical burden of proof entirely to buyers. That development, combined with the Buy/Sell Pressure Delta now confirmed in negative territory, presents a layered bearish alignment across both price-based and pressure-based indicators. For context on what that 200-day MA loss means structurally, see: Bitcoin Loses 200-Day MA — The 200-Week MA Is Now the Last Line.
The 24-hour trading volume stands at approximately $35.18 billion — elevated relative to recent sessions, suggesting that the selling activity is not passive. Active sellers are applying pressure at current levels, which is consistent with the delta breakdown Alphractal’s chart is registering.
What to Watch on Shorter Timeframes
Alphractal’s specific recommendation to monitor the 4H and 12H charts for early reversal signals is the most actionable takeaway from the analysis. If Scenario 2 is unfolding — a brief negative delta followed by stabilization — the first evidence will appear on shorter timeframes as buy pressure begins recovering. That means watch for the buy (green) area to re-expand on the 4H Alphractal chart, the sell area to contract from its current depth, and the delta to curl back toward zero from below.
None of those conditions are currently present. As of the latest data, the daily chart shows the breakdown confirmed and no visible short-term reversal forming. The sell pressure area has deepened, not leveled.
The delta has broken below zero. Sellers are in structural control. Whether this produces a brief washout and stabilization or an extended distribution phase depends on two things: whether short-term timeframes begin showing buy pressure recovery, and whether $61,623 holds as a base or gives way to continuation selling. Until the 4H and 12H delta charts show green pressure re-expanding, Alphractal’s framework places the probability weight firmly on Scenario 1. Watch the zero line — a sustained recovery above it would be the first quantitative evidence that Scenario 2 is in play.
Frequently Asked Questions
What is the Bitcoin Buy/Sell Pressure Delta and why does the zero line matter?
What are the two historical scenarios Alphractal identifies when delta turns negative?
What specific timeframes should traders monitor for early reversal signals?
Does a negative Buy/Sell Pressure Delta confirm a bear market for Bitcoin?
Source: Alphractal · Published by CoinsProbe Markets Desk
The opinions and market insights shared on CoinsProbe represent the views of individual authors based on prevailing market conditions at the time of publication. Cryptocurrency investments carry significant risk and volatility. Readers are encouraged to conduct their own research and seek professional financial advice before making investment decisions. CoinsProbe and its contributors do not accept responsibility for financial losses or decisions made based on published content.
CoinsProbe may publish sponsored articles, affiliate links, or promotional collaborations. All sponsored material is clearly labeled to maintain transparency with our audience. Our editorial decisions remain fully independent, and advertising partnerships do not influence reviews, rankings, or published opinions.
Since 2023, CoinsProbe has delivered reliable insights on cryptocurrency, blockchain, and digital assets. Our content is created by experienced researchers and analysts who follow strict editorial standards focused on accuracy, transparency, and credibility. Every article is carefully reviewed and verified using trusted sources and current market data. We provide unbiased analysis and timely updates covering everything from emerging crypto projects to major industry developments.