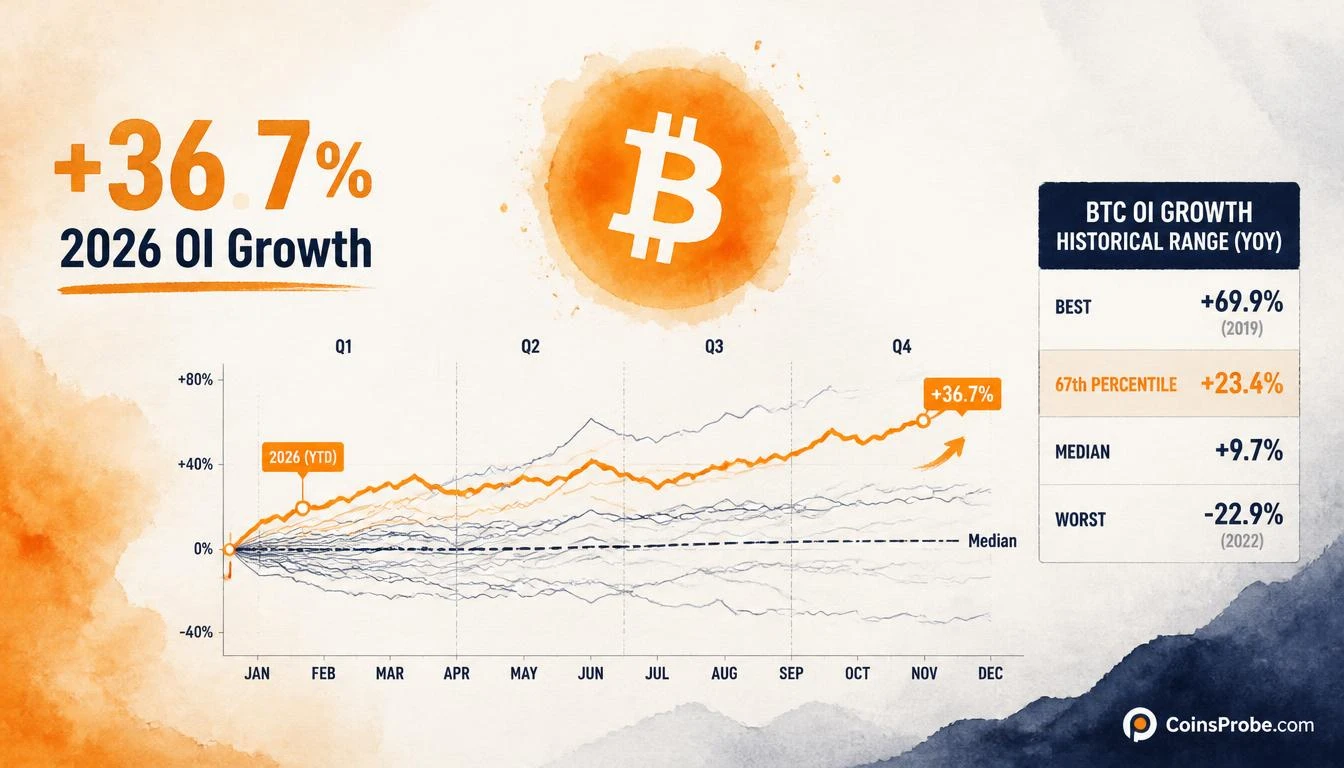

- Bitcoin OI in BTC terms rose +36.7% in 2026, above the 6-year historical median year-end reading of +26.4% per @Alphractal
- 2026 OI sits at the 67th percentile as of October 27th — above 4 of 6 comparable prior years with Q4 still open
- Most correlated prior year is 2025 (r=0.79), which finished at -12.5%; second-closest is 2022 (r=0.62), which finished at +69.9%
- Rising BTC-denominated OI confirms expanding derivatives positioning — direction of those positions remains unconfirmed
Bitcoin is trading at approximately $80,865 — up 1.45% in the past 24 hours — with a total market cap of $1.63 trillion. Beneath that price action, a structural derivatives signal is developing: Bitcoin’s Open Interest, measured in BTC-denominated terms, has already risen +36.7% in 2026, clearing the six-year historical median year-end change of +26.4% with the full fourth quarter still ahead.
The observation comes from Alphractal (@Alphractal), who published the analysis on October 27, 2026, alongside two comparative cycle charts. Their post notes that 2026 OI trajectory has already surpassed what most years finished at — and the year still has two months remaining. Alphractal is careful to flag that trajectory correlation does not equal outcome, and that rising OI amid uncertainty can signal expanding short positioning or elevated leverage as much as bullish conviction.
What Bitcoin’s OI-in-Coins Metric Actually Measures
Open Interest measured in BTC — not USD — strips out dollar price appreciation. When OI in BTC rises, it means the raw number of coins committed to open futures and perpetual contracts is expanding. This matters because a USD-denominated OI rise can be manufactured entirely by a price rally; a BTC-denominated OI rise cannot. It reflects actual growth in derivatives positioning at the network level.
The six-year dataset Alphractal tracks shows OI increased in 4 of the 6 prior years on this measure. The best year was 2022 at +69.9%. The worst was 2023 at -22.9%. The median finishing value across all six years is +26.4%.
2026 at the 67th Percentile — With Q4 Remaining
As of October 27th, 2026’s BTC-denominated OI growth stands at +36.7% — placing it at the 67th percentile of all six comparable years at this point on the calendar. That means 2026 is already tracking above roughly two-thirds of all prior full-year readings, and the year is not finished.
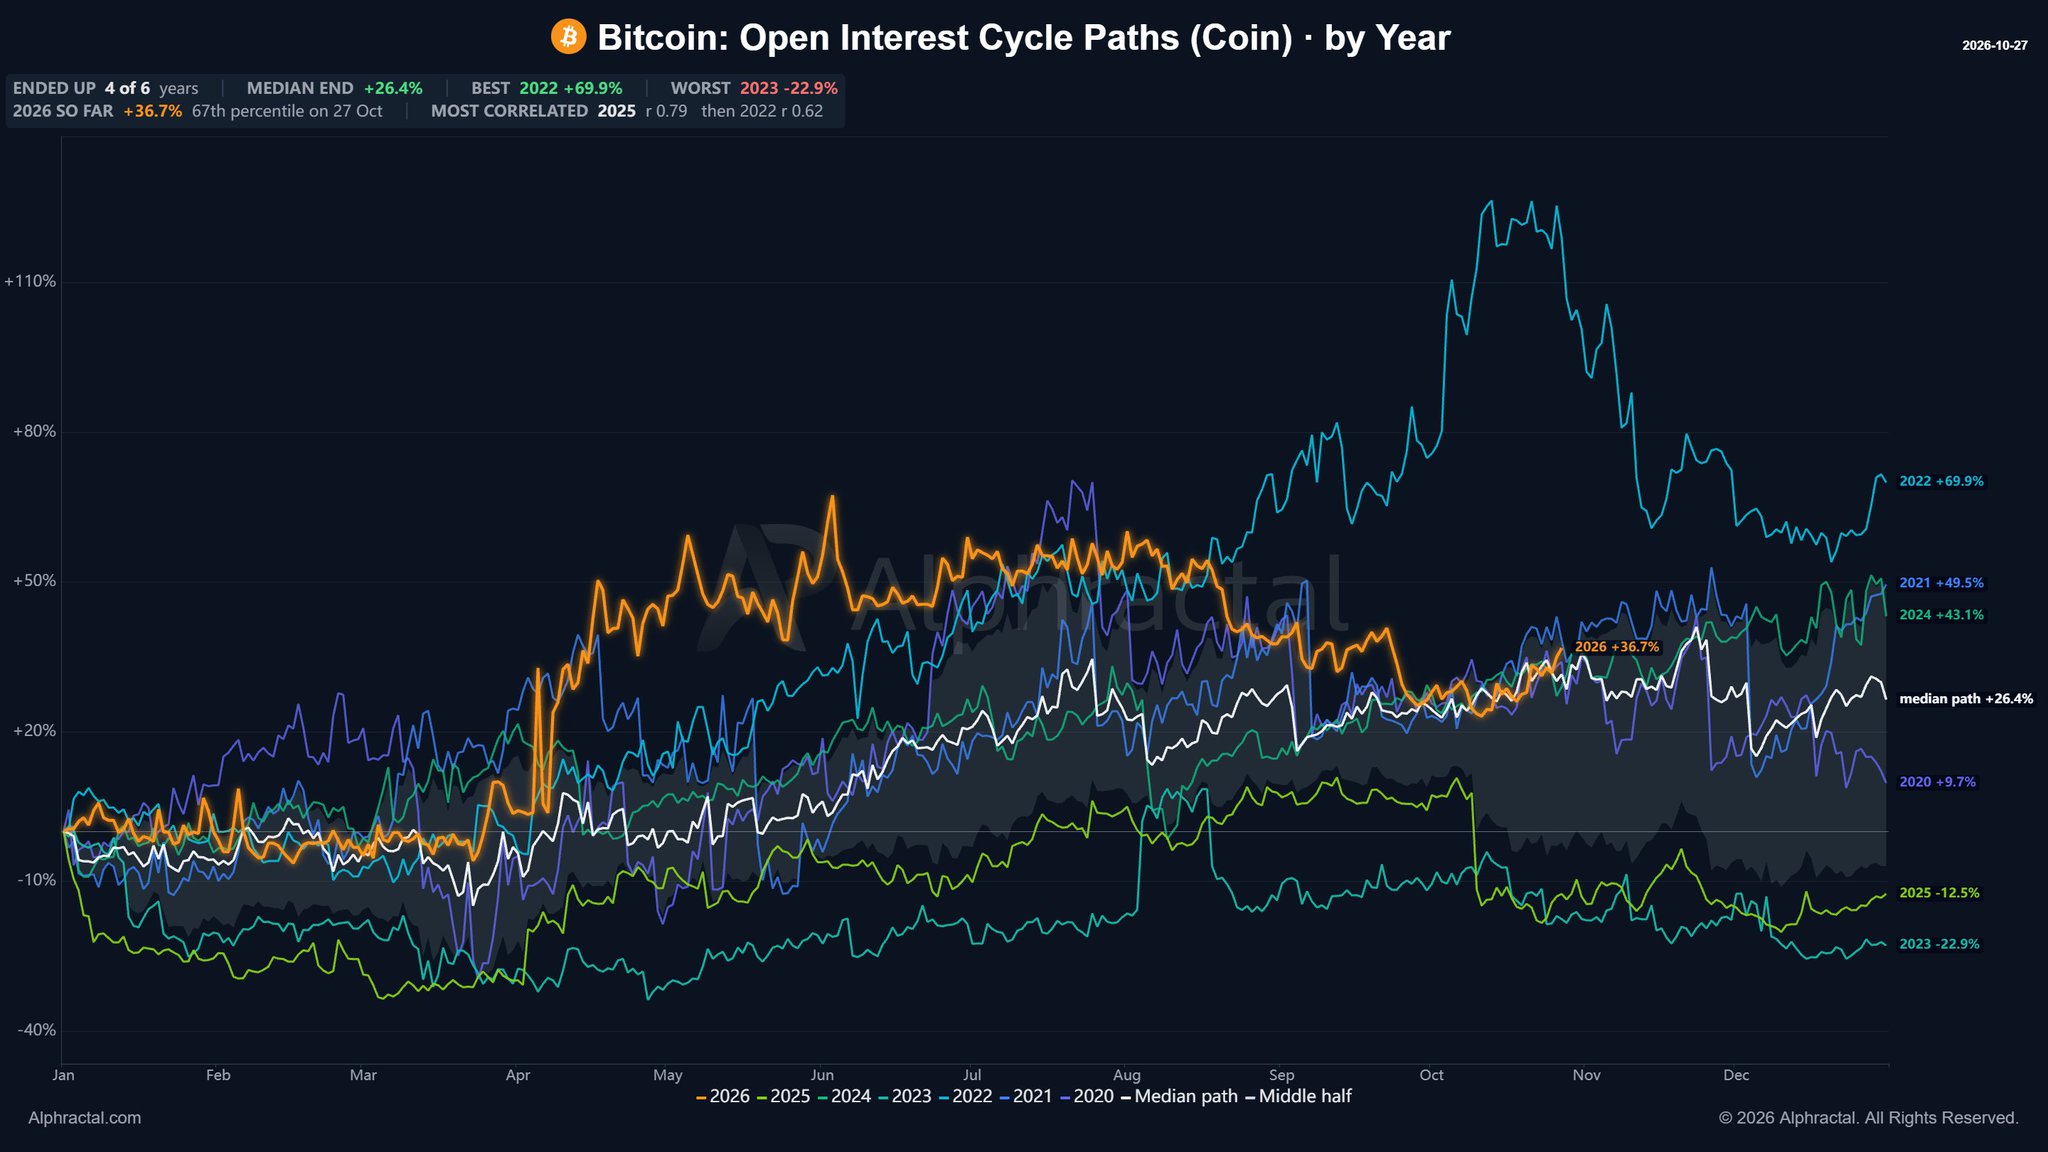
The two charts shared by Alphractal plot each year’s OI path from January through December as indexed lines diverging from a common starting point. The 2026 orange line surged sharply in the April window, consolidated through mid-year at an elevated level, then declined toward the median path before recovering upward into Q4. As of late October, the 2026 line sits clearly above the median path — +36.7% versus the historical median of +26.4% — confirming the breakout above average-year behavior is already in place, not merely projected.
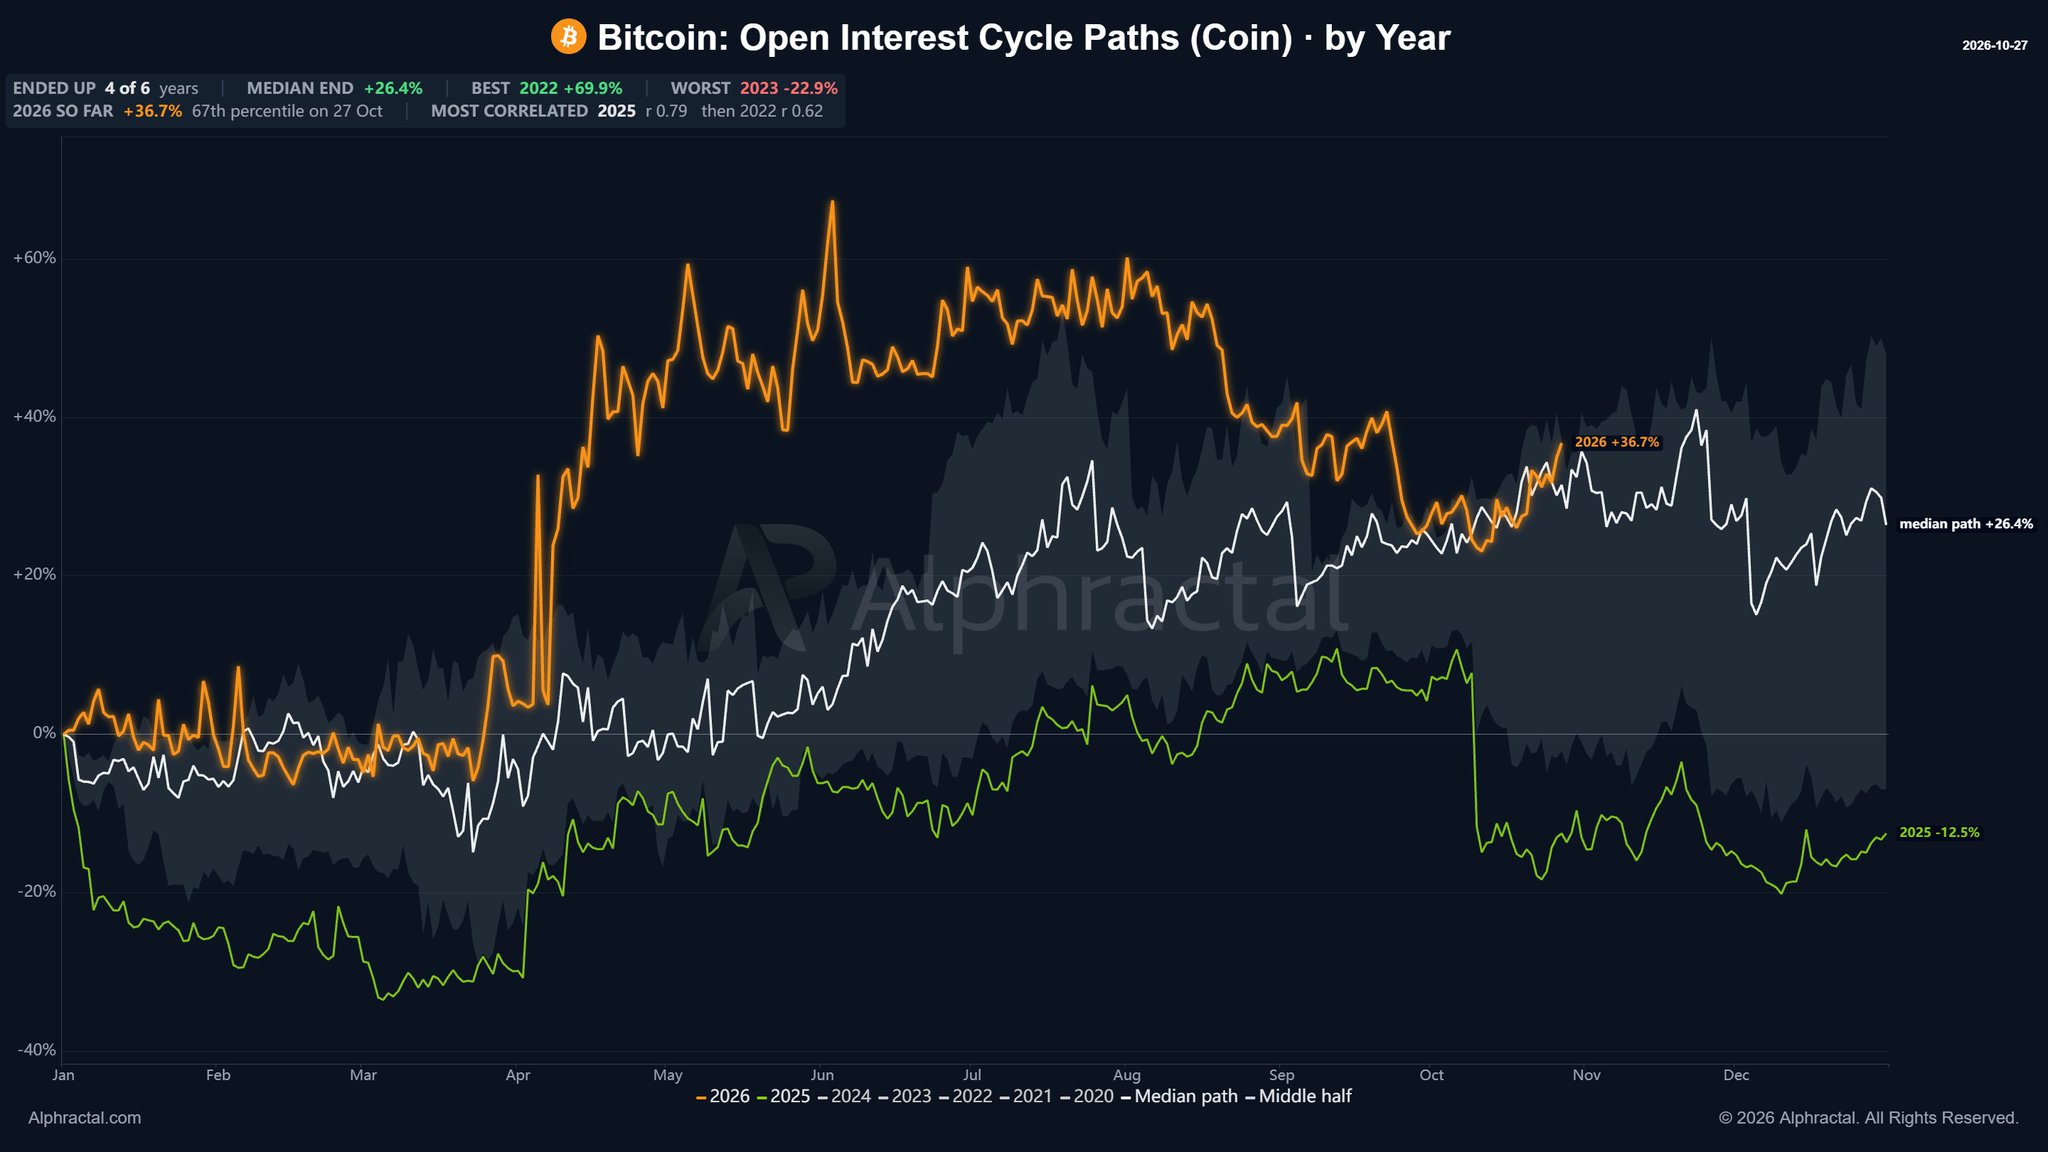
The most statistically correlated prior year is 2025, with a path correlation of r=0.79. The second-closest match is 2022, at r=0.62. Alphractal explicitly warns that high correlation does not mean identical outcome: 2025 finished the full year at -12.5%, while 2022 finished at +69.9%. Two years with similar trajectory shapes produced radically opposite final readings. That warning is core to how this data should be interpreted.
What Expanding OI Signals — And What It Does Not
Rising BTC-denominated OI signals one thing with certainty: derivatives participation is increasing. More BTC is committed to open positions than at the start of the year. What it does not confirm is the direction of those positions. Alphractal explicitly notes that rising OI in uncertain market conditions can reflect expanding short positioning or elevated leverage just as readily as bullish accumulation. This is the critical distinction between an OI metric and a directional signal.
The data does confirm that 2026 has already built a new structural baseline for derivatives activity — one that exceeds most prior years before the final quarter closes. Whether that base becomes the foundation for a year-end move comparable to 2022’s +69.9%, or reverses in Q4 as 2025’s -12.5% outcome demonstrated, depends on whether the positioning is long-heavy or short-heavy — a question the OI metric alone cannot answer. On-chain data tracking UTXO age bands and whale movement patterns would need to be cross-referenced to assess the directional composition of this OI expansion.
Historical Year-End Outcomes — The Range That Defines the Stakes
| Year | Full-Year OI Change (BTC) |
|---|---|
| 2022 | +69.9% |
| 2021 | +49.5% |
| 2024 | +43.1% |
| Median | +26.4% |
| 2020 | +9.7% |
| 2025 | -12.5% |
| 2023 | -22.9% |
| 2026 (YTD) | +36.7% |
Source: @Alphractal (X), October 27, 2026
2026 currently sits between 2024’s +43.1% and the historical median of +26.4%. With Q4 still open, any directional move in either spot or futures market will pull 2026’s final reading toward one of the historical bookends — either the upper cluster of +43%–+70% or the negative outcomes of 2023 and 2025. Institutional activity in Q4, such as miner and corporate treasury behavior, will likely determine which cluster 2026 ultimately joins.
Bullish Scenario
If the expanded OI reflects net long positioning and Q4 price action holds above current levels, 2026 could close in the upper historical cluster — tracking closer to 2024’s +43.1% or 2022’s +69.9% outcome. That would confirm 2026 as a structurally above-average year for derivatives growth.
Bearish Scenario
If the OI expansion reflects leveraged short positioning or over-leveraged longs that unwind into year-end, the 2025 path (r=0.79 correlation, -12.5% final reading) becomes the cautionary precedent. A Q4 deleveraging event could pull the +36.7% reading negative before December closes.
Alphractal’s analysis does not offer a price target, a support level, or a directional trade recommendation. The note raises a pointed structural question: is 2026 building new derivatives infrastructure, or repeating a familiar pre-Q4 pattern that resolves sharply in either direction? That question remains open.
The OI-in-coins metric has already answered one question definitively — 2026 derivatives activity is above average. The direction of that activity, and where it ends on December 31, remains the only number that matters. Watch the BTC-denominated OI reading on Alphractal’s live tracker: if it sustains above +36.7% through November, the upper historical cluster remains in range. If it breaks back toward the median, the 2025 correlation becomes the dominant risk scenario.
Frequently Asked Questions
Why does Alphractal measure Bitcoin Open Interest in BTC instead of USD?
Which prior year does 2026 Bitcoin OI most closely resemble, and what did that year produce?
Does a +36.7% rise in BTC Open Interest confirm a bullish directional move?
What is the full historical range of Bitcoin’s year-end OI change in BTC terms?
Source: Alphractal · Published by CoinsProbe Markets Desk
The opinions and market insights shared on CoinsProbe represent the views of individual authors based on prevailing market conditions at the time of publication. Cryptocurrency investments carry significant risk and volatility. Readers are encouraged to conduct their own research and seek professional financial advice before making investment decisions. CoinsProbe and its contributors do not accept responsibility for financial losses or decisions made based on published content.
CoinsProbe may publish sponsored articles, affiliate links, or promotional collaborations. All sponsored material is clearly labeled to maintain transparency with our audience. Our editorial decisions remain fully independent, and advertising partnerships do not influence reviews, rankings, or published opinions.
Since 2023, CoinsProbe has delivered reliable insights on cryptocurrency, blockchain, and digital assets. Our content is created by experienced researchers and analysts who follow strict editorial standards focused on accuracy, transparency, and credibility. Every article is carefully reviewed and verified using trusted sources and current market data. We provide unbiased analysis and timely updates covering everything from emerging crypto projects to major industry developments.